27527 Brisk Dr · Madison, AL
Flood risk 1/10 · Minimal
- FEMA flood zone
- X (unshaded)
- Chance of flooding over 30 yrs
- 0.0%
- Est. flood insurance / yr
- $507 – $1,088
Fire risk 1/10 · Minimal
- Est. fire insurance / yr
- $916 – $1,700
Heat risk 6/10 · Moderate
- Hot days now (above 105°F)
- 7 days/yr
- Hot days in 30 yrs
- 20 days/yr
Wind risk 5/10 · Moderate
- Chance of severe wind over 30 yrs
- 25.0%
Air-quality risk 2/10 · Minimal
- Unhealthy air days now
- 1 days/yr
- Unhealthy air days in 30 yrs
- 1 days/yr
Risk factors via First Street. Map © Google.
Why this score? — see what drove the D- grade
The composite is a weighted blend of 9 inputs, each scored 0–100. Each bar is that input's sub-score; the figure is the points it added to the 100-point composite (weight × sub-score).
- Cash flow +11.5/30.0
- ARV discount +8.1/15.0
- Condition / age +4.0/5.0
- Livability +3.8/5.0
- 1% rule +3.5/10.0
- DSCR +3.4/10.0
- Rent growth +2.8/5.0
- Schools +2.8/10.0
- Appreciation +0.0/10.0
$209,850
🖨 Deal sheet (PDF) 📄 Offer letter ✓ Due diligence
Listing remarks
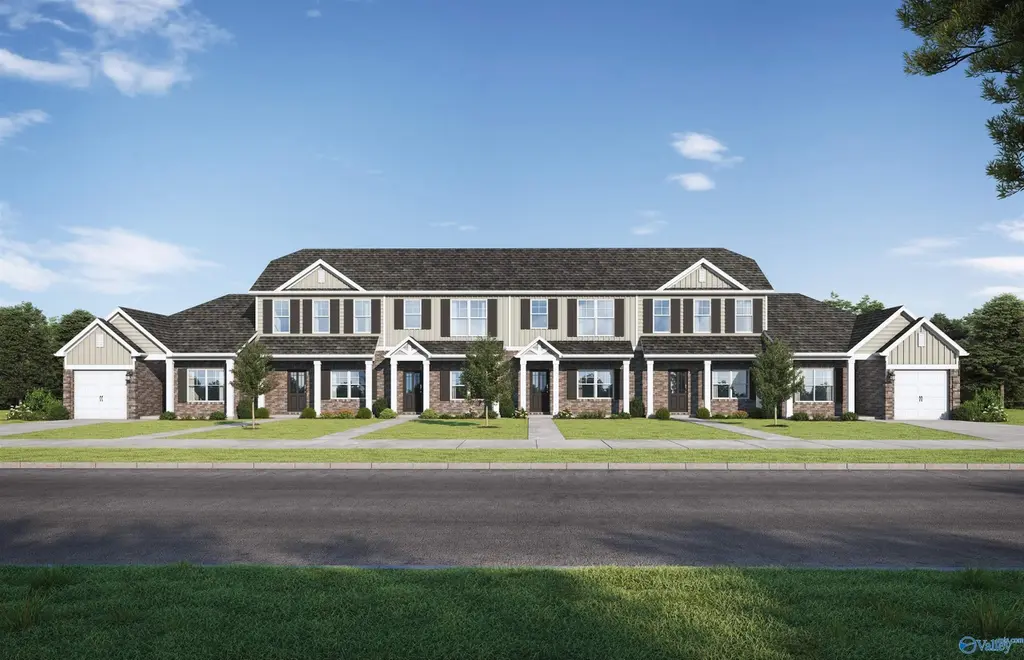
Under Construction-The Tyndall. THREE BEDROOMS and 3 FULL BATHS! One bedroom downstairs on the main w/ full bath is perfect for guests or a home office. Upstairs you’ll find a spacious, secluded primary suite w/ walk-in closet & dual vanity. The 3rd bedroom is on the opposite side of the house & also has a walk-in closet & its own full bathroom! Includes quartz countertops, stainless steel appliances, & luxury plank flooring. Storage unit attached to back patio for all your toys! Enjoy a low maintenance lifestyle with included lawn care. Visuals feature a similar home for inspiration. Pricing is the base starting point; final price varies based on selected featu
Key facts
- Walk-in closet
- Dual vanity
- Storage unit
Tags
Property features AI
Finance
- Other: Energy-efficient features: water heater, programmable thermostat, spray foam insulation, radiant roof barrier
- HOA & community: Homeowners association with monthly fee of $30; HOA maintains grounds; Community common grounds; Sidewalks and street lights
Exterior
- Parking: Paved asphalt driveway
- Utilities: Public water; Public sewer
- Home design: Residential townhouse; Two levels; New construction; Interior unit
- Construction: Vinyl siding; Foam insulation; Slab foundation
- Exterior features: Covered front porch; Covered patio; Patio
Interior
- Kitchen: Range; Dishwasher; Microwave; Garbage disposal
- Bathrooms: Three full bathrooms
- Heating & cooling: Central heating; Central air conditioning
- Interior features: Double pane windows; Low-flow plumbing fixtures
Neighborhood map
What this means for you Summary
Snapshot
- This is a 3-bed/3.0-bath townhouse listed at $210k. Condition is rated good.
Deal economics
- At list price, monthly cash flow is $-70 ($-836/yr) — negative.
- To cash-flow at today's rent, offer at most $200k (4.8% below list).
- To meet the 1% rule (rent ≥ 1% of price), the offer needs to be $179k (14.9% below list).
- Recommended offer: $179k (14.9% below list) — sets the bar for 1% rule.
- Cap rate 5.9% vs local median 2.6% in Madison — top-decile yield for the area; either an underpriced asset or a hidden risk that comps aren't pricing in. Stress-test before assuming the spread holds.
Location & tenants
- Location reads 76/100 on livability (#12 in AL, #3,280 nationally) — a middle-class / working-renter tenant base. Strengths: employment A+, housing A+, crime B+; Watch: amenities F, commute F.
- Limestone County (rural): math 21% / reading 44% proficiency, ranked #52 of 129 in AL (top 40%) — families likely to look elsewhere, expect single-tenant / working-renter base with shorter leases.
- Zoned schools: Creekside Elementary School (math 42% / reading 66%, grade C, #96 of 627 statewide, top 16%, 560 students, 41% FRL); East Limestone High School (math 21% / reading 43%, grade F, #59 of 305 statewide, top 21%, 1,282 students, 40% FRL) — zoned schools at 40% FRL track the district average.
- Market conditions: Rents rising (+1.1%/yr); 826 active listings in the ZIP; 6 comparable units currently listed for rent nearby; rentals at typical pace (median 26d on market — plan ~3-4 weeks tenant-placement turnaround); high-income renter base; 494 units permitted in Limestone County in 2024 (0 in 5+ unit buildings).
- This rent is only 17% of the median local income ($130k/yr) — well below the 30% rent-burden line; pricing power to push rent on renewal without tenant pushback.
Forward outlook
- Local home prices are declining (-3.0%/yr); year-one equity from $1k of loan paydown is wiped out by about $6k of value loss. Plan a longer hold.
- Limestone County population projected at +43% by 2050 — long-run rental-demand tailwind backs the buy-and-hold thesis.
Negotiation context
- It's been on market 17 days — a 2% lower offer ($207k) is reasonable based on typical stale-listing flexibility.
Risks & watch-outs
- Climate carrying-cost: moderate wind risk, 25% chance of damaging wind over 30y; extreme-heat days projected 7→20/yr by 2055 (HVAC capex compounding) — expect insurance premiums to compound above CPI over the hold.
Questions for the listing agent
- What do current leases actually rent for vs. the listed asking? Can we see a recent rent roll and the last 12 months of T-12 income?
- What does the HOA fee cover, when was the last increase, and are there any pending special assessments or reserve-fund shortfalls?
- Is there a deadline driving the sale (1031 exchange, divorce, estate, relocation)? That informs how much negotiation room exists.
- Schools are A-rated — typically a magnet for longer-tenancy family renters. What's the average tenant stay here, and is there a school-zone premium baked into asking?
- The area grade is low — what's the realistic commute time and amenity access for the typical tenant pool here? Any planned neighborhood developments (good or bad) we should know about?
- What's the average days-on-market for RENTAL listings here right now (not sales)? A rising rental-DOM trend means longer vacancies and softer asking-rent achievability than the comps imply.
- What's the recent tenant-quality profile in this submarket — average credit score on applications, eviction rate, late-payment / NSF rate, and stable-employment percentage? A property-management company in the area should have these aggregated.
- How much new for-sale + rental construction is in the pipeline within 1–3 miles? Heavy new supply typically softens prices + rents 12–24 months out; constrained supply supports both.
Investment metrics
- 1% rule
- 0.85% ✗
- Cap rate
- 5.89%
- Cash-on-cash
- -1.42%
- DSCR
- 0.94
- GRM
- 9.8
CMA / ARV
- ARV (on-the-fly)
- $212,562
- Comps found
- 8
Show comp detail 8 sales within ~0.75 mi
| Address | Dist | Beds/Ba | Sqft | Sold | Price | $/sf | Match |
|---|---|---|---|---|---|---|---|
| 27577 Brisk Dr | 0.05mi | 3/3.0 | 1,446 (0%) | 2mo | $216,006 | $149 | 96 |
| 12100 Chilly Dr | 0.02mi | 3/3.0 | 1,446 (0%) | 3mo | $219,650 | $152 | 96 |
| 12086 Windy Ln | 0.06mi | 3/3.0 | 1,446 (0%) | 3mo | $209,850 | $145 | 95 |
| 12078 Windy Ln | 0.06mi | 3/3.0 | 1,446 (0%) | 3mo | $209,850 | $145 | 95 |
| 12080 Chilly Dr | 0.04mi | 3/3.0 | 1,446 (0%) | 6mo | $200,350 | $139 | 93 |
| 12089 Windy Ln | 0.03mi | 3/3.0 | 1,500 (+4%) | 4mo | $200,850 | $134 | 89 |
| 12098 Windy Ln | 0.05mi | 3/3.0 | 1,500 (+4%) | 3mo | $223,150 | $149 | 89 |
| 12070 Windy Ln | 0.07mi | 3/3.0 | 1,500 (+4%) | 3mo | $219,850 | $147 | 88 |
Match score weights: distance 35% · size 25% · config 20% · recency 20%. Top-matched comps best support the ARV.
Projected returns pro-forma
-3.0% appreciation · 1.15% rent growth · sell at horizon
- IRR
- -20.8%
- Equity multiple
- 0.29×
- Total profit
- $-41,662
- Equity at exit
- $31,289
- IRR
- -18.9%
- Equity multiple
- 0.07×
- Total profit
- $-54,713
- Equity at exit
- $18,144
Cash invested: $58,758 (down + closing). Projections, not guarantees.
Landlord ↔ Tenant lean methodology
- Overall (STATE)
- 90 Strongly Landlord-Friendly
- State Alabama
- 90 Strongly Landlord-Friendly · R+15
- County
- — inherits STATE
- City
- — inherits STATE
ZIP-level market 35756
- Home prices YoY
- -21.7%
- Rents YoY
- 1.1%
- Active inventory
- 826
- Price-to-rent
- 9.8×
Monthly cashflow live
- Estimated rent
- $1,785 high interval (Pro) →
- Mortgage (P&I)
- −$1,100
- Tax est. 1.5%
- −$262 /mo · $3,148/yr
- Insurance
- −$87
- HOA
- −$30
- Lot rent
- −$0
- Vacancy / Maint / Mgmt
- −$375
- Net cashflow
- $-70
Break-even live
Sensitivity live
| Price | -10% $75 | -5% $3 | +0% $-70 | +5% $-142 | +10% $-215 |
|---|---|---|---|---|---|
| Rent | -10% $-211 | -5% $-140 | +0% $-70 | +5% $1 | +10% $71 |
| Rate | -1.0pp $36 | -0.5pp $-16 | base $-70 | +0.5pp $-124 | +1.0pp $-179 |
UW: 25.0% down · 7.5% · 30yr · 1.5% tax · 5.0% vac · 8.0% maint · 8.0% mgmt
Financing live
Cash to close
- Down payment
- $52,462
- Closing costs
- $6,296
- Reserves months
- —
- Total cash needed
- —
Loan-product check · same deal, 3 products live
Conventional
25% down · 7.5% · 30yr
- Down + closing
- —
- Monthly P&I
- —
- Monthly cashflow
- —
- DSCR
- —
- Eligible?
- —
Personal DTI + credit; lowest rate.
DSCR
20% down · 8.5% · 30yr
- Down + closing
- —
- Monthly P&I
- —
- Monthly cashflow
- —
- DSCR
- —
- Eligible?
- —
No personal income docs; deal must DSCR.
Hard money
10% down · 12.0% · 12mo
- Down + closing
- —
- Monthly P&I
- —
- Monthly cashflow
- —
- DSCR
- —
- Eligible?
- —
Short-term bridge; refi at stabilization.
Rent comps 6 comps
| Address | Beds | Baths | Sqft | Rent | $/sqft | DOM | Units | Dist |
|---|---|---|---|---|---|---|---|---|
| 27573 Brisk Dr Madison, AL | 3.0 | 2.0 | 1175 | $1,499 | $1.28 | 25d | 1 | 0.02mi |
| 12092 Chilly Dr Madison, AL | 3.0 | 3.0 | 1446 | $1,495 | $1.03 | 46d | 1 | 0.03mi |
| 12086 Windy Ln Madison, AL | 3.0 | 3.0 | 1446 | $1,800 | $1.24 | 16d | 1 | 0.03mi |
| 110 Oakland Spgs Madison, AL | 1.0–3.0 | 1.0–2.0 | 1075 | $1,779 | $1.65 | 16d | 35 | 0.83mi |
| 28600 Huntsville Brownsferry Rd Madison, AL | 3.0 | 2.5 | 1821 | $1,758 | $0.97 | 16d | 4 | 1.08mi |
| 26159 Valley Ridge Rd Madison, AL | 4.0 | 2.0 | 1631 | $1,845 | $1.13 | 25d | 1 | 1.45mi |
HOA detail
- Monthly dues
- $30 · $360/yr
- Likely covers
- landscaping
Listing history 12 events
-
2026-06-22days on market $209,850 Active 17 DOM
-
2026-06-18days on market $209,850 Active 14 DOM
-
2026-06-17days on market $209,850 Active 13 DOM
-
2026-06-16days on market $209,850 Active 12 DOM
-
2026-06-15days on market $209,850 Active 11 DOM
-
2026-06-14days on market $209,850 Active 9 DOM
-
2026-06-10days on market $209,850 Active 6 DOM
-
2026-06-09days on market $209,850 Active 5 DOM
-
2026-06-08days on market $209,850 Active 4 DOM
-
2026-06-07days on market $209,850 Active 3 DOM
-
2026-06-05remarks 677-char remark
-
2026-06-05$209,850 Active 1 DOM
ⓘ Source: listings_history table (triggers on properties + properties_extension) + one-shot
backfill from property_details.listing_events for pre-trigger history.
Climate risk First Street
- Flood 1/10 Low FEMA zone X (unshaded) · 0% chance over 30 yrs
- Wildfire 1/10 Low
- Heat 6/10 Major 7 d/yr ≥105°F today · 20 d/yr by 30 yrs out
- Wind 5/10 Major 25% chance of damaging wind over 30 yrs
- Air quality 2/10 Low 1 unhealthy d/yr today · 1 by 30 yrs out
Nearby sold comps map
Loading sold comps map…
Walkable amenities ~0.75 mi
Loading nearby amenities…
Taxation est. · year 1
- Rental income
- $21,426
- − Mortgage interest
- −$11,755
- − Property taxes
- −$3,148
- − Insurance
- −$1,049
- − Repairs & maintenance
- −$1,714
- − Management
- −$1,714
- − HOA
- −$360
- − Depreciation
- −$6,105
- Taxable loss
- −$4,419
- Est. tax savings @ 24.0%
- +$1,061
- After-tax cash flow
- $224/yr
For passive investors: Depreciation is non-cash, so a rental often shows a tax loss while cash-flowing — sheltering income. Rental losses are passive: they offset passive income freely, and up to $25,000/yr can offset ordinary (W-2) income if you actively participate and your MAGI is under $100k (phasing out to $0 by $150k); unused losses carry forward. On sale, claimed depreciation is recaptured at up to 25%, and gains may owe capital-gains tax (a 1031 exchange can defer both). Figures are a year-1 estimate at your 24.0% rate — not tax advice; consult a CPA.
Condition & rehab AI · 13 photos
The property is in good condition with no major repairs needed. Painting and updating the flooring can significantly increase its resale and rental value.
Value-add opportunities
- Both Painting the exterior and interior walls — Painting can enhance the curb appeal and interior aesthetics, making the property more attractive to potential buyers and renters.
- Both Updating the flooring — Updating the flooring can improve the overall look and feel of the property, making it more appealing to potential buyers and renters.
Renovation cost estimate screening
Value-add ROI direction
- Both Painting the exterior and interior walls — Painting can enhance the curb appeal and interior aesthetics, making the property more attractive to potential buyers and renters. ↑
- Both Updating the flooring — Updating the flooring can improve the overall look and feel of the property, making it more appealing to potential buyers and renters. ↑
ⓘ Cost ranges are severity-bucket heuristics (US national rule-of-thumb). Get contractor quotes + a written scope before underwriting a rehab budget.
Schools (NCES district)
- District
- Limestone County
- NCES district ID
- 0102100
- Math proficiency
- 21% ▼ -23.00%
- Reading proficiency
- 44% ▼ -3.00%
- Median HH income
- $48,972
- Composite
- 28.09/100
- National rank
- #6829
- State rank
- #52 of 129 in AL
Livability — Madison
- Score
- 76/100
- State rank
- #12
- US rank
- #3280
Category grades
Schools grade is shown separately in the Schools card above.
Census & demographics
- County
- Limestone County · 80,439 people
- City population
- 93,742
- Metro
- Huntsville, AL
- Population (ZIP)
- 24,947
- Household income
- $129,852
- Rent vs Own
- Severe rent burden
- 286.0
Population outlook (Limestone County) Hauer SSP2
- Today (2025)
- 111,441 people
- By 2030
- 121,272 · +8.8%
- By 2040
- 140,705 · +26.3%
- By 2050
- 159,069 · +42.7%
- By 2075
- 202,231 · +81.5%
- By 2100
- 230,608 · +106.9%
Race, ethnicity, and origin ACS 2023
- Neighborhood character
- Diverse neighborhood (Simpson 0.59)
- Race & ethnicity
- White 59% Black 21% Two or more races 9% Hispanic / Latino 7% Asian 6% Native American 1%
- Hispanic origin (detail)
- Mexican 1% Puerto Rican 2%
- Common ancestry
- Italian 3% Serbian 3% Slovak 3%
- Foreign-born
- 8% · China, South Korea, Canada
- Languages at home
- 90% English-only · Spanish 3% Korean 2% Other Indo-European 2%
Political lean MEDSL · Limestone
- 2024 margin
- Solid R (+43.9) · D 27.5% · R 71.4% · Other 1.2%
- 2008→2024 swing
- -2.0pp toward R · 2008: -41.9pp · 2024: -43.9pp
- All cycles
- 2024: R+43.9 2020: R+42.6 2016: R+49.5 2012: R+43.6 2008: R+41.9
Not yet ingested
- Civics
- —
Market trends
- HPI YoY
- ▼ -50.15%
- Current HPI
- 180.5285
- Rent YoY
- ▲ 1.15%
- Metro
- Huntsville, AL
- State GDP YoY
- ▲ 2.94%
- F500 in state
- 4
Industry mix (Fortune 500 HQ in AL)
| Industry | F500 HQs | Revenue |
|---|---|---|
| Financial Services | 1 | $8B |
|
||
| Healthcare | 1 | $5B |
|
||
Price history
1 event — show timeline
- 2026-06-04 Listed $209,850 VMLS
Cash-flow waterfall
monthlySold comps — $/sqft
last 12 mo · ≤1 miLoading sold comps…