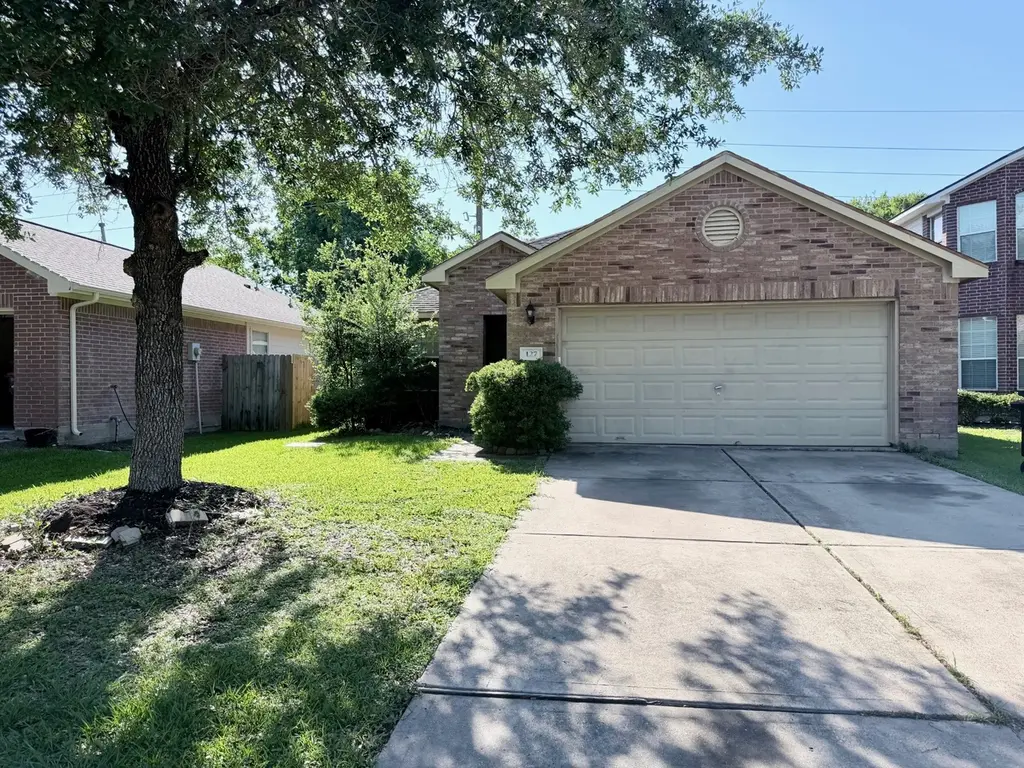
127 Big Thicket Dr · Rosenberg, TX
Flood risk 1/10 · Minimal
- FEMA flood zone
- X (unshaded)
- Chance of flooding over 30 yrs
- 0.0%
- Est. flood insurance / yr
- $507 – $1,088
Fire risk 3/10 · Minor
- Est. fire insurance / yr
- $1,222 – $2,270
Heat risk 9/10 · Severe
- Hot days now (above 110°F)
- 7 days/yr
- Hot days in 30 yrs
- 23 days/yr
Wind risk 9/10 · Severe
- Chance of severe wind over 30 yrs
- 99.0%
Air-quality risk 2/10 · Minimal
- Unhealthy air days now
- 1 days/yr
- Unhealthy air days in 30 yrs
- 1 days/yr
Risk factors via First Street. Map © Google.
Why this score? — see what drove the D- grade
The composite is a weighted blend of 9 inputs, each scored 0–100. Each bar is that input's sub-score; the figure is the points it added to the 100-point composite (weight × sub-score).
- ARV discount +13.0/15.0
- Cash flow +7.8/30.0
- Schools +4.6/10.0
- 1% rule +3.5/10.0
- Livability +3.1/5.0
- Condition / age +2.5/5.0
- Rent growth +2.0/5.0
- DSCR +1.9/10.0
- Appreciation +0.0/10.0
$220,000
🖨 Deal sheet 📄 Offer letter ✓ Due diligence
Listing remarks
This is 3-bedroom, 2-bath home located in a low-maintenance community with no back neighbors. This property features high ceilings and an open-concept layout, creating a bright and spacious feel throughout. Conveniently situated just minutes from Sugar Land Town Square and several nearby shopping centers, you’ll enjoy easy access to dining, retail, and entertainment.
Key facts
- High ceilings
- No back neighbors
- Open-concept layout
Tags
Property features AI
Finance
- HOA & community: Association: Brazos; Annual association fee of $375
Exterior
- Parking: Attached 2-car garage
- Utilities: Public water; Public sewer
- Home design: Residential property; Built in 2005; Slab foundation
- Construction: Brick and vinyl siding exterior; Composition roof
- Exterior features: Subdivision lot
Interior
- Kitchen: Dishwasher; Gas oven and gas range; Microwave; Garbage disposal
- Bedrooms: Primary bedroom on the first floor (approx. 15 x 14); Two additional first-floor bedrooms (each approx. 12 x 10); Another first-floor bedroom (approx. 12 x 10)
- Flooring: Carpet; Tile
- Bathrooms: 2 full bathrooms
- Heating & cooling: Central heating (gas); Central electric air conditioning
- Interior features: Dishwasher; Disposal; Gas oven and gas range; Microwave; Carpet flooring; Tile flooring; Seven rooms total
Neighborhood map
What this means for you Summary
Snapshot
- This is a 3-bed/2.0-bath single-family listed at $220k.
Deal economics
- At list price, monthly cash flow is $-243 ($-3k/yr) — negative.
- To cash-flow at today's rent, offer at most $177k (19.5% below list).
- To meet the 1% rule (rent ≥ 1% of price), the offer needs to be $188k (14.7% below list).
- Recommended offer: $177k (19.5% below list) — sets the bar for cash-flow.
- Cap rate 5.0% vs local median 3.4% in Rosenberg — top-decile yield for the area; either an underpriced asset or a hidden risk that comps aren't pricing in. Stress-test before assuming the spread holds.
Location & tenants
- Location reads 62/100 on livability (#922 in TX) — a middle-class / working-renter tenant base. Strengths: cost of living A+, housing A+, crime B; Watch: amenities F, commute F, health & safety F.
- Lamar CISD (suburban): math 50% / reading 53% proficiency, ranked #116 of 826 in TX (top 14%) — acceptable for families but not a draw, mixed tenant base, ~2y average lease.
- Zoned schools: George Ranch H S (math 52% / reading 76%, grade B-, #224 of 1,632 statewide, top 14%, 2,511 students, 27% FRL) — zoned schools average 27% FRL vs 43% district-wide (15 pts lower); this property's tenant base skews higher-income than the district average.
- Zoned-school proficiency averages 64% at this address vs 52% district-wide (+12 pts) — the actual schools serving this property are materially stronger than the Lamar CISD average implies; a family-tenant draw the district grade alone would hide.
- Market conditions: Rents soft (-1.8%/yr); 1332 active listings in the ZIP; 21 comparable units currently listed for rent nearby; rentals leasing fast (median 11d on market — plan ~1-2 weeks tenant-placement turnaround); solid renter incomes; 12,093 units permitted in Fort Bend County in 2024 (815 in 5+ unit buildings).
Forward outlook
- Local home prices are declining (-3.0%/yr); year-one equity from $2k of loan paydown is wiped out by about $7k of value loss. Plan a longer hold.
- Fort Bend County population projected at +75% by 2050 — long-run rental-demand tailwind backs the buy-and-hold thesis.
Negotiation context
- Only 13 days on market — expect competitive offers; lowballing is unlikely to land.
Risks & watch-outs
- Climate carrying-cost: severe wind risk, 99% chance of damaging wind over 30y; extreme-heat days projected 7→23/yr by 2055 (HVAC capex compounding) — expect insurance premiums to compound above CPI over the hold.
Questions for the listing agent
- What do current leases actually rent for vs. the listed asking? Can we see a recent rent roll and the last 12 months of T-12 income?
- What does the HOA fee cover, when was the last increase, and are there any pending special assessments or reserve-fund shortfalls?
- Is there a deadline driving the sale (1031 exchange, divorce, estate, relocation)? That informs how much negotiation room exists.
- Schools are D-rated, which usually means shorter tenancies and higher turnover. Who's the typical renter profile here, and what's been the actual vacancy rate?
- The area grade is low — what's the realistic commute time and amenity access for the typical tenant pool here? Any planned neighborhood developments (good or bad) we should know about?
- What's the average days-on-market for RENTAL listings here right now (not sales)? A rising rental-DOM trend means longer vacancies and softer asking-rent achievability than the comps imply.
- What's the recent tenant-quality profile in this submarket — average credit score on applications, eviction rate, late-payment / NSF rate, and stable-employment percentage? A property-management company in the area should have these aggregated.
- How much new for-sale + rental construction is in the pipeline within 1–3 miles? Heavy new supply typically softens prices + rents 12–24 months out; constrained supply supports both.
Investment metrics
- 1% rule
- 0.85% ✗
- Cap rate
- 4.97%
- Cash-on-cash
- -4.73%
- DSCR
- 0.79
- GRM
- 9.8
CMA / ARV
- ARV (median comp)
- $250,944
- List price
- $220,000
- Delta
- -12.33%
- Verdict
- UNDERPRICED
- Comps
- 20 within 1.0 mi
Show comp detail 11 sales within ~0.75 mi
| Address | Dist | Beds/Ba | Sqft | Sold | Price | $/sf | Match |
|---|---|---|---|---|---|---|---|
| 5751 Wandering Creek Dr Dr | 0.16mi | 3/2.0 | 1,437 (-1%) | 6mo | $225,000 | $157 | 85 |
| 127 Thunder Basin Dr | 0.15mi | 3/2.0 | 1,437 (-1%) | 15mo | $265,000 | $184 | 79 |
| 250 Saddleback Springs Dr | 0.24mi | 3/2.0 | 1,437 (-1%) | 10mo | $249,990 | $174 | 78 |
| 115 Anvil Rock Ln | 0.09mi | 3/2.0 | 1,408 (-3%) | 19mo | $235,000 | $167 | 74 |
| 5767 Wandering Creek Drive Dr | 0.19mi | 3/2.5 | 1,550 (+6%) | 7mo | $220,000 | $142 | 73 |
| 131 Thunder Basin Dr | 0.15mi | 3/2.0 | 1,285 (-12%) | 12mo | $238,500 | $186 | 63 |
| 5714 Picacho Ln | 0.13mi | 3/2.0 | 1,255 (-14%) | 21mo | $265,000 | $211 | 53 |
| 118 Anvil Rock Ln | 0.10mi | 3/2.0 | 1,255 (-14%) | 24mo | $239,900 | $191 | 52 |
| 6423 N Shore Bnd | 0.58mi | 3/2.0 | 1,515 (+4%) | 21mo | $285,000 | $188 | 49 |
| 5815 Prade Ranch Ln | 0.43mi | 3/2.0 | 1,674 (+15%) | 8mo | $389,999 | $233 | 48 |
| 530 Arbor Green Ln | 0.75mi | 3/2.0 | 1,529 (+5%) | 23mo | $292,000 | $191 | 38 |
Match score weights: distance 35% · size 25% · config 20% · recency 20%. Top-matched comps best support the ARV.
Projected returns pro-forma
-3.0% appreciation · 0.0% rent growth · sell at horizon
- IRR
- -28.2%
- Equity multiple
- 0.08×
- Total profit
- $-56,469
- Equity at exit
- $32,803
- IRR
- -47.8%
- Equity multiple
- -0.46×
- Total profit
- $-89,729
- Equity at exit
- $19,022
Cash invested: $61,600 (down + closing). Projections, not guarantees.
Landlord ↔ Tenant lean methodology
- Overall (STATE)
- 87 Strongly Landlord-Friendly
- State Texas
- 87 Strongly Landlord-Friendly · R+5
- County
- — inherits STATE
- City
- — inherits STATE
ZIP-level market 77469
- Home prices YoY
- -25.1%
- Rents YoY
- -1.8%
- Active inventory
- 1332
- Price-to-rent
- 9.8×
Monthly cashflow live
- Estimated rent
- $1,877 high interval (Pro) →
- Mortgage (P&I)
- −$1,154
- Tax from tax record
- −$450 /mo · $5,397/yr
- Insurance
- −$92
- HOA
- −$31
- Vacancy / Maint / Mgmt
- −$394
- Net cashflow
- $-243
Break-even live
UW: 25.0% down · 7.5% · 30yr · 1.5% tax · 5.0% vac · 8.0% maint · 8.0% mgmt
Financing live
Cash to close
- Down payment
- $55,000
- Closing costs
- $6,600
- Reserves months
- —
- Total cash needed
- —
Loan-product check · same deal, 3 products live
Conventional
25% down · 7.5% · 30yr
- Down + closing
- —
- Monthly P&I
- —
- Monthly cashflow
- —
- DSCR
- —
- Eligible?
- —
Personal DTI + credit; lowest rate.
DSCR
20% down · 8.5% · 30yr
- Down + closing
- —
- Monthly P&I
- —
- Monthly cashflow
- —
- DSCR
- —
- Eligible?
- —
No personal income docs; deal must DSCR.
Hard money
10% down · 12.0% · 12mo
- Down + closing
- —
- Monthly P&I
- —
- Monthly cashflow
- —
- DSCR
- —
- Eligible?
- —
Short-term bridge; refi at stabilization.
Rent comps 21 comps
| Address | Beds | Baths | Sqft | Rent | $/sqft | DOM | Units | Dist |
|---|---|---|---|---|---|---|---|---|
| 5131 Williams Way Blvd Richmond, TX | 1.0–2.0 | 1.0–2.0 | 917 | $1,968 | $2.14 | 2d | 64 | 0.54mi |
| 6826 Blue Ridge Dr Richmond, TX | 3.0 | 2.0 | 1580 | $1,769 | $1.12 | 43d | 1 | 1.17mi |
| 6915 Renfro Dr Richmond, TX | 4.0 | 2.0 | 1517 | $1,745 | $1.15 | 20d | 1 | 1.18mi |
| 22235 Davenport Downs Ln Richmond, TX | 3.0 | 2.0 | 1760 | $2,266 | $1.29 | 5d | 1 | 1.26mi |
| 22155 Wildwood Park Rd Richmond, TX | 1.0–2.0 | 1.0–2.0 | 928 | $2,255 | $2.43 | 12d | 10 | 1.30mi |
| 21811 Wildwood Park Rd Unit 21848 Richmond, TX | 2.0 | 2.0 | 972 | $1,655 | $1.70 | 12d | 1 | 1.30mi |
| 21811 Wildwood Park Rd Unit 21868 Richmond, TX | 2.0 | 2.0 | 972 | $1,398 | $1.44 | 10d | 1 | 1.30mi |
| 21811 Wildwood Park Rd Unit 2174 Richmond, TX | 2.0 | 2.0 | 972 | $1,622 | $1.67 | 17d | 1 | 1.30mi |
| 21811 Wildwood Park Rd Apt 424 Richmond, TX | 2.0 | 2.0 | 972 | $1,374 | $1.41 | 5d | 1 | 1.30mi |
| 21811 Wildwood Park Rd Unit 2112 Richmond, TX | 2.0 | 2.0 | 972 | $1,366 | $1.41 | 2d | 1 | 1.30mi |
| 22155 Wildwood Park Rd Unit 22188 Richmond, TX | 3.0 | 2.0 | 1380 | $1,855 | $1.34 | 43d | 1 | 1.31mi |
| 22155 Wildwood Park Rd Unit 22212 Richmond, TX | 2.0 | 2.0 | 972 | $1,395 | $1.44 | 43d | 1 | 1.31mi |
| 22155 Wildwood Park Rd Unit 2174 Richmond, TX | 2.0 | 2.0 | 972 | $1,379 | $1.42 | 10d | 1 | 1.31mi |
| 22155 Wildwood Park Rd Unit 424 Richmond, TX | 2.0 | 2.0 | 972 | $1,355 | $1.39 | 5d | 1 | 1.31mi |
| 22155 Wildwood Park Rd Unit 3112 Richmond, TX | 3.0 | 2.0 | 1380 | $1,812 | $1.31 | 2d | 1 | 1.31mi |
| 22155 Wildwood Park Rd Unit 2112 Richmond, TX | 2.0 | 2.0 | 972 | $1,347 | $1.39 | 2d | 1 | 1.31mi |
| 22155 Wildwood Park Rd Unit 3174 Richmond, TX | 3.0 | 2.0 | 1380 | $1,844 | $1.34 | 10d | 1 | 1.31mi |
| 22155 Wildwood Park Rd Unit 3047 Richmond, TX | 3.0 | 2.0 | 1380 | $1,855 | $1.34 | 11d | 1 | 1.34mi |
| 22161 Wildwood Park Rd Richmond, TX | 2.0 | 2.0 | 972 | $1,347 | $1.39 | 43d | 1 | 1.37mi |
| 21817 Wildwood Park Rd Richmond, TX | 2.0 | 2.0 | 1210 | $1,660 | $1.37 | 43d | 1 | 1.45mi |
| 1601 Crabb River Rd Richmond, TX | 2.0 | 2.0 | 1149 | $1,939 | $1.69 | 18d | 1 | 1.47mi |
HOA detail
- Monthly dues
- $31 · $372/yr
Listing history 4 events
-
2026-05-16status Pending 375-char remark
-
2026-05-14status Pending 375-char remark
-
2026-05-02$220,000 Active 375-char remark
-
2006-04-13soldstatus
ⓘ Source: listings_history table (triggers on properties + properties_extension) + one-shot
backfill from property_details.listing_events for pre-trigger history.
Tax reassessment forecast TX · Resets to sale price
- Current annual tax
- $5,397 · $450/mo
- Projected year-2 tax
- $5,397 · $450/mo
- Expected delta
- $0/yr ($0/mo · 0.0%)
ⓘ Screening estimate from a state-policy table — verify with the county assessor before closing.
Climate risk First Street
- Flood 1/10 Low FEMA zone X (unshaded) · 0% chance over 30 yrs
- Wildfire 3/10 Moderate
- Heat 9/10 Extreme 7 d/yr ≥110°F today · 23 d/yr by 30 yrs out
- Wind 9/10 Extreme 99% chance of damaging wind over 30 yrs
- Air quality 2/10 Low 1 unhealthy d/yr today · 1 by 30 yrs out
Nearby sold comps map
Loading sold comps map…
Walkable amenities ~0.75 mi
Loading nearby amenities…
Taxation est. · year 1
- Rental income
- $22,530
- − Mortgage interest
- −$12,323
- − Property taxes
- −$5,397
- − Insurance
- −$1,100
- − Repairs & maintenance
- −$1,802
- − Management
- −$1,802
- − HOA
- −$372
- − Depreciation
- −$6,400
- Taxable loss
- −$6,668
- Est. tax savings @ 24.0%
- +$1,600
- After-tax cash flow
- $-1,315/yr
For passive investors: Depreciation is non-cash, so a rental often shows a tax loss while cash-flowing — sheltering income. Rental losses are passive: they offset passive income freely, and up to $25,000/yr can offset ordinary (W-2) income if you actively participate and your MAGI is under $100k (phasing out to $0 by $150k); unused losses carry forward. On sale, claimed depreciation is recaptured at up to 25%, and gains may owe capital-gains tax (a 1031 exchange can defer both). Figures are a year-1 estimate at your 24.0% rate — not tax advice; consult a CPA.
Schools (NCES district)
- District
- Lamar CISD
- NCES district ID
- 4826580
- Math proficiency
- 50% ▼ -12.00%
- Reading proficiency
- 53% ▼ -4.00%
- Median HH income
- $75,213
- Composite
- 46.43/100
- National rank
- #2452
- State rank
- #116 of 826 in TX
Livability — Rosenberg
- Score
- 62/100
- State rank
- #922
- US rank
- #16414
Category grades
Schools grade is shown separately in the Schools card above.
Census & demographics
- County
- Fort Bend County · 836,777 people
- City population
- 115,151
- Metro
- Houston-The Woodlands-Sugar Land, TX
- Population (ZIP)
- 69,826
- Household income
- $102,125
- Rent vs Own
- Severe rent burden
- 1292.0
Population outlook (Fort Bend County) Hauer SSP2
- Today (2025)
- 1,004,526 people
- By 2030
- 1,153,104 · +14.8%
- By 2040
- 1,453,718 · +44.7%
- By 2050
- 1,753,781 · +74.6%
- By 2075
- 2,455,772 · +144.5%
- By 2100
- 2,930,528 · +191.7%
Race, ethnicity, and origin ACS 2023
- Neighborhood character
- Highly diverse neighborhood (Simpson 0.76)
- Race & ethnicity
- Hispanic / Latino 29% White 27% Black 25% Two or more races 15% Asian 15%
- Hispanic origin (detail)
- Mexican 21%
- Common ancestry
- Romanian 1% Lithuanian 1%
- Foreign-born
- 24% · Canada, Vietnam, China
- Languages at home
- 65% English-only · Spanish 17% Other Indo-European 7% Other Asian/Pacific 2%
Political lean MEDSL · Fort Bend
- 2024 margin
- Toss-up / Even · D 49.5% · R 47.9% · Other 2.6%
- 2008→2024 swing
- +4.0pp toward D · 2008: -2.4pp · 2024: 1.6pp
- All cycles
- 2024: D+1.6 2020: D+10.6 2016: D+6.6 2012: R+6.8 2008: R+2.4
Not yet ingested
- Civics
- —
Market trends
- HPI YoY
- ▼ -78.66%
- Current HPI
- 234.9892
- Rent YoY
- ▼ -1.81%
- Metro
- Houston-The Woodlands-Sugar Land, TX
- State GDP YoY
- ▲ 3.95%
- F500 in state
- 110
Industry mix (Fortune 500 HQ in TX)
| Industry | F500 HQs | Revenue |
|---|---|---|
| Energy | 16 | $1,198B |
|
||
| Technology | 5 | $198B |
|
||
| Engineering / Construction | 4 | $72B |
|
||
| Energy Services | 3 | $60B |
|
||
| Utilities | 3 | $41B |
|
||
| Healthcare | 2 | $330B |
|
||
Price history
4 events — show timeline
- 2026-05-16 Pending — HARMLS
- 2026-05-14 Pending — HARMLS
- 2026-05-02 Listed $220,000 HARMLS
- 2006-04-13 Sold (Public Records) — Public Records
Property tax history
+2.4%/yrLatest (2025): $5,397 · +9.2% YoY. Source: county tax records.
Cash-flow waterfall
monthlySold comps — $/sqft
last 12 mo · ≤1 miLoading sold comps…