1411 Olivewood Ct · Virginia Beach, VA
Flood risk 1/10 · Minimal
- FEMA flood zone
- X (unshaded)
- Chance of flooding over 30 yrs
- 0.0%
- Est. flood insurance / yr
- $507 – $1,088
Fire risk 4/10 · Minor
- Est. fire insurance / yr
- $666 – $1,236
Heat risk 9/10 · Severe
- Hot days now (above 105°F)
- 7 days/yr
- Hot days in 30 yrs
- 16 days/yr
Wind risk 8/10 · Major
- Chance of severe wind over 30 yrs
- 80.0%
Air-quality risk 5/10 · Moderate
- Unhealthy air days now
- 7 days/yr
- Unhealthy air days in 30 yrs
- 7 days/yr
Risk factors via First Street. Map © Google.
Why this score? — see what drove the D grade
The composite is a weighted blend of 9 inputs, each scored 0–100. Each bar is that input's sub-score; the figure is the points it added to the 100-point composite (weight × sub-score).
- Cash flow +11.2/30.0
- ARV discount +7.5/15.0
- Schools +6.4/10.0
- Livability +4.2/5.0
- Rent growth +4.1/5.0
- 1% rule +3.8/10.0
- DSCR +3.3/10.0
- Condition / age +2.5/5.0
- Appreciation +0.0/10.0
$205,900
🖨 Deal sheet (PDF) 📄 Offer letter ✓ Due diligence
Listing remarks
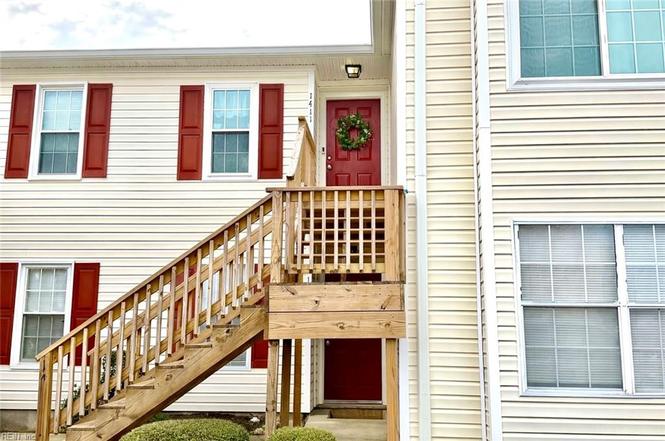
Welcome home to this beautifully updated 2-bedroom, 1-bath second floor condo in Virginia Beach. It features a high ceiling with skylight, filling the space with natural light. The open living area has an inviting feel with a refreshed fireplace as a cozy focal point. The primary bedroom offers a separate vanity area for added convenience. Step outside to the private balcony - great for relaxing or enjoying morning coffee. Recent updates include new flooring throughout, new exterior door to balcony, new ceiling fans, new vanities and toilet, new outlet covers & switches, and newer Samsung appliances. HVAC was replaced in 2021. Exterior steps were recently replaced by the owner, provid
Key facts
- High ceiling
- Private balcony
- New flooring
Tags
Neighborhood map
What this means for you Summary
Snapshot
- This is a 2-bed/1.0-bath condo listed at $206k.
Deal economics
- At list price, monthly cash flow is $-81 ($-967/yr) — negative.
- To cash-flow at today's rent, offer at most $192k (6.9% below list).
- To meet the 1% rule (rent ≥ 1% of price), the offer needs to be $182k (11.7% below list).
- Recommended offer: $182k (11.7% below list) — sets the bar for 1% rule.
- Cap rate 5.8% vs local median 3.5% in Virginia Beach — top-decile yield for the area; either an underpriced asset or a hidden risk that comps aren't pricing in. Stress-test before assuming the spread holds.
Location & tenants
- Location reads 83/100 on livability (#38 in VA, #880 nationally) — a professional / high-income tenant draw. Strengths: amenities A+, employment A+, housing A+; Watch: cost of living C-, commute F.
- Va Beach City Public School District (urban): math 69% / reading 78% proficiency, ranked #10 of 131 in VA (top 8%) — strong family-tenant draw, lease renewals of 3-5y typical.
- Zoned schools: Princess Anne Elementary (math 85% / reading 86%, grade A+, #61 of 1,108 statewide, top 6%, 682 students, 13% FRL); Salem Middle (math 70% / reading 82%, grade A, #42 of 342 statewide, top 13%, 1,073 students, 39% FRL); Salem High (math 79% / reading 90%, grade A, #23 of 319 statewide, top 8%, 1,650 students, 36% FRL) — zoned schools at 29% FRL track the district average.
- Market conditions: Rents rising fast (+6.4%/yr); 234 active listings in the ZIP; 4 comparable units currently listed for rent nearby; rentals at typical pace (median 26d on market — plan ~3-4 weeks tenant-placement turnaround); solid renter incomes; 666 units permitted in Virginia Beach city in 2024 (347 in 5+ unit buildings).
Forward outlook
- Local home prices are declining (-3.0%/yr); year-one equity from $1k of loan paydown is wiped out by about $6k of value loss. Plan a longer hold.
- Virginia Beach County population projected at +6% by 2050 — modest demand growth; plan on rents tracking national, not racing it.
Negotiation context
- It's been on market 27 days — a 2% lower offer ($203k) is reasonable based on typical stale-listing flexibility.
- 4 sale attempts since 5y ago with the ask held roughly flat each time — persistent listings suggest the price (not the market) is what's stuck; bring a comps-based counter.
- Current owner paid $132k; list at $206k implies a 56% gain — meaningful room to come down on a strong offer.
Risks & watch-outs
- Climate carrying-cost: severe wind risk, 80% chance of damaging wind over 30y; extreme-heat days projected 7→16/yr by 2055 (HVAC capex compounding) — expect insurance premiums to compound above CPI over the hold.
Questions for the listing agent
- What do current leases actually rent for vs. the listed asking? Can we see a recent rent roll and the last 12 months of T-12 income?
- What does the HOA fee cover, when was the last increase, and are there any pending special assessments or reserve-fund shortfalls?
- Any open or pending special assessments — roof, HVAC, plumbing, elevator, façade? What's the per-unit balance and payoff schedule, and is the seller paying it off at close or rolling it to the buyer?
- Is there a deadline driving the sale (1031 exchange, divorce, estate, relocation)? That informs how much negotiation room exists.
- Schools are A-rated — typically a magnet for longer-tenancy family renters. What's the average tenant stay here, and is there a school-zone premium baked into asking?
- The area grade is low — what's the realistic commute time and amenity access for the typical tenant pool here? Any planned neighborhood developments (good or bad) we should know about?
- What's the average days-on-market for RENTAL listings here right now (not sales)? A rising rental-DOM trend means longer vacancies and softer asking-rent achievability than the comps imply.
- What's the recent tenant-quality profile in this submarket — average credit score on applications, eviction rate, late-payment / NSF rate, and stable-employment percentage? A property-management company in the area should have these aggregated.
- How much new apartment / multifamily construction is in the pipeline within 1–3 miles? Heavy new supply (>2% of stock underway) typically softens rents 12–24 months out; light construction supports rent growth.
Investment metrics
- 1% rule
- 0.88% ✗
- Cap rate
- 5.82%
- Cash-on-cash
- -1.68%
- DSCR
- 0.93
- GRM
- 9.4
CMA / ARV
No comps found within radius.
Projected returns pro-forma
-3.0% appreciation · 6.36% rent growth · sell at horizon
- IRR
- -15.1%
- Equity multiple
- 0.44×
- Total profit
- $-32,061
- Equity at exit
- $30,700
- IRR
- -1.4%
- Equity multiple
- 0.89×
- Total profit
- $-6,257
- Equity at exit
- $17,802
Cash invested: $57,652 (down + closing). Projections, not guarantees.
Landlord ↔ Tenant lean methodology
- Overall (STATE)
- 55 Moderately Landlord-Leaning
- State Virginia
- 55 Moderately Landlord-Leaning · D+2
- County
- — inherits STATE
- City
- — inherits STATE
ZIP-level market 23464
- Rents YoY
- 6.4%
- Active inventory
- 234
- Price-to-rent
- 9.4×
Monthly cashflow live
- Estimated rent
- $1,817 medium interval (Pro) →
- Mortgage (P&I)
- −$1,080
- Tax from tax record
- −$151 /mo · $1,807/yr
- Insurance
- −$86
- HOA
- −$200
- Vacancy / Maint / Mgmt
- −$382
- Net cashflow
- $-81
Break-even live
Sensitivity live
| Price | -10% $36 | -5% $-22 | +0% $-81 | +5% $-139 | +10% $-197 |
|---|---|---|---|---|---|
| Rent | -10% $-224 | -5% $-152 | +0% $-81 | +5% $-9 | +10% $63 |
| Rate | -1.0pp $23 | -0.5pp $-28 | base $-81 | +0.5pp $-134 | +1.0pp $-188 |
UW: 25.0% down · 7.5% · 30yr · 1.5% tax · 5.0% vac · 8.0% maint · 8.0% mgmt
Financing live
Cash to close
- Down payment
- $51,475
- Closing costs
- $6,177
- Reserves months
- —
- Total cash needed
- —
Loan-product check · same deal, 3 products live
Conventional
25% down · 7.5% · 30yr
- Down + closing
- —
- Monthly P&I
- —
- Monthly cashflow
- —
- DSCR
- —
- Eligible?
- —
Personal DTI + credit; lowest rate.
DSCR
20% down · 8.5% · 30yr
- Down + closing
- —
- Monthly P&I
- —
- Monthly cashflow
- —
- DSCR
- —
- Eligible?
- —
No personal income docs; deal must DSCR.
Hard money
10% down · 12.0% · 12mo
- Down + closing
- —
- Monthly P&I
- —
- Monthly cashflow
- —
- DSCR
- —
- Eligible?
- —
Short-term bridge; refi at stabilization.
Rent comps 4 comps
| Address | Beds | Baths | Sqft | Rent | $/sqft | DOM | Units | Dist |
|---|---|---|---|---|---|---|---|---|
| 1422 Deerpond Ln Virginia Beach, VA | 2.0 | 2.0 | 1015 | $1,695 | $1.67 | 23d | 1 | 0.01mi |
| 1420 Deerpond Ln Virginia Beach, VA | 2.0 | 2.0 | 1014 | $1,695 | $1.67 | 25d | 1 | 0.02mi |
| 1407 Rand Ct Virginia Beach, VA | 2.0 | 2.0 | 1014 | $1,695 | $1.67 | 25d | 1 | 0.08mi |
| 1749 Lacrosse Dr Virginia Beach, VA | 1.0–2.0 | 1.0–2.0 | 905 | $2,189 | $2.42 | 3d | 7 | 0.23mi |
HOA detail condo
- Monthly dues
- $200 · $2,400/yr
- Assessments
- None detected in remarks — confirm with the listing agent.
Listing history 15 events
-
2026-04-06status Under Contract
-
2026-03-16historical Active Under Contract
-
2026-03-10$205,900 Active
-
2024-05-20status Under Contract
-
2024-04-30historical Active Under Contract
-
2024-04-23$185,000 Active
-
2021-08-10soldstatus $132,000
-
2021-07-10status Under Contract
-
2021-07-06historical Active Under Contract
-
2021-06-18status Active
-
2021-06-15historical Active Under Contract
-
2021-06-10$129,900 Active
-
2005-12-02soldstatus $120,000
-
2005-06-21soldstatus $99,000
-
2003-06-30soldstatus $66,000
ⓘ Source: listings_history table (triggers on properties + properties_extension) + one-shot
backfill from property_details.listing_events for pre-trigger history.
Tax reassessment forecast VA · Resets to sale price
- Current annual tax
- $1,807 · $151/mo
- Projected year-2 tax
- $1,807 · $151/mo
- Expected delta
- $0/yr ($0/mo · 0.0%)
ⓘ Screening estimate from a state-policy table — verify with the county assessor before closing.
Climate risk First Street
- Flood 1/10 Low FEMA zone X (unshaded) · 0% chance over 30 yrs
- Wildfire 4/10 Moderate
- Heat 9/10 Extreme 7 d/yr ≥105°F today · 16 d/yr by 30 yrs out
- Wind 8/10 Severe 80% chance of damaging wind over 30 yrs
- Air quality 5/10 Major 7 unhealthy d/yr today · 7 by 30 yrs out
Nearby sold comps map
Loading sold comps map…
Walkable amenities ~0.75 mi
Loading nearby amenities…
Taxation est. · year 1
- Rental income
- $21,806
- − Mortgage interest
- −$11,534
- − Property taxes
- −$1,807
- − Insurance
- −$1,030
- − Repairs & maintenance
- −$1,745
- − Management
- −$1,745
- − HOA
- −$2,400
- − Depreciation
- −$5,990
- Taxable loss
- −$4,443
- Est. tax savings @ 24.0%
- +$1,066
- After-tax cash flow
- $100/yr
For passive investors: Depreciation is non-cash, so a rental often shows a tax loss while cash-flowing — sheltering income. Rental losses are passive: they offset passive income freely, and up to $25,000/yr can offset ordinary (W-2) income if you actively participate and your MAGI is under $100k (phasing out to $0 by $150k); unused losses carry forward. On sale, claimed depreciation is recaptured at up to 25%, and gains may owe capital-gains tax (a 1031 exchange can defer both). Figures are a year-1 estimate at your 24.0% rate — not tax advice; consult a CPA.
Schools (NCES district)
- District
- Va Beach City Public School District
- NCES district ID
- 5103840
- Math proficiency
- 69% ▼ -19.00%
- Reading proficiency
- 78% ▼ -7.00%
- Median HH income
- $66,452
- Composite
- 63.81/100
- National rank
- #594
- State rank
- #10 of 131 in VA
Livability — Virginia Beach
- Score
- 83/100
- State rank
- #38
- US rank
- #880
Category grades
Schools grade is shown separately in the Schools card above.
Census & demographics
- Census place
- Virginia Beach, VA
- County
- Virginia Beach City · 448,227 people
- City population
- 448,227
- Metro
- Virginia Beach-Norfolk-Newport News, VA-NC
- Population (ZIP)
- 75,061
- Household income
- $92,468
- Rent vs Own
- Severe rent burden
- 1929.0
Population outlook (Virginia Beach County) Hauer SSP2
- Today (2025)
- 480,401 people
- By 2030
- 491,221 · +2.3%
- By 2040
- 504,882 · +5.1%
- By 2050
- 508,847 · +5.9%
- By 2075
- 504,831 · +5.1%
- By 2100
- 465,867 · -3.0%
Race, ethnicity, and origin ACS 2023
- Neighborhood character
- Diverse neighborhood (Simpson 0.68)
- Race & ethnicity
- White 50% Black 23% Asian 10% Two or more races 9% Hispanic / Latino 9%
- Hispanic origin (detail)
- Mexican 2% Puerto Rican 3%
- Common ancestry
- Slovak 2% Lithuanian 2% Italian 2%
- Foreign-born
- 11% · Canada, Vietnam, China
- Languages at home
- 85% English-only · Tagalog/Filipino 5% Spanish 5% Other Asian/Pacific 1%
Political lean MEDSL · Virginia Beach
- 2024 margin
- Toss-up / Even · D 50.7% · R 48.0% · Other 1.3%
- 2008→2024 swing
- +3.4pp toward D · 2008: -0.7pp · 2024: 2.6pp
- All cycles
- 2024: D+2.6 2020: D+5.4 2016: R+4.5 2012: R+2.5 2008: R+0.7
Not yet ingested
- Civics
- —
Market trends
- HPI YoY
- ▼ -271.27%
- Current HPI
- 324.1854
- Rent YoY
- ▲ 6.36%
- Metro
- Virginia Beach-Norfolk-Newport News, VA-NC
- State GDP YoY
- ▲ 2.40%
- F500 in state
- 50
Industry mix (Fortune 500 HQ in VA)
| Industry | F500 HQs | Revenue |
|---|---|---|
| Aerospace / Defense | 4 | $236B |
|
||
| Technology / Defense | 3 | $32B |
|
||
| Financial Services | 2 | $176B |
|
||
| Utilities | 2 | $27B |
|
||
| Insurance | 2 | $25B |
|
||
| Technology | 2 | $15B |
|
||
Price history
+212.0% since first listed15 events — show timeline
- 2026-04-06 Pending — REINMLS
- 2026-03-16 Contingent — REINMLS
- 2026-03-10 Listed $205,900 REINMLS
- 2024-05-20 Pending — REINMLS
- 2024-04-30 Contingent — REINMLS
- 2024-04-23 Listed $185,000 REINMLS
- 2021-08-10 Sold (Public Records) $132,000 Public Records
- 2021-07-10 Pending — REINMLS
- 2021-07-06 Contingent — REINMLS
- 2021-06-18 Relisted — REINMLS
- 2021-06-15 Contingent — REINMLS
- 2021-06-10 Listed $129,900 REINMLS
- 2005-12-02 Sold (Public Records) $120,000 Public Records
- 2005-06-21 Sold (Public Records) $99,000 Public Records
- 2003-06-30 Sold (Public Records) $66,000 Public Records
Property tax history
+5.6%/yrLatest (2025): $1,807 · +12.9% YoY. Source: county tax records.
Cash-flow waterfall
monthlySold comps — $/sqft
last 12 mo · ≤1 miLoading sold comps…