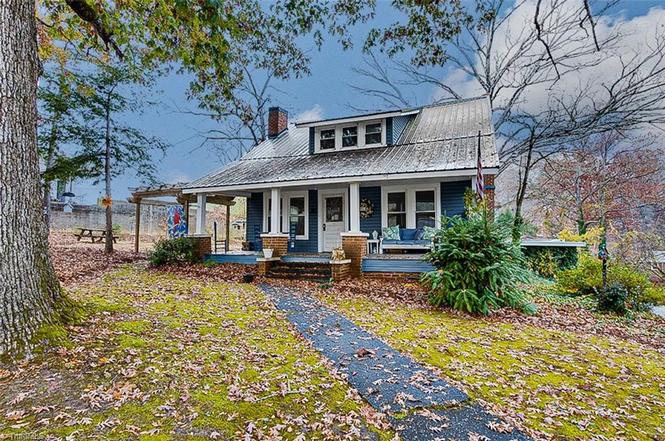
131 N Middleton St · Robbins, NC
Flood risk 1/10 · Minimal
- FEMA flood zone
- X
- Chance of flooding over 30 yrs
- 0.0%
- Est. flood insurance / yr
- $435 – $905
Fire risk 2/10 · Minimal
- Est. fire insurance / yr
- $906 – $1,684
Heat risk 7/10 · Major
- Hot days now (above threshold)
- 7 days/yr
- Hot days in 30 yrs
- 17 days/yr
Wind risk No data
- Chance of severe wind over 30 yrs
- —
Air-quality risk 2/10 · Minimal
- Unhealthy air days now
- 0 days/yr
- Unhealthy air days in 30 yrs
- 1 days/yr
Risk factors via First Street. Map © Google.
Why this score? — see what drove the D- grade
The composite is a weighted blend of 9 inputs, each scored 0–100. Each bar is that input's sub-score; the figure is the points it added to the 100-point composite (weight × sub-score).
- ARV discount +7.5/15.0
- Appreciation +7.5/10.0
- Cash flow +7.1/30.0
- Schools +4.4/10.0
- Livability +3.3/5.0
- Rent growth +2.5/5.0
- Condition / age +2.5/5.0
- DSCR +1.3/10.0
- 1% rule +0.9/10.0
$209,900
🖨 Deal sheet 📄 Offer letter ✓ Due diligence
Listing remarks MLS
Back on the market at no fault of the seller!! Enjoy the small town atmosphere in Robbins NC near Seagrove Pottery Country with this 1910 cottage charmer with lots of character. Large living room, dining room, family room, 3 BR, 1 BA with a 1/2 bath upstairs and 1/2 bath in the partial basement that once was used a Barber Shop. Needs TLC and being sold AS IS. Shared Driveway.
Key facts
- New metal roof
- Sun porch
- Craftsman home
Tags
Property features AI
Finance
- HOA & community: No homeowners association
Exterior
- Parking: Detached garage (1 car); Carport; Driveway; Gravel and paved surfaces; Additional parking — see remarks
- Utilities: Public water; Public sewer; Electric water heater; Publicly maintained road
- Home design: Residential stick/site-built house; One and one half stories; Built in 1910; Living room fireplace
- Construction: Vinyl siding; Unfinished basement; Basement present
- Exterior features: Garden; Gazebo; Storage building; Fenced yard; Cable available; Natural/undeveloped land areas
Interior
- Kitchen: Microwave; Dishwasher; Range
- Bedrooms: Bedrooms located on main and second levels
- Flooring: Carpet; Tile; Vinyl; Wood
- Bathrooms: 1 full bathroom; 1 half bathroom
- Heating & cooling: Electric heating; Wood-burning heat source
- Interior features: Ceiling fans; Eave storage/attic storage; Primary bedroom on main level
- Laundry & utility: Washer hookup; Dryer connection on main level; Electric water heater
Neighborhood map
What this means for you Summary
Snapshot
- This is a ?-bed/1.5-bath other listed at $210k.
Deal economics
- At list price, monthly cash flow is $-301 ($-4k/yr) — negative.
- To cash-flow at today's rent, offer at most $157k (25.3% below list).
- To meet the 1% rule (rent ≥ 1% of price), the offer needs to be $123k (41.4% below list).
- Recommended offer: $123k (41.4% below list) — sets the bar for 1% rule.
Location & tenants
- Location reads 66/100 on livability (#270 in NC) — a middle-class / working-renter tenant base. Strengths: cost of living A+, housing A+, crime A-; Watch: health & safety C-, schools F, amenities F.
- Moore County Schools (rural): math 48% / reading 54% proficiency, ranked #58 of 178 in NC (top 33%) — acceptable for families but not a draw, mixed tenant base, ~2y average lease.
- Market conditions: 20 active listings in the ZIP; 941 units permitted in Moore County in 2024 (0 in 5+ unit buildings).
Forward outlook
- In year one you build about $12k of equity ($1k loan paydown + $11k appreciation (5.0% local appreciation)).
- Moore County population projected at +29% by 2050 — long-run rental-demand tailwind backs the buy-and-hold thesis.
- By year 4, paydown + projected appreciation supports a ~$41k cash-out refi (75% LTV) — recoverable capital for the next deal without selling this one.
Negotiation context
- It's been on market 212 days — a 12% lower offer ($185k) is reasonable based on typical stale-listing flexibility.
- 2 sale attempts since 7y ago; this cycle's ask has dropped $40k (16%) from the opening price — seller is motivated, your offer sets the floor, not the list.
- Current owner paid $37k; list at $210k implies a 467% gain — meaningful room to come down on a strong offer.
Risks & watch-outs
- Watch-outs: built in 1910 — expect roof / HVAC / electrical / plumbing capex.
- Climate carrying-cost: extreme-heat days projected 7→17/yr by 2055 (HVAC capex compounding) — expect insurance premiums to compound above CPI over the hold.
Questions for the listing agent
- What do current leases actually rent for vs. the listed asking? Can we see a recent rent roll and the last 12 months of T-12 income?
- It's been on market 212 days. Have you received any prior offers? Is the seller open to a 41% concession, seller financing, or rate buy-down credit?
- Built in 1910 — when were the roof, HVAC, electrical panel, plumbing, and water heater last replaced?
- Why hasn't it sold? Are there any deal-killer items the seller is aware of (foundation, flood, title, zoning, code violations)?
- Is there a deadline driving the sale (1031 exchange, divorce, estate, relocation)? That informs how much negotiation room exists.
- Schools are F-rated, which usually means shorter tenancies and higher turnover. Who's the typical renter profile here, and what's been the actual vacancy rate?
- The area grade is low — what's the realistic commute time and amenity access for the typical tenant pool here? Any planned neighborhood developments (good or bad) we should know about?
- What's the average days-on-market for RENTAL listings here right now (not sales)? A rising rental-DOM trend means longer vacancies and softer asking-rent achievability than the comps imply.
- What's the recent tenant-quality profile in this submarket — average credit score on applications, eviction rate, late-payment / NSF rate, and stable-employment percentage? A property-management company in the area should have these aggregated.
- How much new for-sale + rental construction is in the pipeline within 1–3 miles? Heavy new supply typically softens prices + rents 12–24 months out; constrained supply supports both.
Investment metrics
- 1% rule
- 0.59% ✗
- Cap rate
- 4.57%
- Cash-on-cash
- -6.15%
- DSCR
- 0.73
- GRM
- 14.2
CMA / ARV
No comps found within radius.
Projected returns pro-forma
5.01% appreciation · 3.0% rent growth · sell at horizon
- IRR
- 7.7%
- Equity multiple
- 1.50×
- Total profit
- $29,275
- Equity at exit
- $119,115
- IRR
- 9.6%
- Equity multiple
- 2.78×
- Total profit
- $104,869
- Equity at exit
- $205,714
Cash invested: $58,772 (down + closing). Projections, not guarantees.
Landlord ↔ Tenant lean methodology
- Overall (STATE)
- 85 Strongly Landlord-Friendly
- State North Carolina
- 85 Strongly Landlord-Friendly · R+3
- County
- — inherits STATE
- City
- — inherits STATE
ZIP-level market 27325
- Home prices YoY
- 3.0%
- Active inventory
- 20
- Price-to-rent
- 14.2×
Monthly cashflow live
- Estimated rent
- $1,231 medium interval (Pro) →
- Mortgage (P&I)
- −$1,101
- Tax from tax record
- −$85 /mo · $1,020/yr
- Insurance
- −$87
- HOA
- −$0
- Vacancy / Maint / Mgmt
- −$258
- Net cashflow
- $-301
Break-even live
UW: 25.0% down · 7.5% · 30yr · 1.5% tax · 5.0% vac · 8.0% maint · 8.0% mgmt
Financing live
Cash to close
- Down payment
- $52,475
- Closing costs
- $6,297
- Reserves months
- —
- Total cash needed
- —
Loan-product check · same deal, 3 products live
Conventional
25% down · 7.5% · 30yr
- Down + closing
- —
- Monthly P&I
- —
- Monthly cashflow
- —
- DSCR
- —
- Eligible?
- —
Personal DTI + credit; lowest rate.
DSCR
20% down · 8.5% · 30yr
- Down + closing
- —
- Monthly P&I
- —
- Monthly cashflow
- —
- DSCR
- —
- Eligible?
- —
No personal income docs; deal must DSCR.
Hard money
10% down · 12.0% · 12mo
- Down + closing
- —
- Monthly P&I
- —
- Monthly cashflow
- —
- DSCR
- —
- Eligible?
- —
Short-term bridge; refi at stabilization.
Listing history 20 events
-
2026-06-19days on market $209,900 Active 212 DOM
-
2026-06-18days on market $209,900 Active 211 DOM
-
2026-06-17days on market $209,900 Active 210 DOM
-
2026-06-16days on market $209,900 Active 209 DOM
-
2026-06-15days on market $209,900 Active 208 DOM
-
2026-06-14days on market $209,900 Active 206 DOM
-
2026-06-13days on market $209,900 Active 205 DOM
-
2026-06-10days on market $209,900 Active 203 DOM
-
2026-06-09days on market $209,900 Active 202 DOM
-
2026-06-08days on market $209,900 Active 201 DOM
-
2026-06-07days on market $209,900 Active 200 DOM
-
2026-06-02days on market $209,900 Active 195 DOM
-
2026-06-01days on market $209,900 Active 194 DOM
-
2026-05-31days on market $209,900 Active 193 DOM
-
2026-05-30days on market $209,900 Active 192 DOM
-
2026-04-14price $209,900
-
2026-02-06price $229,900
-
2025-11-19$250,000 Active
-
2020-01-16soldstatus $37,000 378-char remark
Show marketing remark (378 chars)
Back on the market at no fault of the seller!! Enjoy the small town atmosphere in Robbins NC near Seagrove Pottery Country with this 1910 cottage charmer with lots of character. Large living room, dining room, family room, 3 BR, 1 BA with a 1/2 bath upstairs and 1/2 bath in the partial basement that once was used a Barber Shop. Needs TLC and being sold AS IS. Shared Driveway.
-
2019-04-08$50,000 378-char remark
Show marketing remark (378 chars)
Back on the market at no fault of the seller!! Enjoy the small town atmosphere in Robbins NC near Seagrove Pottery Country with this 1910 cottage charmer with lots of character. Large living room, dining room, family room, 3 BR, 1 BA with a 1/2 bath upstairs and 1/2 bath in the partial basement that once was used a Barber Shop. Needs TLC and being sold AS IS. Shared Driveway.
ⓘ Source: listings_history table (triggers on properties + properties_extension) + one-shot
backfill from property_details.listing_events for pre-trigger history.
Tax reassessment forecast NC · Resets to sale price
- Current annual tax
- $1,020 · $85/mo
- Projected year-2 tax
- $1,721 · $143/mo
- Expected delta
- +$701/yr (+$58/mo · 68.7%)
ⓘ Screening estimate from a state-policy table — verify with the county assessor before closing.
Climate risk First Street
- Flood 1/10 Low FEMA zone X · 0% chance over 30 yrs
- Wildfire 2/10 Low
- Heat 7/10 Severe
- Air quality 2/10 Low 0 unhealthy d/yr today · 1 by 30 yrs out
Nearby sold comps map
Loading sold comps map…
Walkable amenities ~0.75 mi
Loading nearby amenities…
Taxation est. · year 1
- Rental income
- $14,768
- − Mortgage interest
- −$11,758
- − Property taxes
- −$1,020
- − Insurance
- −$1,050
- − Repairs & maintenance
- −$1,181
- − Management
- −$1,181
- − Depreciation
- −$6,106
- Taxable loss
- −$7,529
- Est. tax savings @ 24.0%
- +$1,807
- After-tax cash flow
- $-1,805/yr
For passive investors: Depreciation is non-cash, so a rental often shows a tax loss while cash-flowing — sheltering income. Rental losses are passive: they offset passive income freely, and up to $25,000/yr can offset ordinary (W-2) income if you actively participate and your MAGI is under $100k (phasing out to $0 by $150k); unused losses carry forward. On sale, claimed depreciation is recaptured at up to 25%, and gains may owe capital-gains tax (a 1031 exchange can defer both). Figures are a year-1 estimate at your 24.0% rate — not tax advice; consult a CPA.
Schools (NCES district)
- District
- Moore County Schools
- NCES district ID
- 3703090
- Math proficiency
- 48% ▲ 5.00%
- Reading proficiency
- 54% ▲ 5.00%
- Median HH income
- $50,333
- Composite
- 43.63/100
- National rank
- #2967
- State rank
- #58 of 178 in NC
Livability — Robbins
- Score
- 66/100
- State rank
- #270
- US rank
- #11758
Category grades
Schools grade is shown separately in the Schools card above.
Census & demographics
- Census place
- Robbins, NC
- Population (ZIP)
- 7,261
Population outlook (Moore County) Hauer SSP2
- Today (2025)
- 106,902 people
- By 2030
- 113,134 · +5.8%
- By 2040
- 125,682 · +17.6%
- By 2050
- 137,811 · +28.9%
- By 2075
- 164,387 · +53.8%
- By 2100
- 175,595 · +64.3%
Race, ethnicity, and origin ACS 2023
- Neighborhood character
- Majority White (60%)
- Race & ethnicity
- White 60% Hispanic / Latino 31% Two or more races 13% Black 5%
- Hispanic origin (detail)
- Mexican 25%
- Common ancestry
- Serbian 1% Romanian 1% Slovak 1%
- Foreign-born
- 15% · Canada
- Languages at home
- 72% English-only · Spanish 28%
Political lean MEDSL · Moore
- 2024 margin
- Strong R (+29.5) · D 34.8% · R 64.3%
- 2008→2024 swing
- -8.1pp toward R · 2008: -21.4pp · 2024: -29.5pp
- All cycles
- 2024: R+29.5 2020: R+27.4 2016: R+29.6 2012: R+28.1 2008: R+21.4
Not yet ingested
- Civics
- —
Market trends
- HPI YoY
- ▲ 5.01%
- Current HPI
- 172.9902
- Rent YoY
- —
- Metro
- —
- State GDP YoY
- ▲ 3.28%
- F500 in state
- 26
Industry mix (Fortune 500 HQ in NC)
| Industry | F500 HQs | Revenue |
|---|---|---|
| Financial Services | 2 | $213B |
|
||
| Retail | 2 | $95B |
|
||
| Industrial Conglomerate | 1 | $38B |
|
||
| Metals / Steel | 1 | $35B |
|
||
| Utilities | 1 | $30B |
|
||
| Industrial Machinery | 1 | $19B |
|
||
Price history
+319.8% since first listed5 events — show timeline
- 2026-04-14 Price Changed $209,900 Triad MLS
- 2026-02-06 Price Changed $229,900 Triad MLS
- 2025-11-19 Listed $250,000 Triad MLS
- 2020-01-16 Sold (MLS) $37,000 Triad MLS
- 2019-04-08 Listed $50,000 Triad MLS
Cash-flow waterfall
monthlySold comps — $/sqft
last 12 mo · ≤1 miLoading sold comps…