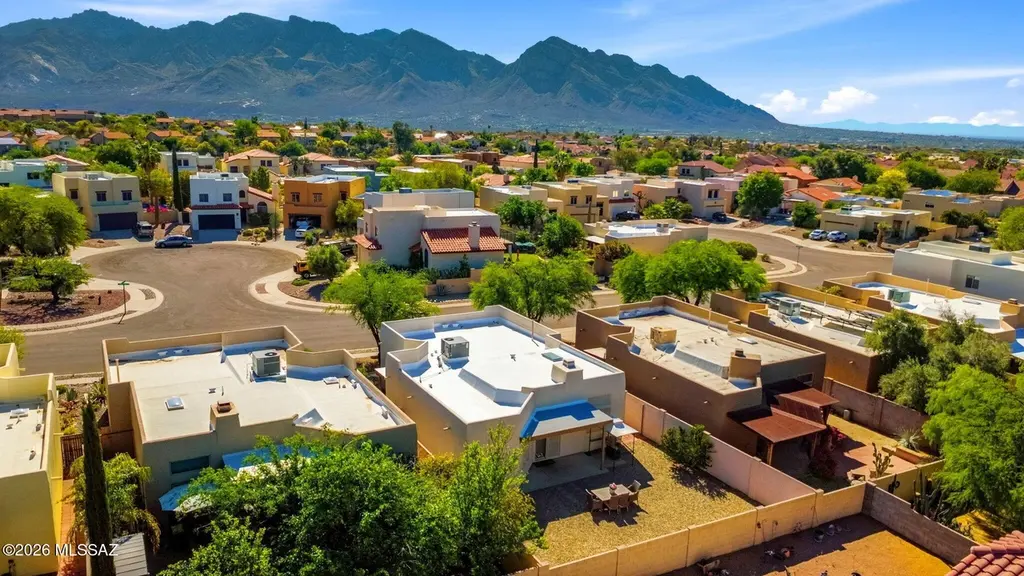
11731 N Copper Creek Dr · Oro Valley, AZ
Flood risk 1/10 · Minimal
- FEMA flood zone
- X (unshaded)
- Chance of flooding over 30 yrs
- 0.0%
- Est. flood insurance / yr
- $507 – $1,088
Fire risk 5/10 · Moderate
- Est. fire insurance / yr
- $610 – $1,132
Heat risk 7/10 · Major
- Hot days now (above 106°F)
- 5 days/yr
- Hot days in 30 yrs
- 14 days/yr
Wind risk 1/10 · Minimal
- Chance of severe wind over 30 yrs
- —
Air-quality risk 1/10 · Minimal
- Unhealthy air days now
- 0 days/yr
- Unhealthy air days in 30 yrs
- 0 days/yr
Risk factors via First Street. Map © Google.
Why this score? — see what drove the D grade
The composite is a weighted blend of 9 inputs, each scored 0–100. Each bar is that input's sub-score; the figure is the points it added to the 100-point composite (weight × sub-score).
- Cash flow +11.2/30.0
- ARV discount +11.0/15.0
- Livability +4.0/5.0
- DSCR +3.3/10.0
- Rent growth +3.2/5.0
- Schools +3.1/10.0
- 1% rule +2.5/10.0
- Condition / age +2.5/5.0
- Appreciation +0.0/10.0
$329,900
🖨 Deal sheet (PDF) 📄 Offer letter ✓ Due diligence
Listing remarks MLS
Lovely 3 Bed, 2 Full Bath (1,340 sq ft) home in quiet neighborhood of Copper Creek! This cozy split bedroom floor plan showcases Great Room featuring gas fireplace, high ceilings, and dining area off the kitchen. The kitchen is open with a skylight and views of the living and dining area. Spacious Master Suite boasts walk in closet, and bathroom with shower and additional bathroom closet. On the opposite side of the house find two spacious guest bedrooms and guest bathroom featuring shower and tub. Relax outside in this huge backyard with side yard and covered patio! Copper Creek is a wonderful community in a great location, close to shopping, dining, hospital, schools, park and community center.
Key facts
- Dining area
- Great room
- Cozy fireplace
Tags
Property features AI
Finance
- Other: Zoning: Oro Valley - R4; Lot dimensions irregular
- HOA & community: Community association (fee includes common area maintenance); Sidewalks in community
Exterior
- Parking: Attached 2-car garage; 2 covered parking spaces
- Utilities: Public water; Sewer connected
- Home design: Single family residence; One story; Level (accessible); Faces southeast
- Construction: Frame with stucco exterior; Built-up roof; Originally built (year not provided)
- Exterior features: Covered patio/porch; Block fencing; Shrubs and decorative gravel landscaping; Paved city-maintained road; Subdivided lot
Interior
- Kitchen: Refrigerator; Electric cooktop; Electric oven; Microwave
- Flooring: Ceramic tile; Laminate
- Bathrooms: 2 full bathrooms
- Heating & cooling: Forced air heating; Central air conditioning; Ceiling fans
- Interior features: High ceilings; Skylights; Has fireplace (gas, in great room)
- Laundry & utility: Laundry closet
Neighborhood map
What this means for you Summary
Snapshot
- This is a 3-bed/2.0-bath single-family listed at $330k.
Deal economics
- At list price, monthly cash flow is $-125 ($-2k/yr) — negative.
- To cash-flow at today's rent, offer at most $308k (6.7% below list).
- To meet the 1% rule (rent ≥ 1% of price), the offer needs to be $249k (24.6% below list).
- Recommended offer: $249k (24.6% below list) — sets the bar for 1% rule.
- Cap rate 5.8% vs local median 3.2% in Oro Valley — top-decile yield for the area; either an underpriced asset or a hidden risk that comps aren't pricing in. Stress-test before assuming the spread holds.
Location & tenants
- Location reads 81/100 on livability (#2 in AZ, #1,339 nationally) — a professional / high-income tenant draw. Strengths: crime A+, employment A+, housing A+; Watch: commute D, amenities F, cost of living D-.
- Amphitheater Unified District (4406) (suburban): math 32% / reading 40% proficiency, ranked #85 of 249 in AZ (top 34%) — families likely to look elsewhere, expect single-tenant / working-renter base with shorter leases.
- Zoned schools: Copper Creek Elementary School (math 32% / reading 47%, grade F, #398 of 1,109 statewide, top 37%, 297 students, 25% FRL); Ironwood Ridge High School (math 37% / reading 39%, grade F, #80 of 381 statewide, top 21%, 1,556 students, 16% FRL) — zoned schools at 20% FRL track the district average.
- Market conditions: Rents rising (+2.7%/yr); 168 active listings in the ZIP; 10 comparable units currently listed for rent nearby; rentals at typical pace (median 26d on market — plan ~3-4 weeks tenant-placement turnaround); solid renter incomes; 5,268 units permitted in Pima County in 2024 (996 in 5+ unit buildings).
Forward outlook
- Local home prices are declining (-3.0%/yr); year-one equity from $2k of loan paydown is wiped out by about $10k of value loss. Plan a longer hold.
- Pima County population projected at +8% by 2050 — modest demand growth; plan on rents tracking national, not racing it.
Negotiation context
- It's been on market 59 days — a 3% lower offer ($320k) is reasonable based on typical stale-listing flexibility.
- 7 sale attempts since 23y ago with the ask held roughly flat each time — persistent listings suggest the price (not the market) is what's stuck; bring a comps-based counter.
Risks & watch-outs
- Climate carrying-cost: moderate wildfire risk; extreme-heat days projected 5→14/yr by 2055 (HVAC capex compounding) — expect insurance premiums to compound above CPI over the hold.
Questions for the listing agent
- What do current leases actually rent for vs. the listed asking? Can we see a recent rent roll and the last 12 months of T-12 income?
- It's been on market 59 days. Have you received any prior offers? Is the seller open to a 25% concession, seller financing, or rate buy-down credit?
- Is there a deadline driving the sale (1031 exchange, divorce, estate, relocation)? That informs how much negotiation room exists.
- Schools are A-rated — typically a magnet for longer-tenancy family renters. What's the average tenant stay here, and is there a school-zone premium baked into asking?
- The area grade is low — what's the realistic commute time and amenity access for the typical tenant pool here? Any planned neighborhood developments (good or bad) we should know about?
- What's the average days-on-market for RENTAL listings here right now (not sales)? A rising rental-DOM trend means longer vacancies and softer asking-rent achievability than the comps imply.
- What's the recent tenant-quality profile in this submarket — average credit score on applications, eviction rate, late-payment / NSF rate, and stable-employment percentage? A property-management company in the area should have these aggregated.
- How much new for-sale + rental construction is in the pipeline within 1–3 miles? Heavy new supply typically softens prices + rents 12–24 months out; constrained supply supports both.
Investment metrics
- 1% rule
- 0.75% ✗
- Cap rate
- 5.84%
- Cash-on-cash
- -1.63%
- DSCR
- 0.93
- GRM
- 11.0
CMA / ARV
- ARV (median comp)
- $357,587
- List price
- $329,900
- Delta
- -6.34%
- Verdict
- FAIR
- Comps
- 20 within 1.0 mi
Show comp detail 11 sales within ~0.75 mi
| Address | Dist | Beds/Ba | Sqft | Sold | Price | $/sf | Match |
|---|---|---|---|---|---|---|---|
| 1314 W Desert Cloud Pl | 0.20mi | 3/2.0 | 1,345 (+0%) | 19mo | $350,000 | $260 | 74 |
| 1248 W Crystal Palace Pl | 0.28mi | 3/2.0 | 1,250 (-7%) | 2mo | $317,000 | $254 | 74 |
| 1373 W Desert Cloud Pl | 0.18mi | 3/2.0 | 1,304 (-3%) | 17mo | $292,000 | $224 | 73 |
| 1299 W Seep Willow Pl | 0.07mi | 3/2.0 | 1,465 (+9%) | 10mo | $337,000 | $230 | 73 |
| 1311 W Desert Dew Pl | 0.12mi | 3/2.0 | 1,304 (-3%) | 20mo | $360,000 | $276 | 73 |
| 11561 N Eagle Peak Dr | 0.28mi | 2/2.0 (-1) | 1,260 (-6%) | 0mo | $305,000 | $242 | 72 |
| 11629 N Copper Creek Dr | 0.12mi | 3/2.0 | 1,477 (+10%) | 12mo | $333,000 | $225 | 67 |
| 11785 N Copper Creek Dr | 0.08mi | 3/2.0 | 1,465 (+9%) | 17mo | $332,000 | $227 | 67 |
| 1091 W Bullion Pl | 0.51mi | 3/2.0 | 1,471 (+10%) | 11mo | $399,500 | $272 | 51 |
| 11474 N Eagle Peak Dr | 0.38mi | 2/2.0 (-1) | 1,202 (-10%) | 19mo | $349,900 | $291 | 44 |
| 11430 N Palmetto Dunes Ave | 0.39mi | 2/2.0 (-1) | 1,529 (+14%) | 15mo | $481,500 | $315 | 41 |
Match score weights: distance 35% · size 25% · config 20% · recency 20%. Top-matched comps best support the ARV.
Projected returns pro-forma
-3.0% appreciation · 2.7% rent growth · sell at horizon
- IRR
- -19.3%
- Equity multiple
- 0.33×
- Total profit
- $-62,277
- Equity at exit
- $49,189
- IRR
- -12.7%
- Equity multiple
- 0.27×
- Total profit
- $-67,893
- Equity at exit
- $28,524
Cash invested: $92,372 (down + closing). Projections, not guarantees.
Landlord ↔ Tenant lean methodology
- Overall (STATE)
- 87 Strongly Landlord-Friendly
- State Arizona
- 87 Strongly Landlord-Friendly · R+3
- County
- — inherits STATE
- City
- — inherits STATE
ZIP-level market 85737
- Home prices YoY
- -19.6%
- Rents YoY
- 2.7%
- Active inventory
- 168
- Price-to-rent
- 11.0×
Monthly cashflow live
- Estimated rent
- $2,488 high interval (Pro) →
- Mortgage (P&I)
- −$1,730
- Tax from tax record
- −$224 /mo · $2,682/yr
- Insurance
- −$137
- HOA
- −$0
- Vacancy / Maint / Mgmt
- −$522
- Net cashflow
- $-125
Break-even live
Sensitivity live
| Price | -10% $61 | -5% $-32 | +0% $-125 | +5% $-219 | +10% $-312 |
|---|---|---|---|---|---|
| Rent | -10% $-322 | -5% $-224 | +0% $-125 | +5% $-27 | +10% $71 |
| Rate | -1.0pp $41 | -0.5pp $-42 | base $-125 | +0.5pp $-211 | +1.0pp $-298 |
UW: 25.0% down · 7.5% · 30yr · 1.5% tax · 5.0% vac · 8.0% maint · 8.0% mgmt
Financing live
Cash to close
- Down payment
- $82,475
- Closing costs
- $9,897
- Reserves months
- —
- Total cash needed
- —
Loan-product check · same deal, 3 products live
Conventional
25% down · 7.5% · 30yr
- Down + closing
- —
- Monthly P&I
- —
- Monthly cashflow
- —
- DSCR
- —
- Eligible?
- —
Personal DTI + credit; lowest rate.
DSCR
20% down · 8.5% · 30yr
- Down + closing
- —
- Monthly P&I
- —
- Monthly cashflow
- —
- DSCR
- —
- Eligible?
- —
No personal income docs; deal must DSCR.
Hard money
10% down · 12.0% · 12mo
- Down + closing
- —
- Monthly P&I
- —
- Monthly cashflow
- —
- DSCR
- —
- Eligible?
- —
Short-term bridge; refi at stabilization.
Rent comps 10 comps
| Address | Beds | Baths | Sqft | Rent | $/sqft | DOM | Units | Dist |
|---|---|---|---|---|---|---|---|---|
| 11543 N Eagle Peak Dr Tucson, AZ | 2.0 | 2.0 | 1260 | $2,700 | $2.14 | 16d | 1 | 0.30mi |
| 11360 N Palmetto Dunes Ave Tucson, AZ | 3.0 | 2.0 | 1576 | $3,600 | $2.28 | 45d | 1 | 0.44mi |
| 11146 N Desert Flower Dr Tucson, AZ | 2.0 | 2.0 | 1642 | $2,200 | $1.34 | 45d | 1 | 0.76mi |
| 11921 N Cantata Dr Tucson, AZ | 4.0 | 2.0 | 1862 | $1,995 | $1.07 | 25d | 1 | 0.77mi |
| 1427 W Cathedral Way Tucson, AZ | 2.0 | 2.0 | 1789 | $2,100 | $1.17 | 45d | 1 | 0.92mi |
| 1424 W Bridalveil Pl Tucson, AZ | 2.0 | 2.0 | 1795 | $2,600 | $1.45 | 18d | 1 | 0.95mi |
| 10950 N La Canada Dr Tucson, AZ | 1.0–3.0 | 1.0–2.0 | 1088 | $2,060 | $1.89 | 3d | 14 | 0.95mi |
| 11557 N Flat Iron Dr Tucson, AZ | 4.0 | 2.0 | 1868 | $2,400 | $1.28 | 19d | 1 | 1.00mi |
| 10984 N Double Eagle Ct Tucson, AZ | 3.0 | 2.0 | 1495 | $1,875 | $1.25 | 4d | 1 | 1.36mi |
| 114 W Freddie Canyon Way Oro Valley, AZ | 4.0 | 2.0 | 1812 | $2,200 | $1.21 | 25d | 1 | 1.45mi |
Listing history 35 events
-
2026-06-21pricedays on market $329,900 Active 59 DOM
-
2026-06-18days on market $334,900 Active 56 DOM
-
2026-06-17days on market $334,900 Active 55 DOM
-
2026-06-16days on market $334,900 Active 54 DOM
-
2026-06-15days on market $334,900 Active 53 DOM
-
2026-06-13pricedays on market $334,900 Active 51 DOM
-
2026-06-10days on market $337,500 Active 48 DOM
-
2026-06-09days on market $337,500 Active 47 DOM
-
2026-06-08days on market $337,500 Active 46 DOM
-
2026-06-07days on market $337,500 Active 45 DOM
-
2026-06-05days on market $337,500 Active 42 DOM
-
2026-06-03days on market $337,500 Active 41 DOM
-
2026-06-02days on market $337,500 Active 40 DOM
-
2026-06-01days on market $337,500 Active 39 DOM
-
2026-05-31days on market $337,500 Active 38 DOM
-
2026-04-23$339,900 Active 1443-char remark
-
2026-04-13historical Active Contingent
-
2026-04-12historical
-
2026-04-08$339,900 Active
-
2022-06-17soldstatus $330,000 Closed
Show marketing remark (707 chars)
Lovely 3 Bed, 2 Full Bath (1,340 sq ft) home in quiet neighborhood of Copper Creek! This cozy split bedroom floor plan showcases Great Room featuring gas fireplace, high ceilings, and dining area off the kitchen. The kitchen is open with a skylight and views of the living and dining area. Spacious Master Suite boasts walk in closet, and bathroom with shower and additional bathroom closet. On the opposite side of the house find two spacious guest bedrooms and guest bathroom featuring shower and tub. Relax outside in this huge backyard with side yard and covered patio! Copper Creek is a wonderful community in a great location, close to shopping, dining, hospital, schools, park and community center.
-
2022-06-17soldstatus $330,000
Show marketing remark (707 chars)
Lovely 3 Bed, 2 Full Bath (1,340 sq ft) home in quiet neighborhood of Copper Creek! This cozy split bedroom floor plan showcases Great Room featuring gas fireplace, high ceilings, and dining area off the kitchen. The kitchen is open with a skylight and views of the living and dining area. Spacious Master Suite boasts walk in closet, and bathroom with shower and additional bathroom closet. On the opposite side of the house find two spacious guest bedrooms and guest bathroom featuring shower and tub. Relax outside in this huge backyard with side yard and covered patio! Copper Creek is a wonderful community in a great location, close to shopping, dining, hospital, schools, park and community center.
-
2022-06-16status Pending
Show marketing remark (707 chars)
Lovely 3 Bed, 2 Full Bath (1,340 sq ft) home in quiet neighborhood of Copper Creek! This cozy split bedroom floor plan showcases Great Room featuring gas fireplace, high ceilings, and dining area off the kitchen. The kitchen is open with a skylight and views of the living and dining area. Spacious Master Suite boasts walk in closet, and bathroom with shower and additional bathroom closet. On the opposite side of the house find two spacious guest bedrooms and guest bathroom featuring shower and tub. Relax outside in this huge backyard with side yard and covered patio! Copper Creek is a wonderful community in a great location, close to shopping, dining, hospital, schools, park and community center.
-
2022-05-20historical Active Contingent
Show marketing remark (707 chars)
Lovely 3 Bed, 2 Full Bath (1,340 sq ft) home in quiet neighborhood of Copper Creek! This cozy split bedroom floor plan showcases Great Room featuring gas fireplace, high ceilings, and dining area off the kitchen. The kitchen is open with a skylight and views of the living and dining area. Spacious Master Suite boasts walk in closet, and bathroom with shower and additional bathroom closet. On the opposite side of the house find two spacious guest bedrooms and guest bathroom featuring shower and tub. Relax outside in this huge backyard with side yard and covered patio! Copper Creek is a wonderful community in a great location, close to shopping, dining, hospital, schools, park and community center.
-
2022-05-12$330,000 Active
Show marketing remark (707 chars)
Lovely 3 Bed, 2 Full Bath (1,340 sq ft) home in quiet neighborhood of Copper Creek! This cozy split bedroom floor plan showcases Great Room featuring gas fireplace, high ceilings, and dining area off the kitchen. The kitchen is open with a skylight and views of the living and dining area. Spacious Master Suite boasts walk in closet, and bathroom with shower and additional bathroom closet. On the opposite side of the house find two spacious guest bedrooms and guest bathroom featuring shower and tub. Relax outside in this huge backyard with side yard and covered patio! Copper Creek is a wonderful community in a great location, close to shopping, dining, hospital, schools, park and community center.
-
2007-08-31soldstatus $212,500
-
2007-01-29$214,900
-
2006-10-13historical
-
2006-07-25historical
-
2006-07-24$254,900
-
2006-05-07$264,900
-
2003-06-30soldstatus $135,000
-
2003-06-30soldstatus $135,000
-
2003-03-17$136,900
-
1994-03-31soldstatus $88,232
-
1993-11-08soldstatus $32,443
ⓘ Source: listings_history table (triggers on properties + properties_extension) + one-shot
backfill from property_details.listing_events for pre-trigger history.
Tax reassessment forecast AZ · Resets to sale price
- Current annual tax
- $2,682 · $224/mo
- Projected year-2 tax
- $2,682 · $224/mo
- Expected delta
- $0/yr ($0/mo · 0.0%)
ⓘ Screening estimate from a state-policy table — verify with the county assessor before closing.
Climate risk First Street
- Flood 1/10 Low FEMA zone X (unshaded) · 0% chance over 30 yrs
- Wildfire 5/10 Major
- Heat 7/10 Severe 5 d/yr ≥106°F today · 14 d/yr by 30 yrs out
- Wind 1/10 Low
- Air quality 1/10 Low 0 unhealthy d/yr today · 0 by 30 yrs out
Nearby sold comps map
Loading sold comps map…
Walkable amenities ~0.75 mi
Loading nearby amenities…
Taxation est. · year 1
- Rental income
- $29,856
- − Mortgage interest
- −$18,480
- − Property taxes
- −$2,682
- − Insurance
- −$1,650
- − Repairs & maintenance
- −$2,388
- − Management
- −$2,388
- − Depreciation
- −$9,597
- Taxable loss
- −$7,329
- Est. tax savings @ 24.0%
- +$1,759
- After-tax cash flow
- $253/yr
For passive investors: Depreciation is non-cash, so a rental often shows a tax loss while cash-flowing — sheltering income. Rental losses are passive: they offset passive income freely, and up to $25,000/yr can offset ordinary (W-2) income if you actively participate and your MAGI is under $100k (phasing out to $0 by $150k); unused losses carry forward. On sale, claimed depreciation is recaptured at up to 25%, and gains may owe capital-gains tax (a 1031 exchange can defer both). Figures are a year-1 estimate at your 24.0% rate — not tax advice; consult a CPA.
Schools (NCES district)
- District
- Amphitheater Unified District (4406)
- NCES district ID
- 0400680
- Math proficiency
- 32% ▼ -13.00%
- Reading proficiency
- 40% ▼ -8.00%
- Median HH income
- $46,524
- Composite
- 30.82/100
- National rank
- #6135
- State rank
- #85 of 249 in AZ
Livability — Oro Valley
- Score
- 81/100
- State rank
- #2
- US rank
- #1339
Category grades
Schools grade is shown separately in the Schools card above.
Census & demographics
- Census place
- Oro Valley, AZ
- County
- Pima County · 1,012,107 people
- City population
- 41,345
- Metro
- Tucson, AZ
- Population (ZIP)
- 22,785
- Household income
- $107,348
- Rent vs Own
- Severe rent burden
- 666.0
Population outlook (Pima County) Hauer SSP2
- Today (2025)
- 1,066,056 people
- By 2030
- 1,086,684 · +1.9%
- By 2040
- 1,117,160 · +4.8%
- By 2050
- 1,149,778 · +7.9%
- By 2075
- 1,271,480 · +19.3%
- By 2100
- 1,321,160 · +23.9%
Race, ethnicity, and origin ACS 2023
- Neighborhood character
- Predominantly White (73%)
- Race & ethnicity
- White 73% Hispanic / Latino 19% Two or more races 12% Asian 3% Black 1%
- Hispanic origin (detail)
- Mexican 15%
- Common ancestry
- Romanian 4% Lithuanian 3% Italian 3%
- Foreign-born
- 11% · Canada, China
- Languages at home
- 85% English-only · Spanish 10% Other Indo-European 2% Chinese 1%
Political lean MEDSL · Pima
- 2024 margin
- D (+15.2) · D 57.0% · R 41.8% · Other 1.2%
- 2008→2024 swing
- +9.1pp toward D · 2008: 6.1pp · 2024: 15.2pp
- All cycles
- 2024: D+15.2 2020: D+18.7 2016: D+13.5 2012: D+5.8 2008: D+6.1
Not yet ingested
- Civics
- —
Market trends
- HPI YoY
- ▼ -63.56%
- Current HPI
- 261.4417
- Rent YoY
- ▲ 2.70%
- Metro
- Tucson, AZ
- State GDP YoY
- ▲ 4.54%
- F500 in state
- 20
Industry mix (Fortune 500 HQ in AZ)
| Industry | F500 HQs | Revenue |
|---|---|---|
| Technology | 2 | $13B |
|
||
| Mining / Metals | 1 | $23B |
|
||
| Environmental Services | 1 | $16B |
|
||
| Metals / Steel | 1 | $14B |
|
||
| Technology Distribution | 1 | $9B |
|
||
| Homebuilding | 1 | $8B |
|
||
Price history
+932.3% since first listed22 events — show timeline
- 2026-06-11 Price Changed $334,900 MLSSAZ
- 2026-05-21 Price Changed $337,500 MLSSAZ
- 2026-04-23 Listed $339,900 MLSSAZ
- 2026-04-13 Contingent — MLSSAZ
- 2026-04-12 Listing Removed — MLSSAZ
- 2026-04-08 Listed $339,900 MLSSAZ
- 2022-06-17 Sold (Public Records) $330,000 Public Records
- 2022-06-17 Sold (MLS) $330,000 MLSSAZ
- 2022-06-16 Pending — MLSSAZ
- 2022-05-20 Contingent — MLSSAZ
- 2022-05-12 Listed $330,000 MLSSAZ
- 2007-08-31 Sold (Public Records) $212,500 Public Records
- 2007-01-29 Listed $214,900 MLSSAZ
- 2006-10-13 Listing Removed — MLSSAZ
- 2006-07-25 Listing Removed — MLSSAZ
- 2006-07-24 Listed $254,900 MLSSAZ
- 2006-05-07 Listed $264,900 MLSSAZ
- 2003-06-30 Sold (Public Records) $135,000 Public Records
- 2003-06-30 Sold (MLS) $135,000 MLSSAZ
- 2003-03-17 Listed $136,900 MLSSAZ
- 1994-03-31 Sold (Public Records) $88,232 Public Records
- 1993-11-08 Sold (Public Records) $32,443 Public Records
Property tax history
+3.5%/yrLatest (2025): $2,682 · +4.4% YoY. Source: county tax records.
Cash-flow waterfall
monthlySold comps — $/sqft
last 12 mo · ≤1 miLoading sold comps…