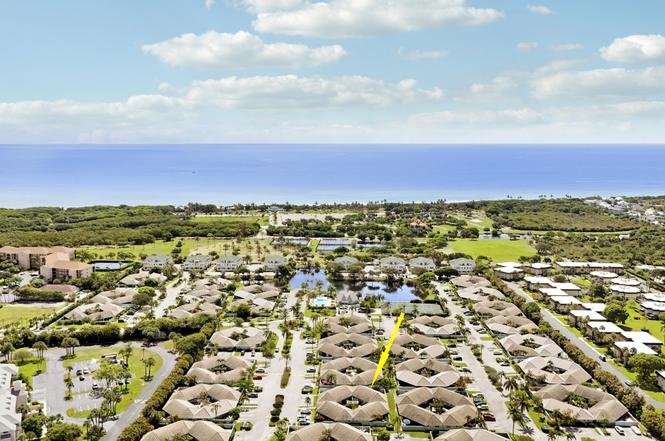
1127 E Seminole Ave Unit 15b · Jupiter, FL
Flood risk 4/10 · Minor
- FEMA flood zone
- X (unshaded)
- Chance of flooding over 30 yrs
- 0.2%
- Est. flood insurance / yr
- $507 – $1,088
Fire risk 1/10 · Minimal
- Est. fire insurance / yr
- $947 – $1,759
Heat risk 10/10 · Severe
- Hot days now (above 106°F)
- 7 days/yr
- Hot days in 30 yrs
- 24 days/yr
Wind risk 10/10 · Severe
- Chance of severe wind over 30 yrs
- 99.0%
Air-quality risk 2/10 · Minimal
- Unhealthy air days now
- 1 days/yr
- Unhealthy air days in 30 yrs
- 2 days/yr
Risk factors via First Street. Map © Google.
Why this score? — see what drove the D- grade
The composite is a weighted blend of 9 inputs, each scored 0–100. Each bar is that input's sub-score; the figure is the points it added to the 100-point composite (weight × sub-score).
- ARV discount +7.5/15.0
- Appreciation +6.5/10.0
- Cash flow +6.3/30.0
- Rent growth +5.0/5.0
- Schools +4.3/10.0
- Livability +3.5/5.0
- 1% rule +2.5/10.0
- Condition / age +2.5/5.0
- DSCR +0.6/10.0
$499,000
🖨 Deal sheet (PDF) 📄 Offer letter ✓ Due diligence
Listing remarks
Come see this 2 bedroom, 2 bathroom villa (not condo) within WALKING distance to beautiful beaches, 6 new pickleball courts, and Jupiter's most popular restaurant, Food Shack. Roof replaced in 2018. Desirable split floorplan and walk-in closets in each bedroom. Enjoy outdoor living in the oversized screened in lanai and the backyard is fully fenced. Bella Vista consists of 136 Villas and is a pet friendly community - allowing 2 pets and maximum weight of 30 lbs per pet. Great investment opportunity - can rent right after purchasing - minimum of 30 days and 2 rentals per year. Best location in Jupiter!
Key facts
- 1,995 sq ft lot
- 2 parking spots
- Community pool
Property features AI
Finance
- Other: Pets allowed (with number and size limits)
- HOA & community: Community of 136 units; Monthly association fee of $794; Community pool; HOA fee covers cable TV, insurance, grounds maintenance, pest control, common areas, and pool service
Exterior
- Parking: Assigned parking (2 spaces total); No carport
- Utilities: Public water; Public sewer; Cable connected; Electricity connected; Water connected; Sewer connected
- Home design: Villa; Single-story; Facing northwest; Resale condition
- Construction: Block / Concrete / CBS construction; Concrete and tile roof; Built as a one-story structure
- Exterior features: Not on waterfront
Interior
- Kitchen: Dishwasher; Disposal; Electric range; Microwave; Refrigerator; Freezer; Electric water heater (owned)
- Bedrooms: 2 bedrooms on main level
- Flooring: Tile
- Bathrooms: 2 full bathrooms (main level)
- Heating & cooling: Central individual heating; Central individual cooling; Ceiling fans
- Interior features: Entrance foyer; Vaulted ceilings; Walk-in closets; Split bedroom layout
- Laundry & utility: In-unit laundry room
Neighborhood map
What this means for you Summary
Snapshot
- This is a 2-bed/2.0-bath single-family listed at $499k.
Deal economics
- At list price, monthly cash flow is $-882 ($-11k/yr) — negative.
- To cash-flow at today's rent, offer at most $343k (31.2% below list).
- To meet the 1% rule (rent ≥ 1% of price), the offer needs to be $374k (25.1% below list).
- Recommended offer: $343k (31.2% below list) — sets the bar for cash-flow.
- Cap rate 4.2% vs local median 2.7% in Jupiter — top-decile yield for the area; either an underpriced asset or a hidden risk that comps aren't pricing in. Stress-test before assuming the spread holds.
Location & tenants
- Location reads 70/100 on livability (#415 in FL) — a middle-class / working-renter tenant base. Strengths: crime A+, employment A+, housing A+; Watch: amenities F, commute F, cost of living F.
- Palm Beach (suburban): math 46% / reading 53% proficiency, ranked #34 of 73 in FL (top 47%) — families likely to look elsewhere, expect single-tenant / working-renter base with shorter leases.
- Zoned schools: Beacon Cove Intermediate School (math 84% / reading 86%, grade A+, #35 of 2,144 statewide, top 2%, 641 students, 19% FRL); Jupiter Middle School (math 62% / reading 63%, grade B+, #116 of 571 statewide, top 21%, 1,384 students, 38% FRL); Jupiter High School (math 56% / reading 64%, grade C+, #106 of 667 statewide, top 16%, 3,087 students, 28% FRL) — zoned schools average 28% FRL vs 52% district-wide (23 pts lower); this property's tenant base skews higher-income than the district average.
- Zoned-school proficiency averages 69% at this address vs 50% district-wide (+20 pts) — the actual schools serving this property are materially stronger than the Palm Beach average implies; a family-tenant draw the district grade alone would hide.
- Market conditions: Rents rising fast (+10.3%/yr); 338 active listings in the ZIP; 40 comparable units currently listed for rent nearby; rentals at typical pace (median 26d on market — plan ~3-4 weeks tenant-placement turnaround); solid renter incomes; 3,974 units permitted in Palm Beach County in 2024 (1,012 in 5+ unit buildings).
Forward outlook
- In year one you build about $18k of equity ($3k loan paydown + $15k appreciation (2.9% local appreciation)).
- Palm Beach County population projected at +30% by 2050 — long-run rental-demand tailwind backs the buy-and-hold thesis.
- By year 3, paydown + projected appreciation supports a ~$45k cash-out refi (75% LTV) — recoverable capital for the next deal without selling this one.
Negotiation context
- Only 5 days on market — expect competitive offers; lowballing is unlikely to land.
- Current owner paid $250k; list at $499k implies a 100% gain — meaningful room to come down on a strong offer.
Risks & watch-outs
- Watch-outs: HOA is 21% of rent.
- Climate carrying-cost: severe wind risk, 99% chance of damaging wind over 30y; extreme-heat days projected 7→24/yr by 2055 (HVAC capex compounding) — expect insurance premiums to compound above CPI over the hold.
Questions for the listing agent
- What do current leases actually rent for vs. the listed asking? Can we see a recent rent roll and the last 12 months of T-12 income?
- What does the HOA fee cover, when was the last increase, and are there any pending special assessments or reserve-fund shortfalls?
- Is there a deadline driving the sale (1031 exchange, divorce, estate, relocation)? That informs how much negotiation room exists.
- Schools are A-rated — typically a magnet for longer-tenancy family renters. What's the average tenant stay here, and is there a school-zone premium baked into asking?
- The area grade is low — what's the realistic commute time and amenity access for the typical tenant pool here? Any planned neighborhood developments (good or bad) we should know about?
- What's the average days-on-market for RENTAL listings here right now (not sales)? A rising rental-DOM trend means longer vacancies and softer asking-rent achievability than the comps imply.
- What's the recent tenant-quality profile in this submarket — average credit score on applications, eviction rate, late-payment / NSF rate, and stable-employment percentage? A property-management company in the area should have these aggregated.
- How much new for-sale + rental construction is in the pipeline within 1–3 miles? Heavy new supply typically softens prices + rents 12–24 months out; constrained supply supports both.
Investment metrics
- 1% rule
- 0.75% ✗
- Cap rate
- 4.17%
- Cash-on-cash
- -7.58%
- DSCR
- 0.66
- GRM
- 11.1
CMA / ARV
No comps found within radius.
Projected returns pro-forma
2.93% appreciation · 8.0% rent growth · sell at horizon
- IRR
- 2.7%
- Equity multiple
- 1.16×
- Total profit
- $22,069
- Equity at exit
- $222,361
- IRR
- 8.6%
- Equity multiple
- 2.41×
- Total profit
- $196,904
- Equity at exit
- $341,130
Cash invested: $139,720 (down + closing). Projections, not guarantees.
Landlord ↔ Tenant lean methodology
- Overall (STATE)
- 87 Strongly Landlord-Friendly
- State Florida
- 87 Strongly Landlord-Friendly · R+3
- County
- — inherits STATE
- City
- — inherits STATE
ZIP-level market 33477
- Home prices YoY
- 0.8%
- Rents YoY
- 10.3%
- Active inventory
- 338
- Price-to-rent
- 11.1×
Monthly cashflow live
- Estimated rent
- $3,735 high interval (Pro) →
- Mortgage (P&I)
- −$2,617
- Tax from tax record
- −$214 /mo · $2,573/yr
- Insurance
- −$208
- HOA
- −$794
- Vacancy / Maint / Mgmt
- −$784
- Net cashflow
- $-882
Break-even live
Sensitivity live
| Price | -10% $-600 | -5% $-741 | +0% $-882 | +5% $-1,023 | +10% $-1,165 |
|---|---|---|---|---|---|
| Rent | -10% $-1,177 | -5% $-1,030 | +0% $-882 | +5% $-735 | +10% $-587 |
| Rate | -1.0pp $-631 | -0.5pp $-755 | base $-882 | +0.5pp $-1,011 | +1.0pp $-1,143 |
UW: 25.0% down · 7.5% · 30yr · 1.5% tax · 5.0% vac · 8.0% maint · 8.0% mgmt
Financing live
Cash to close
- Down payment
- $124,750
- Closing costs
- $14,970
- Reserves months
- —
- Total cash needed
- —
Loan-product check · same deal, 3 products live
Conventional
25% down · 7.5% · 30yr
- Down + closing
- —
- Monthly P&I
- —
- Monthly cashflow
- —
- DSCR
- —
- Eligible?
- —
Personal DTI + credit; lowest rate.
DSCR
20% down · 8.5% · 30yr
- Down + closing
- —
- Monthly P&I
- —
- Monthly cashflow
- —
- DSCR
- —
- Eligible?
- —
No personal income docs; deal must DSCR.
Hard money
10% down · 12.0% · 12mo
- Down + closing
- —
- Monthly P&I
- —
- Monthly cashflow
- —
- DSCR
- —
- Eligible?
- —
Short-term bridge; refi at stabilization.
Rent comps 40 comps
| Address | Beds | Baths | Sqft | Rent | $/sqft | DOM | Units | Dist |
|---|---|---|---|---|---|---|---|---|
| 1127 E Seminole Ave Unit 13D Jupiter, FL | 2.0 | 2.0 | 1540 | $7,500 | $4.87 | 26d | 1 | 0.04mi |
| 1127 E Seminole Ave Unit 8A Jupiter, FL | 2.0 | 2.0 | 1324 | $3,900 | $2.95 | 26d | 1 | 0.04mi |
| 717 S US Highway 1 #408 Jupiter, FL | 3.0 | 2.0 | 1315 | $5,000 | $3.80 | 1d | 1 | 0.09mi |
| 717 S US Highway 1 #211 Jupiter, FL | 2.0 | 2.0 | 1000 | $5,400 | $5.40 | 26d | 1 | 0.09mi |
| 717 S US Highway 1 #712 Jupiter, FL | 2.0 | 2.0 | 1000 | $2,600 | $2.60 | 20d | 1 | 0.09mi |
| 717 S US Highway 1 #505 Jupiter, FL | 2.0 | 2.0 | 1000 | $2,500 | $2.50 | 23d | 1 | 0.09mi |
| 717 S US Highway 1 #118 Jupiter, FL | 2.0 | 2.0 | 1000 | $5,500 | $5.50 | 26d | 1 | 0.09mi |
| 717 S US Highway 1 #1016 Jupiter, FL | 2.0 | 2.0 | 1274 | $2,800 | $2.20 | 26d | 1 | 0.09mi |
| 717 S US Highway 1 #505 Jupiter, FL | 2.0 | 2.0 | 1000 | $2,500 | $2.50 | 17d | 1 | 0.09mi |
| 717 S US Highway 1 #608 Jupiter, FL | 3.0 | 2.0 | 1315 | $5,800 | $4.41 | 26d | 1 | 0.09mi |
| 717 S US Highway 1 #408 Jupiter, FL | 3.0 | 2.0 | 1315 | $5,200 | $3.95 | 26d | 1 | 0.09mi |
| 717 S US Highway 1 #1016 Jupiter, FL | 2.0 | 2.5 | 1274 | $3,200 | $2.51 | 12d | 1 | 0.09mi |
| 353 S US Highway 1 Unit C301 Jupiter, FL | 2.0 | 2.5 | 1347 | $2,950 | $2.19 | 0d | 1 | 0.10mi |
| 353 S US Highway 1 Unit F306 Jupiter, FL | 2.0 | 2.5 | 1347 | $2,400 | $1.78 | 26d | 1 | 0.10mi |
| 353 S US Highway 1 Unit A8 Jupiter, FL | 2.0 | 2.0 | 925 | $2,350 | $2.54 | 7d | 1 | 0.10mi |
| 353 S US Highway 1 Unit A207 Jupiter, FL | 2.0 | 2.0 | 1056 | $2,700 | $2.56 | 16d | 1 | 0.10mi |
| 353 S US Highway 1 Unit C202 Jupiter, FL | 2.0 | 2.0 | 1056 | $8,000 | $7.58 | 26d | 1 | 0.10mi |
| 353 S US Highway 1 Unit B8 Jupiter, FL | 2.0 | 2.0 | 925 | $2,400 | $2.59 | 26d | 1 | 0.10mi |
| 353 S US Highway 1 Unit A107 Jupiter, FL | 2.0 | 2.0 | 1056 | $2,450 | $2.32 | 26d | 1 | 0.10mi |
| 353 S US Highway 1 Unit A407 Jupiter, FL | 2.0 | 2.0 | 1056 | $7,500 | $7.10 | 26d | 1 | 0.10mi |
| 353 S US Highway 1 Unit A105 Jupiter, FL | 2.0 | 2.5 | 1347 | $2,500 | $1.86 | 26d | 1 | 0.10mi |
| 353 US-1 Jupiter, FL | 2.0 | 2.0 | 1000 | $2,600 | $2.60 | 26d | 1 | 0.21mi |
| 288 Seabreeze Cir Jupiter, FL | 2.0 | 2.5 | 1250 | $4,100 | $3.28 | 26d | 1 | 0.24mi |
| 860 Bella Vista Ct S #60 Jupiter, FL | 3.0 | 2.5 | 1640 | $2,500 | $1.52 | 22d | 1 | 0.24mi |
| 360 Bella Vista Ct N #60 Jupiter, FL | 3.0 | 3.0 | 1640 | $10,000 | $6.10 | 26d | 1 | 0.25mi |
| 820 Bella Vista Ct S #20 Jupiter, FL | 2.0 | 2.0 | 1138 | $3,200 | $2.81 | 26d | 1 | 0.25mi |
| 270 Bella Vista Ct N #70 Jupiter, FL | 3.0 | 3.0 | 1640 | $7,500 | $4.57 | 26d | 1 | 0.25mi |
| 470 Bella Vista Ct N Jupiter, FL | 3.0 | 2.5 | 1640 | $2,900 | $1.77 | 22d | 1 | 0.25mi |
| 131 Ocean Cove Dr Jupiter, FL | 2.0 | 2.5 | 1288 | $6,000 | $4.66 | 26d | 1 | 0.26mi |
| 121 Ocean Cove Dr #121 Jupiter, FL | 2.0 | 2.5 | 1288 | $3,200 | $2.48 | 26d | 1 | 0.27mi |
| 275 Palm Ave Jupiter, FL | 1.0–2.0 | 1.5–2.0 | 1075 | $5,800 | $5.40 | 4d | 6 | 0.30mi |
| 275 Palm Ave Jupiter, FL | 1.0–2.0 | 1.5–2.0 | 1075 | $5,800 | $5.40 | 9d | 6 | 0.30mi |
| 275 Palm Ave Jupiter, FL | 1.0–2.0 | 1.5–2.0 | 1075 | $5,800 | $5.40 | 7d | 6 | 0.30mi |
| 260 Seabreeze Cir Jupiter, FL | 2.0 | 2.5 | 1250 | $3,000 | $2.40 | 16d | 1 | 0.31mi |
| 1044 S Us Hwy 1 Jupiter, FL | 2.0–3.0 | 2.0 | 1241 | $3,305 | $2.66 | 5d | 5 | 0.32mi |
| 213 Seabreeze Cir Jupiter, FL | 3.0 | 2.5 | 1620 | $2,900 | $1.79 | 12d | 1 | 0.35mi |
| 237 Seabreeze Cir Jupiter, FL | 2.0 | 2.5 | 1250 | $5,600 | $4.48 | 26d | 1 | 0.35mi |
| 214 Seabreeze Cir Jupiter, FL | 3.0 | 2.5 | 1620 | $4,650 | $2.87 | 26d | 1 | 0.35mi |
| 234 Seabreeze Cir Jupiter, FL | 2.0 | 2.5 | 1250 | $2,750 | $2.20 | 26d | 1 | 0.36mi |
| 131 Palm Ave #36 Jupiter, FL | 2.0 | 2.0 | 1321 | $3,700 | $2.80 | 26d | 1 | 0.36mi |
HOA detail
- Monthly dues
- $794 · $9,528/yr
Listing history 4 events
-
2026-06-21days on market $499,000 Active 5 DOM
-
2026-06-18days on market $499,000 Active 2 DOM
-
2026-06-16remarks 608-char remark
-
2026-06-16$499,000 Active 1 DOM
ⓘ Source: listings_history table (triggers on properties + properties_extension) + one-shot
backfill from property_details.listing_events for pre-trigger history.
Tax reassessment forecast FL · Resets to sale price
- Current annual tax
- $2,573 · $214/mo
- Projected year-2 tax
- $4,142 · $345/mo
- Expected delta
- +$1,569/yr (+$131/mo · 61.0%)
ⓘ Screening estimate from a state-policy table — verify with the county assessor before closing.
Climate risk First Street
- Flood 4/10 Moderate FEMA zone X (unshaded) · 20% chance over 30 yrs
- Wildfire 1/10 Low
- Heat 10/10 Extreme 7 d/yr ≥106°F today · 24 d/yr by 30 yrs out
- Wind 10/10 Extreme 99% chance of damaging wind over 30 yrs
- Air quality 2/10 Low 1 unhealthy d/yr today · 2 by 30 yrs out
Nearby sold comps map
Loading sold comps map…
Walkable amenities ~0.75 mi
Loading nearby amenities…
Taxation est. · year 1
- Rental income
- $44,825
- − Mortgage interest
- −$27,952
- − Property taxes
- −$2,573
- − Insurance
- −$2,495
- − Repairs & maintenance
- −$3,586
- − Management
- −$3,586
- − HOA
- −$9,528
- − Depreciation
- −$14,516
- Taxable loss
- −$19,411
- Est. tax savings @ 24.0%
- +$4,659
- After-tax cash flow
- $-5,927/yr
For passive investors: Depreciation is non-cash, so a rental often shows a tax loss while cash-flowing — sheltering income. Rental losses are passive: they offset passive income freely, and up to $25,000/yr can offset ordinary (W-2) income if you actively participate and your MAGI is under $100k (phasing out to $0 by $150k); unused losses carry forward. On sale, claimed depreciation is recaptured at up to 25%, and gains may owe capital-gains tax (a 1031 exchange can defer both). Figures are a year-1 estimate at your 24.0% rate — not tax advice; consult a CPA.
Schools (NCES district)
- District
- Palm Beach
- NCES district ID
- 1201500
- Math proficiency
- 46% ▼ -16.00%
- Reading proficiency
- 53% ▼ -4.00%
- Median HH income
- $53,943
- Composite
- 42.72/100
- National rank
- #3160
- State rank
- #34 of 73 in FL
Livability — Jupiter
- Score
- 70/100
- State rank
- #415
- US rank
- #7386
Category grades
Schools grade is shown separately in the Schools card above.
Census & demographics
- Census place
- Jupiter, FL
- County
- Palm Beach County · 1,438,312 people
- City population
- 68,420
- Metro
- Miami-Fort Lauderdale-Pompano Beach, FL
- Population (ZIP)
- 12,908
- Household income
- $104,992
- Rent vs Own
- Severe rent burden
- 445.0
Population outlook (Palm Beach County) Hauer SSP2
- Today (2025)
- 1,637,487 people
- By 2030
- 1,743,255 · +6.5%
- By 2040
- 1,948,712 · +19.0%
- By 2050
- 2,132,979 · +30.3%
- By 2075
- 2,530,027 · +54.5%
- By 2100
- 2,706,979 · +65.3%
Race, ethnicity, and origin ACS 2023
- Neighborhood character
- Predominantly White (93%)
- Race & ethnicity
- White 93% Hispanic / Latino 5% Two or more races 4%
- Hispanic origin (detail)
- Common ancestry
- Romanian 6% Scotch-Irish 4% Lithuanian 2%
- Foreign-born
- 10% · Canada, Guatemala, Jamaica
- Languages at home
- 90% English-only · Spanish 5% Other Indo-European 2% German/W. Germanic 1%
Political lean MEDSL · Palm Beach
- 2024 margin
- Toss-up / Even · D 50.0% · R 49.2%
- 2008→2024 swing
- -22.1pp toward R · 2008: 22.9pp · 2024: 0.8pp
- All cycles
- 2024: D+0.8 2020: D+12.8 2016: D+15.3 2012: D+17.0 2008: D+22.9
Not yet ingested
- Civics
- —
Market trends
- HPI YoY
- ▲ 2.93%
- Current HPI
- 356.212
- Rent YoY
- ▲ 10.27%
- Metro
- Miami-Fort Lauderdale-Pompano Beach, FL
- State GDP YoY
- ▲ 3.28%
- F500 in state
- 36
Industry mix (Fortune 500 HQ in FL)
| Industry | F500 HQs | Revenue |
|---|---|---|
| Industrial Technology | 2 | $29B |
|
||
| Insurance | 2 | $17B |
|
||
| Retail | 1 | $60B |
|
||
| Technology Distribution | 1 | $58B |
|
||
| Homebuilding | 1 | $35B |
|
||
| Technology Manufacturing | 1 | $35B |
|
||
Price history
+343.6% since first listed4 events — show timeline
- 2026-06-16 Listed $499,000 Beaches MLS
- 2004-04-23 Sold (Public Records) $250,000 Public Records
- 1998-05-19 Sold (Public Records) $123,500 Public Records
- 1994-06-23 Sold (Public Records) $112,500 Public Records
Property tax history
-0.8%/yrLatest (2025): $2,573 · +3.6% YoY. Source: county tax records.
Cash-flow waterfall
monthlySold comps — $/sqft
last 12 mo · ≤1 miLoading sold comps…