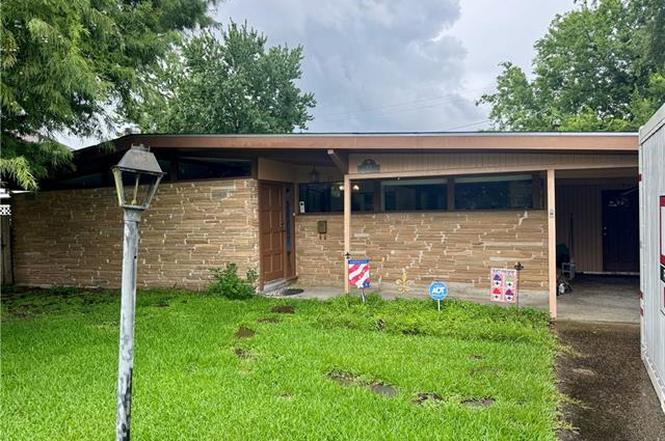
11 Laux Manor Dr · Metairie, LA
Flood risk No data
- FEMA flood zone
- —
- Chance of flooding over 30 yrs
- —
- Est. flood insurance / yr
- —
Fire risk No data
- Est. fire insurance / yr
- —
Heat risk No data
- Hot days now (above threshold)
- —
- Hot days in 30 yrs
- —
Wind risk No data
- Chance of severe wind over 30 yrs
- —
Air-quality risk No data
- Unhealthy air days now
- —
- Unhealthy air days in 30 yrs
- —
Risk factors via First Street. Map © Google.
Why this score? — see what drove the C grade
The composite is a weighted blend of 9 inputs, each scored 0–100. Each bar is that input's sub-score; the figure is the points it added to the 100-point composite (weight × sub-score).
- Cash flow +18.9/30.0
- ARV discount +15.0/15.0
- DSCR +5.9/10.0
- 1% rule +4.5/10.0
- Livability +4.4/5.0
- Rent growth +3.0/5.0
- Schools +2.5/10.0
- Condition / age +2.5/5.0
- Appreciation +0.0/10.0
$240,000
🖨 Deal sheet 📄 Offer letter ✓ Due diligence
Listing remarks MLS
WALKING DISTANCE TO ZEPHYRS STADIUM, SAINTS CAMP, WINN DIXIE & BUS LINE. On a wonderful cul-de-sac. .. .kid friendly play area in middle of cul-de-sac. X FLOOD ZONE. Flood Ins. approx. $400yr. 4th bedroom could be rec room, den or office. Central kitchen, dining room, large den with lots of natural light. Plenty storage, large inside laundry. Carport, hot tub in back yard. Near new Jeff Par Sheriffs Department by Lasalle Field.
Key facts
- 6,899 sq ft lot
- Parking
- Pool
Property features AI
Exterior
- Parking: Carport
- Utilities: Electric service: Entergy
- Home design: Single-family residence
- Construction: Wood siding; Other roof material
- Exterior features: Above-ground pool
Interior
- Kitchen: Dishwasher; Disposal; Microwave
- Bedrooms: Bedroom 1; Bedroom 2
- Bathrooms: 2 full bathrooms
- Fireplace: Gas log fireplace
- Heating & cooling: Central heating; Central air conditioning; Has heating and cooling
- Interior features: Living room; Dining room; Den; Pantry; Bathroom 1
- Laundry & utility: Laundry room; Washer; Dryer
Neighborhood map
What this means for you Summary
Snapshot
- This is a 3-bed/2.0-bath single-family listed at $240k.
Deal economics
- At list price, monthly cash flow is $245 ($3k/yr) — positive.
- The deal already cash-flows at list — no discount required.
- To meet the 1% rule (rent ≥ 1% of price), the offer needs to be $229k (4.6% below list).
- Recommended offer: $229k (4.6% below list) — sets the bar for 1% rule.
- Cap rate 7.5% vs local median 3.6% in Metairie — top-decile yield for the area; either an underpriced asset or a hidden risk that comps aren't pricing in. Stress-test before assuming the spread holds.
Location & tenants
- Location reads 87/100 on livability (#1 in LA, #261 nationally) — a professional / high-income tenant draw. Strengths: commute A+, housing A+, health & safety A+.
- Jefferson Parish (suburban): math 24% / reading 34% proficiency, ranked #44 of 98 in LA (top 45%) — low school quality limits family demand, transient renter base, plan for 1-2y turnover; 70% free/reduced lunch — lower-income household profile, screen leases tightly.
- Market conditions: Rents rising (+2.1%/yr); 224 active listings in the ZIP; 22 comparable units currently listed for rent nearby; rentals at typical pace (median 24d on market — plan ~3-4 weeks tenant-placement turnaround); solid renter incomes; 518 units permitted in Jefferson Parish in 2024 (43 in 5+ unit buildings).
- This rent runs 36% of the median local income ($76k/yr) — at the standard rent-burdened threshold; future hikes will face affordability resistance.
Forward outlook
- Local home prices are declining (-3.0%/yr); year-one equity from $2k of loan paydown is wiped out by about $7k of value loss. Plan a longer hold.
Negotiation context
- Only 1 days on market — expect competitive offers; lowballing is unlikely to land.
- 6 sale attempts since 26y ago; this cycle's ask is 20% above the opening price — seller raised mid-cycle; expect resistance to lowballs.
- Current owner paid $194k; 23% above their basis — modest negotiation headroom, anchor on the comps not their cost.
Risks & watch-outs
- Watch-outs: built in 1950 — expect roof / HVAC / electrical / plumbing capex.
Questions for the listing agent
- Built in 1950 — when were the roof, HVAC, electrical panel, plumbing, and water heater last replaced?
- Is there a deadline driving the sale (1031 exchange, divorce, estate, relocation)? That informs how much negotiation room exists.
- Schools are B-rated — typically a magnet for longer-tenancy family renters. What's the average tenant stay here, and is there a school-zone premium baked into asking?
- What's the average days-on-market for RENTAL listings here right now (not sales)? A rising rental-DOM trend means longer vacancies and softer asking-rent achievability than the comps imply.
- What's the recent tenant-quality profile in this submarket — average credit score on applications, eviction rate, late-payment / NSF rate, and stable-employment percentage? A property-management company in the area should have these aggregated.
- How much new for-sale + rental construction is in the pipeline within 1–3 miles? Heavy new supply typically softens prices + rents 12–24 months out; constrained supply supports both.
Investment metrics
- 1% rule
- 0.95% ✗
- Cap rate
- 7.52%
- Cash-on-cash
- 4.37%
- DSCR
- 1.19
- GRM
- 8.7
CMA / ARV
- ARV (on-the-fly)
- $373,100
- Comps found
- 12
Show comp detail 12 sales within ~0.75 mi
| Address | Dist | Beds/Ba | Sqft | Sold | Price | $/sf | Match |
|---|---|---|---|---|---|---|---|
| 504 Colony Pl | 0.18mi | 3/2.5 | 2,165 (+6%) | 0mo | $434,900 | $201 | 80 |
| 501 Colony Pl | 0.21mi | 4/2.0 (+1) | 2,150 (+5%) | 1mo | $268,000 | $125 | 76 |
| 6116 Amhurst St | 0.56mi | 3/2.0 | 2,031 (-1%) | 6mo | $295,000 | $145 | 67 |
| 713 Colony Pl | 0.27mi | 4/2.0 (+1) | 1,902 (-7%) | 8mo | $275,000 | $145 | 64 |
| 5814 Aero St | 0.09mi | 4/2.5 (+1) | 2,300 (+12%) | 6mo | $450,000 | $196 | 64 |
| 410 Kent Ave | 0.40mi | 3/3.0 | 1,840 (-10%) | 1mo | $340,000 | $185 | 59 |
| 4833 Garden St | 0.71mi | 4/2.0 (+1) | 2,100 (+2%) | 2mo | $489,000 | $233 | 56 |
| 1216 Carnation Ave | 0.62mi | 4/2.5 (+1) | 1,950 (-5%) | 1mo | $355,000 | $182 | 55 |
| 525 Transcontinental Dr | 0.53mi | 3/2.0 | 1,811 (-12%) | 7mo | $197,000 | $109 | 50 |
| 601 Airline Park Blvd | 0.60mi | 3/3.0 | 1,803 (-12%) | 1mo | $246,000 | $136 | 47 |
| 4825 Eagle St | 0.65mi | 3/2.0 | 1,744 (-15%) | 5mo | $215,000 | $123 | 41 |
| 1401 Colony Pl | 0.57mi | 4/2.5 (+1) | 2,320 (+13%) | 7mo | $449,000 | $194 | 38 |
Match score weights: distance 35% · size 25% · config 20% · recency 20%. Top-matched comps best support the ARV.
Projected returns pro-forma
-3.0% appreciation · 2.15% rent growth · sell at horizon
- IRR
- -10.4%
- Equity multiple
- 0.62×
- Total profit
- $-25,270
- Equity at exit
- $35,785
- IRR
- -2.2%
- Equity multiple
- 0.85×
- Total profit
- $-9,862
- Equity at exit
- $20,751
Cash invested: $67,200 (down + closing). Projections, not guarantees.
Landlord ↔ Tenant lean methodology
- Overall (STATE)
- 90 Strongly Landlord-Friendly
- State Louisiana
- 90 Strongly Landlord-Friendly · R+12
- County
- — inherits STATE
- City
- — inherits STATE
ZIP-level market 70003
- Rents YoY
- 2.1%
- Active inventory
- 224
- Price-to-rent
- 8.7×
Monthly cashflow live
- Estimated rent
- $2,288 high interval (Pro) →
- Mortgage (P&I)
- −$1,259
- Tax from tax record
- −$205 /mo · $2,455/yr
- Insurance
- −$100
- HOA
- −$0
- Vacancy / Maint / Mgmt
- −$481
- Net cashflow
- $245
Break-even live
UW: 25.0% down · 7.5% · 30yr · 1.5% tax · 5.0% vac · 8.0% maint · 8.0% mgmt
Financing live
Cash to close
- Down payment
- $60,000
- Closing costs
- $7,200
- Reserves months
- —
- Total cash needed
- —
Loan-product check · same deal, 3 products live
Conventional
25% down · 7.5% · 30yr
- Down + closing
- —
- Monthly P&I
- —
- Monthly cashflow
- —
- DSCR
- —
- Eligible?
- —
Personal DTI + credit; lowest rate.
DSCR
20% down · 8.5% · 30yr
- Down + closing
- —
- Monthly P&I
- —
- Monthly cashflow
- —
- DSCR
- —
- Eligible?
- —
No personal income docs; deal must DSCR.
Hard money
10% down · 12.0% · 12mo
- Down + closing
- —
- Monthly P&I
- —
- Monthly cashflow
- —
- DSCR
- —
- Eligible?
- —
Short-term bridge; refi at stabilization.
Rent comps 22 comps
| Address | Beds | Baths | Sqft | Rent | $/sqft | DOM | Units | Dist |
|---|---|---|---|---|---|---|---|---|
| 3 Donald Ct Metairie, LA | 3.0 | 2.0 | 1633 | $2,000 | $1.22 | 24d | 1 | 0.14mi |
| 5017 Soldier St Metairie, LA | 3.0 | 2.0 | 1575 | $1,900 | $1.21 | 14d | 1 | 0.47mi |
| 703 Linden St Metairie, LA | 3.0 | 2.0 | 1650 | $2,500 | $1.52 | 20d | 1 | 0.48mi |
| 6016 Loraine St Metairie, LA | 3.0 | 1.0 | 1600 | $1,950 | $1.22 | 2d | 1 | 0.56mi |
| 820 Calvert St Metairie, LA | 3.0 | 2.0 | 1900 | $3,000 | $1.58 | 44d | 1 | 0.62mi |
| 713 Calvert St Metairie, LA | 3.0 | 2.5 | 1644 | $2,200 | $1.34 | 24d | 1 | 0.65mi |
| 711 Calvert Ave Metairie, LA | 3.0 | 2.5 | 1644 | $2,150 | $1.31 | 24d | 1 | 0.65mi |
| 1216 Hymelia Ave Metairie, LA | 4.0 | 2.0 | 1400 | $3,500 | $2.50 | 4d | 1 | 0.66mi |
| 4807 Evangeline St Metairie, LA | 2.0 | 2.0 | 1415 | $1,850 | $1.31 | 4d | 1 | 0.68mi |
| 1108 Cardinal Ave Metairie, LA | 4.0 | 2.0 | 1903 | $2,650 | $1.39 | 44d | 1 | 0.75mi |
| 4711 Grammar Ave Metairie, LA | 3.0 | 2.0 | 1794 | $1,550 | $0.86 | 4d | 1 | 0.78mi |
| 1808 Elise Ave Metairie, LA | 3.0 | 2.0 | 1508 | $2,100 | $1.39 | 24d | 1 | 0.92mi |
| 4445 Perkins St #110 Metairie, LA | 2.0 | 2.0 | 1500 | $1,650 | $1.10 | 44d | 1 | 1.01mi |
| 4502 Park Dr N Unit 4502 Metairie, LA | 2.0 | 2.5 | 1452 | $2,100 | $1.45 | 3d | 1 | 1.02mi |
| 1712 Abadie Ave Metairie, LA | 4.0 | 2.0 | 1900 | $2,750 | $1.45 | 24d | 1 | 1.09mi |
| 4324 Barnard St Metairie, LA | 3.0 | 2.5 | 1526 | $2,699 | $1.77 | 44d | 1 | 1.17mi |
| 4322 Barnard St Metairie, LA | 3.0 | 2.5 | 1526 | $2,699 | $1.77 | 44d | 1 | 1.17mi |
| 4960 York St Unit 4954 Metairie, LA | 3.0 | 2.5 | 1597 | $2,150 | $1.35 | 4d | 1 | 1.22mi |
| 2012 Airline Park Blvd Metairie, LA | 3.0 | 2.0 | 1583 | $2,100 | $1.33 | 24d | 1 | 1.33mi |
| 817 Pasadena Ave Metairie, LA | 3.0 | 2.0 | 1871 | $3,300 | $1.76 | 44d | 1 | 1.34mi |
| 2013 N Woodlawn Ave Metairie, LA | 3.0 | 2.0 | 1400 | $2,050 | $1.46 | 44d | 1 | 1.38mi |
| 527 Little Farms Ave New Orleans, LA | 3.0 | 2.0 | 1855 | $2,800 | $1.51 | 24d | 1 | 1.45mi |
Listing history 3 events
-
2026-06-17status $240,000 Active 1 DOM
-
2026-06-17remarks 699-char remark
-
2026-06-17$240,000 Coming Soon 1 DOM
ⓘ Source: listings_history table (triggers on properties + properties_extension) + one-shot
backfill from property_details.listing_events for pre-trigger history.
Tax reassessment forecast LA · Resets to sale price
- Current annual tax
- $2,455 · $205/mo
- Projected year-2 tax
- $2,455 · $205/mo
- Expected delta
- $0/yr ($0/mo · 0.0%)
ⓘ Screening estimate from a state-policy table — verify with the county assessor before closing.
Nearby sold comps map
Loading sold comps map…
Walkable amenities ~0.75 mi
Loading nearby amenities…
Taxation est. · year 1
- Rental income
- $27,461
- − Mortgage interest
- −$13,444
- − Property taxes
- −$2,455
- − Insurance
- −$1,200
- − Repairs & maintenance
- −$2,197
- − Management
- −$2,197
- − Depreciation
- −$6,982
- Taxable loss
- −$1,013
- Est. tax savings @ 24.0%
- +$243
- After-tax cash flow
- $3,180/yr
For passive investors: Depreciation is non-cash, so a rental often shows a tax loss while cash-flowing — sheltering income. Rental losses are passive: they offset passive income freely, and up to $25,000/yr can offset ordinary (W-2) income if you actively participate and your MAGI is under $100k (phasing out to $0 by $150k); unused losses carry forward. On sale, claimed depreciation is recaptured at up to 25%, and gains may owe capital-gains tax (a 1031 exchange can defer both). Figures are a year-1 estimate at your 24.0% rate — not tax advice; consult a CPA.
Schools (NCES district)
- District
- Jefferson Parish
- NCES district ID
- 2200840
- Math proficiency
- 24% ▼ -36.00%
- Reading proficiency
- 34% ▼ -30.00%
- Median HH income
- $48,421
- Composite
- 25.19/100
- National rank
- #7511
- State rank
- #44 of 98 in LA
Livability — Metairie
- Score
- 87/100
- State rank
- #1
- US rank
- #261
Category grades
Schools grade is shown separately in the Schools card above.
Census & demographics
- Census place
- Metairie, LA
- County
- Jefferson Parish · 426,999 people
- City population
- 137,978
- Metro
- New Orleans-Metairie, LA
- Population (ZIP)
- 39,344
- Household income
- $76,261
- Rent vs Own
- Severe rent burden
- 710.0
Population outlook (Jefferson County) Hauer SSP2
- Today (2025)
- 451,696 people
- By 2030
- 455,451 · +0.8%
- By 2040
- 458,308 · +1.5%
- By 2050
- 461,031 · +2.1%
- By 2075
- 476,351 · +5.5%
- By 2100
- 499,377 · +10.6%
Race, ethnicity, and origin ACS 2023
- Neighborhood character
- Predominantly White (65%)
- Race & ethnicity
- White 65% Hispanic / Latino 19% Two or more races 12% Black 8% Asian 5%
- Hispanic origin (detail)
- Mexican 3% Cuban 1%
- Common ancestry
- Lithuanian 12% Scotch-Irish 1% Slovak 1%
- Foreign-born
- 14% · Canada, Vietnam, China
- Languages at home
- 81% English-only · Spanish 12% Other Indo-European 3% Arabic 1%
Political lean MEDSL · Jefferson
- 2024 margin
- R (+12.9) · D 42.5% · R 55.5% · Other 2.1%
- 2008→2024 swing
- +13.6pp toward D · 2008: -26.6pp · 2024: -12.9pp
- All cycles
- 2024: R+12.9 2020: R+11.1 2016: R+14.8 2012: R+18.4 2008: R+26.6
Not yet ingested
- Civics
- —
Market trends
- HPI YoY
- ▼ -252.03%
- Current HPI
- 138.5632
- Rent YoY
- ▲ 2.15%
- Metro
- New Orleans-Metairie, LA
- State GDP YoY
- ▲ 3.29%
- F500 in state
- 10
Industry mix (Fortune 500 HQ in LA)
| Industry | F500 HQs | Revenue |
|---|---|---|
| Telecommunications | 2 | $23B |
|
||
| Utilities | 1 | $12B |
|
||
| Wholesale / Distribution | 1 | $5B |
|
||
| Advertising | 1 | $2B |
|
||
Price history
+72.7% since first listed11 events — show timeline
- 2026-06-17 Coming Soon $240,000 AcadianaMLS
- 2014-05-29 Sold (Public Records) $194,500 Public Records
- 2014-05-19 Sold (MLS) $194,500 GSREIN
- 2014-03-14 Listed $199,900 AcadianaMLS
- 2014-03-14 Listed $199,900 GSREIN
- 2011-05-13 Listed $199,900 GSREIN
- 2011-05-13 Listed $199,900 AcadianaMLS
- 2000-06-23 Sold (MLS) $130,000 GSREIN
- 2000-06-01 Sold (Public Records) $130,000 Public Records
- 2000-04-14 Listed $139,000 AcadianaMLS
- 2000-04-14 Listed $139,000 GSREIN
Property tax history
+1.1%/yrLatest (2025): $2,455 · +0.2% YoY. Source: county tax records.
Cash-flow waterfall
monthlySold comps — $/sqft
last 12 mo · ≤1 miLoading sold comps…