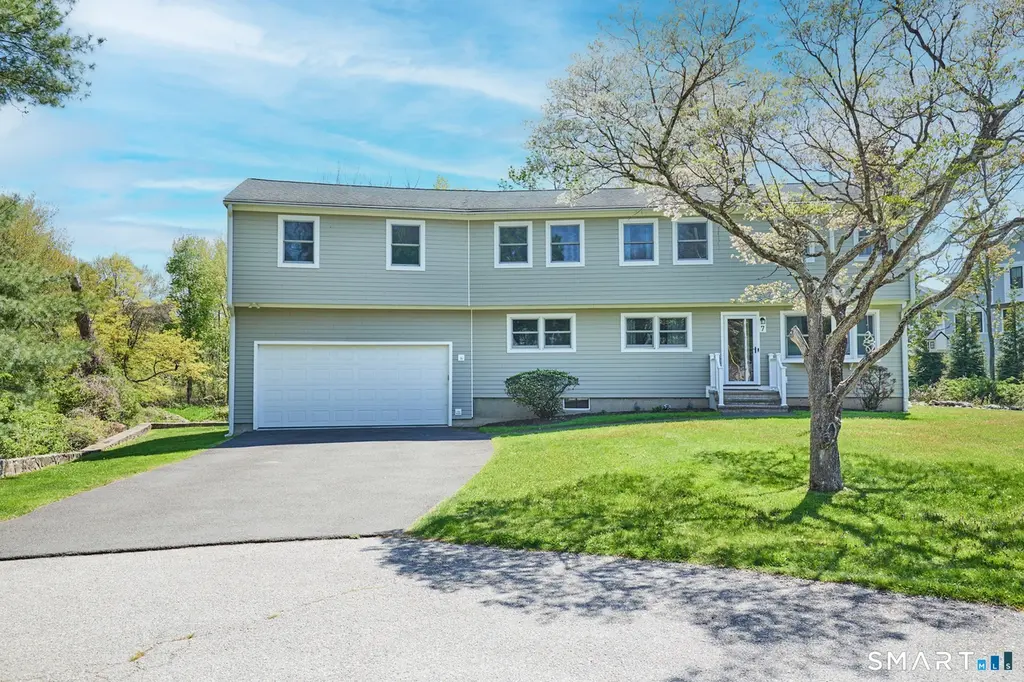
7 Keller Ln · Staples, CT
Flood risk 4/10 · Minor
- FEMA flood zone
- X (unshaded)
- Chance of flooding over 30 yrs
- 0.22%
- Est. flood insurance / yr
- $507 – $1,088
Fire risk 1/10 · Minimal
- Est. fire insurance / yr
- $829 – $1,539
Heat risk 6/10 · Moderate
- Hot days now (above 98°F)
- 7 days/yr
- Hot days in 30 yrs
- 15 days/yr
Wind risk 6/10 · Moderate
- Chance of severe wind over 30 yrs
- 64.0%
Air-quality risk 8/10 · Major
- Unhealthy air days now
- 13 days/yr
- Unhealthy air days in 30 yrs
- 18 days/yr
Risk factors via First Street. Map © Google.
Why this score? — see what drove the D grade
The composite is a weighted blend of 9 inputs, each scored 0–100. Each bar is that input's sub-score; the figure is the points it added to the 100-point composite (weight × sub-score).
- ARV discount +15.0/15.0
- Schools +7.6/10.0
- Cash flow +7.1/30.0
- Rent growth +3.9/5.0
- Livability +2.5/5.0
- Condition / age +2.5/5.0
- DSCR +1.3/10.0
- 1% rule +1.2/10.0
- Appreciation +0.0/10.0
$1,325,000
🖨 Deal sheet 📄 Offer letter ✓ Due diligence
Listing remarks
Pristine Classic Westport Colonial thoughtfully updated to accommodate today's lifestyle. Home offers a gracious Living Room/Fpl/dining area, Six spacious Bedrooms plus 22x 28 Bonus room. Two bedrooms plus full bath on main Level. 16 x 23 Primary Bedroom plus 3 generous bedrooms on upper level. This level serviced by luxurious updated Full Bath. Kitchen is appointed with upscale appliances including 2025 Refrigerator and red oak flooring. Flexible Room 22x28/half bath can fulfill whatever your needs- in law, office family room all possibilities. Situated on private cul de sac ($500 annual contribution-no formal assoc)on. 37 acre in heart of Westport. Shopping, restuarants, beaches, town own
Key facts
- Updated full bath
- Private cul de sac
- Upscale appliances
Tags
Property features AI
Exterior
- Parking: Attached garage; Two-car garage
- Utilities: Public water connected; Public sewer connected; Oil hot water and heating; Fuel tank located in basement; Generator-ready; Storm doors
- Home design: Single-family home; Grey exterior
- Construction: Frame construction; Concrete foundation; Asphalt shingle roof
- Exterior features: Patio; Beach rights; Located on a cul-de-sac
Interior
- Kitchen: Oven/Range; Microwave; Refrigerator; Dishwasher
- Bedrooms: Six bedrooms
- Bathrooms: Two full bathrooms; One half bathroom
- Heating & cooling: Central air; Split system; Zoned cooling; Hot water heat (oil-fired); Oil hot water heater in basement
- Interior features: Auto garage door opener; Cable available; Possible in-law apartment; One fireplace; Has attic with hatch access; Bonus room
- Laundry & utility: Large laundry room with built-in ironing board; Main level laundry
Neighborhood map
What this means for you Summary
Snapshot
- This is a 6-bed/2.5-bath single-family listed at $1.32M.
Deal economics
- At list price, monthly cash flow is $-2k ($-23k/yr) — negative.
- To cash-flow at today's rent, offer at most $990k (25.3% below list).
- To meet the 1% rule (rent ≥ 1% of price), the offer needs to be $819k (38.2% below list).
- Recommended offer: $819k (38.2% below list) — sets the bar for 1% rule.
Location & tenants
- Location reads: area grade D — affects rentability + tenant quality, not the cash-flow math above.
- Westport School District (suburban): math 74% / reading 82% proficiency, ranked #3 of 153 in CT (top 2%) — strong family-tenant draw, lease renewals of 3-5y typical; only 2% free/reduced lunch — higher-income household profile.
- Zoned schools: Long Lots School (math 76% / reading 86%, grade A+, #20 of 553 statewide, top 4%, 590 students, 2% FRL); Staples High School (math 76% / reading 92%, grade A, #3 of 194 statewide, top 1%, 1,686 students, 2% FRL) — zoned schools at 2% FRL track the district average.
- Market conditions: Rents rising fast (+5.6%/yr); 196 active listings in the ZIP; 3 comparable units currently listed for rent nearby; rentals at typical pace (median 24d on market — plan ~3-4 weeks tenant-placement turnaround); high-income renter base; 1,151 units permitted in Western Connecticut Planning Region in 2024 (714 in 5+ unit buildings).
- This rent runs 39% of the median local income ($250k/yr) — at the standard rent-burdened threshold; future hikes will face affordability resistance.
Forward outlook
- Local home prices are declining (-3.0%/yr); year-one equity from $9k of loan paydown is wiped out by about $40k of value loss. Plan a longer hold.
Negotiation context
- It's been on market 27 days — a 2% lower offer ($1.31M) is reasonable based on typical stale-listing flexibility.
Risks & watch-outs
- Watch-outs: built in 1952 — expect roof / HVAC / electrical / plumbing capex.
- Climate carrying-cost: major wind risk, 64% chance of damaging wind over 30y; extreme-heat days projected 7→15/yr by 2055 (HVAC capex compounding) — expect insurance premiums to compound above CPI over the hold.
Questions for the listing agent
- What do current leases actually rent for vs. the listed asking? Can we see a recent rent roll and the last 12 months of T-12 income?
- Built in 1952 — when were the roof, HVAC, electrical panel, plumbing, and water heater last replaced?
- Is there a deadline driving the sale (1031 exchange, divorce, estate, relocation)? That informs how much negotiation room exists.
- The area grade is low — what's the realistic commute time and amenity access for the typical tenant pool here? Any planned neighborhood developments (good or bad) we should know about?
- What's the average days-on-market for RENTAL listings here right now (not sales)? A rising rental-DOM trend means longer vacancies and softer asking-rent achievability than the comps imply.
- What's the recent tenant-quality profile in this submarket — average credit score on applications, eviction rate, late-payment / NSF rate, and stable-employment percentage? A property-management company in the area should have these aggregated.
- How much new for-sale + rental construction is in the pipeline within 1–3 miles? Heavy new supply typically softens prices + rents 12–24 months out; constrained supply supports both.
Investment metrics
- 1% rule
- 0.62% ✗
- Cap rate
- 4.57%
- Cash-on-cash
- -6.14%
- DSCR
- 0.73
- GRM
- 13.5
CMA / ARV
- ARV (median comp)
- $2,078,819
- List price
- $1,325,000
- Delta
- -36.26%
- Verdict
- UNDERPRICED
- Comps
- 15 within 1.0 mi
Projected returns pro-forma
-3.0% appreciation · 5.58% rent growth · sell at horizon
- IRR
- -24.4%
- Equity multiple
- 0.15×
- Total profit
- $-314,087
- Equity at exit
- $197,562
- IRR
- -14.4%
- Equity multiple
- 0.09×
- Total profit
- $-336,196
- Equity at exit
- $114,562
Cash invested: $371,000 (down + closing). Projections, not guarantees.
Landlord ↔ Tenant lean methodology
- Overall (STATE)
- 27 Tenant-Leaning
- State Connecticut
- 27 Tenant-Leaning · D+7
- County
- — inherits STATE
- City
- — inherits STATE
ZIP-level market 06880
- Rents YoY
- 5.6%
- Active inventory
- 196
- Price-to-rent
- 13.5×
Monthly cashflow live
- Estimated rent
- $8,191 medium interval (Pro) →
- Mortgage (P&I)
- −$6,948
- Tax from tax record
- −$867 /mo · $10,408/yr
- Insurance
- −$552
- HOA
- −$0
- Vacancy / Maint / Mgmt
- −$1,720
- Net cashflow
- $-1,897
Break-even live
UW: 25.0% down · 7.5% · 30yr · 1.5% tax · 5.0% vac · 8.0% maint · 8.0% mgmt
Financing live
Cash to close
- Down payment
- $331,250
- Closing costs
- $39,750
- Reserves months
- —
- Total cash needed
- —
Loan-product check · same deal, 3 products live
Conventional
25% down · 7.5% · 30yr
- Down + closing
- —
- Monthly P&I
- —
- Monthly cashflow
- —
- DSCR
- —
- Eligible?
- —
Personal DTI + credit; lowest rate.
DSCR
20% down · 8.5% · 30yr
- Down + closing
- —
- Monthly P&I
- —
- Monthly cashflow
- —
- DSCR
- —
- Eligible?
- —
No personal income docs; deal must DSCR.
Hard money
10% down · 12.0% · 12mo
- Down + closing
- —
- Monthly P&I
- —
- Monthly cashflow
- —
- DSCR
- —
- Eligible?
- —
Short-term bridge; refi at stabilization.
Rent comps 3 comps
| Address | Beds | Baths | Sqft | Rent | $/sqft | DOM | Units | Dist |
|---|---|---|---|---|---|---|---|---|
| 26 Long Lots Ln Westport, CT | 5.0 | 4.5 | 4127 | $16,500 | $4.00 | 44d | 1 | 0.33mi |
| 10 Fernwood Rd Westport, CT | 5.0 | 3.5 | 4029 | $13,000 | $3.23 | 3d | 1 | 1.30mi |
| 20 Joann Cir Westport, CT | 5.0 | 4.0 | 3392 | $14,000 | $4.13 | 24d | 1 | 1.43mi |
Listing history 11 events
-
2026-06-10status $1,325,000 Under Contract 27 DOM
-
2026-06-09days on market $1,325,000 Under Contract - Continue to Show 27 DOM
-
2026-06-08days on market $1,325,000 Under Contract - Continue to Show 26 DOM
-
2026-06-07days on market $1,325,000 Under Contract - Continue to Show 25 DOM
-
2026-06-05days on market $1,325,000 Under Contract - Continue to Show 22 DOM
-
2026-06-03days on market $1,325,000 Under Contract - Continue to Show 21 DOM
-
2026-06-03days on market $1,325,000 Under Contract - Continue to Show 20 DOM
-
2026-06-01days on market $1,325,000 Under Contract - Continue to Show 19 DOM
-
2026-05-31status $1,325,000 Under Contract - Continue to Show 18 DOM
-
2026-05-31days on market $1,325,000 Active 18 DOM
-
2026-05-13$1,325,000 Active 746-char remark
ⓘ Source: listings_history table (triggers on properties + properties_extension) + one-shot
backfill from property_details.listing_events for pre-trigger history.
Tax reassessment forecast CT · Partial reset (capped growth)
- Current annual tax
- $10,408 · $867/mo
- Projected year-2 tax
- $19,382 · $1,615/mo
- Expected delta
- +$8,974/yr (+$748/mo · 86.2%)
ⓘ Screening estimate from a state-policy table — verify with the county assessor before closing.
Climate risk First Street
- Flood 4/10 Moderate FEMA zone X (unshaded) · 22% chance over 30 yrs
- Wildfire 1/10 Low
- Heat 6/10 Major 7 d/yr ≥98°F today · 15 d/yr by 30 yrs out
- Wind 6/10 Major 64% chance of damaging wind over 30 yrs
- Air quality 8/10 Severe 13 unhealthy d/yr today · 18 by 30 yrs out
Nearby sold comps map
Loading sold comps map…
Walkable amenities ~0.75 mi
Loading nearby amenities…
Taxation est. · year 1
- Rental income
- $98,290
- − Mortgage interest
- −$74,221
- − Property taxes
- −$10,408
- − Insurance
- −$6,625
- − Repairs & maintenance
- −$7,863
- − Management
- −$7,863
- − Depreciation
- −$38,545
- Taxable loss
- −$47,236
- Est. tax savings @ 24.0%
- +$11,337
- After-tax cash flow
- $-11,429/yr
For passive investors: Depreciation is non-cash, so a rental often shows a tax loss while cash-flowing — sheltering income. Rental losses are passive: they offset passive income freely, and up to $25,000/yr can offset ordinary (W-2) income if you actively participate and your MAGI is under $100k (phasing out to $0 by $150k); unused losses carry forward. On sale, claimed depreciation is recaptured at up to 25%, and gains may owe capital-gains tax (a 1031 exchange can defer both). Figures are a year-1 estimate at your 24.0% rate — not tax advice; consult a CPA.
Schools (NCES district)
- District
- Westport School District
- NCES district ID
- 0905040
- Math proficiency
- 74% ▼ -8.00%
- Reading proficiency
- 82% ▼ -3.00%
- Median HH income
- $156,579
- Composite
- 76.16/100
- National rank
- #114
- State rank
- #3 of 153 in CT
Livability — Staples
No livability data for this city. (Only ~50 U.S. cities are tracked.)
Census & demographics
- Census place
- Staples, CT
- County
- Fairfield County · 765,532 people
- City population
- 27,364
- Metro
- Bridgeport-Stamford-Norwalk, CT
- Population (ZIP)
- 27,583
- Household income
- $250,001
- Rent vs Own
- Severe rent burden
- 225.0
Population outlook (Western Connecticut County) Hauer SSP2
- By 2040
- 685,031
Race, ethnicity, and origin ACS 2023
- Neighborhood character
- Predominantly White (79%)
- Race & ethnicity
- White 79% Hispanic / Latino 9% Two or more races 9% Asian 5% Black 2%
- Hispanic origin (detail)
- Mexican 1% Puerto Rican 1%
- Common ancestry
- Romanian 6% Scotch-Irish 4% Italian 3%
- Foreign-born
- 16% · Canada, China, Jamaica
- Languages at home
- 85% English-only · Other Indo-European 5% Spanish 5% French/Haitian/Cajun 1%
Political lean MEDSL · Western Connecticut
- 2024 margin
- D (+19.1) · D 58.8% · R 39.7% · Other 1.6%
- All cycles
- 2024: D+19.1
Not yet ingested
- Civics
- —
Market trends
- HPI YoY
- ▼ -608.79%
- Current HPI
- 200.5498
- Rent YoY
- ▲ 5.58%
- Metro
- Bridgeport-Stamford-Norwalk, CT
- State GDP YoY
- ▲ 1.06%
- F500 in state
- 38
Industry mix (Fortune 500 HQ in CT)
| Industry | F500 HQs | Revenue |
|---|---|---|
| Industrial Machinery | 4 | $38B |
|
||
| Insurance | 3 | $71B |
|
||
| Financial Services | 2 | $25B |
|
||
| Transportation / Logistics | 2 | $18B |
|
||
| Healthcare | 1 | $247B |
|
||
| Telecommunications | 1 | $55B |
|
||
Price history
3 events — show timeline
- 2026-06-09 Pending — Smart MLS
- 2026-05-31 Contingent — Smart MLS
- 2026-05-13 Listed $1,325,000 Smart MLS
Property tax history
+0.8%/yrLatest (2023): $10,408 · +1.6% YoY. Source: county tax records.
Cash-flow waterfall
monthlySold comps — $/sqft
last 12 mo · ≤1 miLoading sold comps…