12039 La Cuchilla · San Antonio, TX
Flood risk No data
- FEMA flood zone
- —
- Chance of flooding over 30 yrs
- —
- Est. flood insurance / yr
- —
Fire risk No data
- Est. fire insurance / yr
- —
Heat risk No data
- Hot days now (above threshold)
- —
- Hot days in 30 yrs
- —
Wind risk No data
- Chance of severe wind over 30 yrs
- —
Air-quality risk No data
- Unhealthy air days now
- —
- Unhealthy air days in 30 yrs
- —
Risk factors via First Street. Map © Google.
Why this score? — see what drove the D+ grade
The composite is a weighted blend of 9 inputs, each scored 0–100. Each bar is that input's sub-score; the figure is the points it added to the 100-point composite (weight × sub-score).
- ARV discount +14.9/15.0
- Cash flow +11.6/30.0
- Condition / age +4.8/5.0
- Schools +4.4/10.0
- Livability +4.0/5.0
- 1% rule +3.9/10.0
- DSCR +3.4/10.0
- Rent growth +1.7/5.0
- Appreciation +0.0/10.0
$198,999
🖨 Deal sheet 📄 Offer letter ✓ Due diligence
Listing remarks
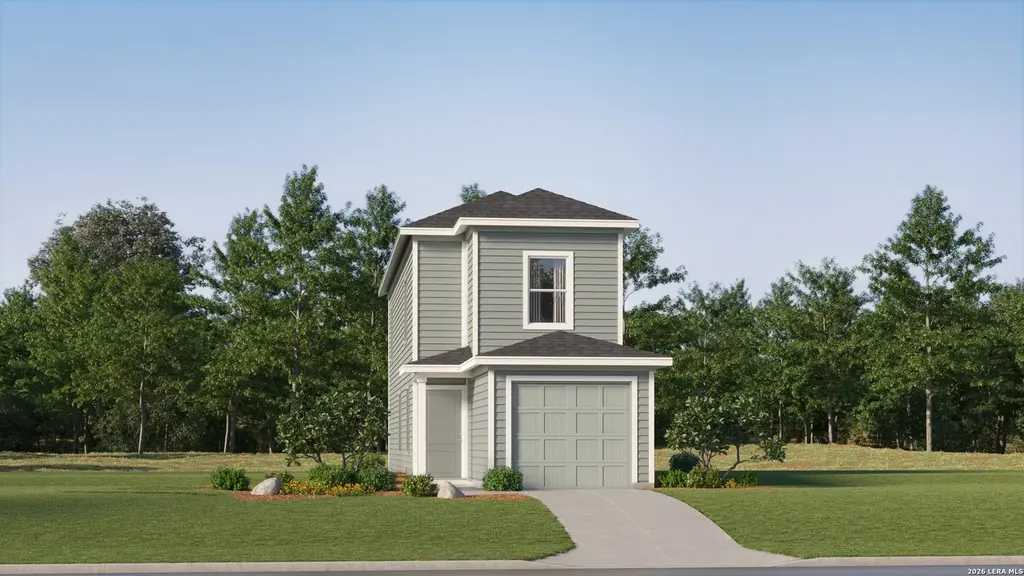
The Pima - The first floor of this two-story home is host to a spacious open floorplan that seamlessly connects an inviting family room, elegant dining room and chef-inspired kitchen. Upstairs, there are three bedrooms, including the luxe owner's suite, which features a restful bedroom, en-suite bathroom and generous walk-in closet. Estimated Completion July 2026. The completion date, prices and features may vary and are subject to change. Please verify with Lennar directly. Photos are for illustrative purposes only.
Key facts
- En suite bathroom
- Open floorplan
- Walk in closet
Tags
Property features AI
Finance
- Financial info: Down payment assistance resources available
- HOA & community: Mandatory HOA; Quarterly HOA fee; HOA fee $270 quarterly; Association transfer fee $450
Exterior
- Parking: 1-car garage
- Utilities: Water and sewer service (SAWS); Gas supplied by Unigas; Electricity supplied by CPC; Garbage service by Frontier
- Home design: New construction by Lennar; Entry level information not provided
- Construction: Slab foundation; Composition roof
- Exterior features: Siding exterior; Cement fiber exterior; Community pool; Park/playground; Jogging trails
Interior
- Kitchen: Stove/Range; Dishwasher; Kitchen approx. 14 x 9; Breakfast bar
- Bedrooms: Master bedroom on upper level with walk-in closet and full bath; Bedroom 2 (10 x 9); Bedroom 3 (10 x 9); Master bedroom (14 x 11)
- Flooring: Carpeting; Vinyl flooring
- Bathrooms: 2 full bathrooms; 1 half bathroom; Master bath with shower only and single vanity
- Heating & cooling: Central heating; Electric and natural gas heat; Central air conditioning
- Interior features: Open floor plan; Breakfast bar; Utility room inside; Laundry room; Laundry hookups on upper level; All bedrooms on upper level; Walk-in closets; 1 living area
- Laundry & utility: Washer connection; Dryer connection; Laundry located on upper level
Neighborhood map
What this means for you Summary
Snapshot
- This is a 3-bed/2.5-bath single-family listed at $199k. Condition is rated excellent.
Deal economics
- At list price, monthly cash flow is $-61 ($-734/yr) — negative.
- To cash-flow at today's rent, offer at most $190k (4.4% below list).
- To meet the 1% rule (rent ≥ 1% of price), the offer needs to be $178k (10.7% below list).
- Recommended offer: $178k (10.7% below list) — sets the bar for 1% rule.
- Cap rate 5.9% vs local median 3.8% in San Antonio — top-decile yield for the area; either an underpriced asset or a hidden risk that comps aren't pricing in. Stress-test before assuming the spread holds.
Location & tenants
- Location reads 80/100 on livability (#31 in TX, #1,616 nationally) — a professional / high-income tenant draw. Strengths: amenities A+, commute A+, cost of living A+; Watch: crime F.
- Medina Valley ISD (rural): math 48% / reading 53% proficiency, ranked #148 of 826 in TX (top 18%) — acceptable for families but not a draw, mixed tenant base, ~2y average lease.
- Zoned schools: Ladera El (756 students, 51% FRL); Medina Valley H S (math 34% / reading 55%, grade F, #652 of 1,632 statewide, top 43%, 2,147 students, 51% FRL) — zoned schools at 51% FRL track the district average.
- Market conditions: Rents falling (-3.0%/yr); 1133 active listings in the ZIP; 34 comparable units currently listed for rent nearby; rentals at typical pace (median 24d on market — plan ~3-4 weeks tenant-placement turnaround); solid renter incomes; 8,308 units permitted in Bexar County in 2024 (2,506 in 5+ unit buildings).
Forward outlook
- Local home prices are declining (-3.0%/yr); year-one equity from $1k of loan paydown is wiped out by about $6k of value loss. Plan a longer hold.
- Bexar County population projected at +50% by 2050 — long-run rental-demand tailwind backs the buy-and-hold thesis.
Negotiation context
- It's been on market 55 days — a 3% lower offer ($193k) is reasonable based on typical stale-listing flexibility.
Questions for the listing agent
- What do current leases actually rent for vs. the listed asking? Can we see a recent rent roll and the last 12 months of T-12 income?
- It's been on market 55 days. Have you received any prior offers? Is the seller open to a 11% concession, seller financing, or rate buy-down credit?
- What does the HOA fee cover, when was the last increase, and are there any pending special assessments or reserve-fund shortfalls?
- Is there a deadline driving the sale (1031 exchange, divorce, estate, relocation)? That informs how much negotiation room exists.
- Crime grade is F in this area — have there been break-ins, vandalism, or insurance claims at this property in the last 3 years? What carrier currently insures it and at what premium?
- The area grade is low — what's the realistic commute time and amenity access for the typical tenant pool here? Any planned neighborhood developments (good or bad) we should know about?
- What's the average days-on-market for RENTAL listings here right now (not sales)? A rising rental-DOM trend means longer vacancies and softer asking-rent achievability than the comps imply.
- What's the recent tenant-quality profile in this submarket — average credit score on applications, eviction rate, late-payment / NSF rate, and stable-employment percentage? A property-management company in the area should have these aggregated.
- How much new for-sale + rental construction is in the pipeline within 1–3 miles? Heavy new supply typically softens prices + rents 12–24 months out; constrained supply supports both.
Investment metrics
- 1% rule
- 0.89% ✗
- Cap rate
- 5.92%
- Cash-on-cash
- -1.32%
- DSCR
- 0.94
- GRM
- 9.3
CMA / ARV
- ARV (on-the-fly)
- $238,000
- Comps found
- 12
Show comp detail 12 sales within ~0.75 mi
| Address | Dist | Beds/Ba | Sqft | Sold | Price | $/sf | Match |
|---|---|---|---|---|---|---|---|
| 12402 Winding Oak Rdg | 0.30mi | 3/2.0 | 1,354 (-0%) | 1mo | $210,999 | $156 | 83 |
| 11815 Deloache Vale | 0.20mi | 3/2.0 | 1,442 (+6%) | 9mo | $324,000 | $225 | 71 |
| 3407 Angus Xing | 0.35mi | 3/2.0 | 1,299 (-4%) | 4mo | $215,000 | $166 | 70 |
| 12125 La Cuchilla | 0.20mi | 4/2.5 (+1) | 1,535 (+13%) | 2mo | $208,999 | $136 | 63 |
| 12137 La Cuchilla | 0.20mi | 4/2.5 (+1) | 1,535 (+13%) | 2mo | $209,999 | $137 | 63 |
| 5734 Bailey Downs | 0.20mi | 4/2.0 (+1) | 1,489 (+10%) | 10mo | $261,170 | $175 | 60 |
| 3446 Angus Xing | 0.36mi | 3/2.0 | 1,540 (+13%) | 8mo | $259,999 | $169 | 52 |
| 11818 Wentwood Vale | 0.70mi | 3/2.0 | 1,280 (-6%) | 6mo | $272,950 | $213 | 51 |
| 3227 Onion Crk | 0.51mi | 3/2.0 | 1,540 (+13%) | 2mo | $169,900 | $110 | 50 |
| 3027 Haynie Mesa | 0.69mi | 3/2.0 | 1,489 (+10%) | 3mo | $298,950 | $201 | 48 |
| 3219 Davis Trce | 0.73mi | 3/2.0 | 1,535 (+13%) | 3mo | $295,950 | $193 | 40 |
| 3019 Haynie Mesa | 0.70mi | 3/2.0 | 1,535 (+13%) | 6mo | $295,950 | $193 | 39 |
Match score weights: distance 35% · size 25% · config 20% · recency 20%. Top-matched comps best support the ARV.
Projected returns pro-forma
-3.0% appreciation · 0.0% rent growth · sell at horizon
- IRR
- -22.1%
- Equity multiple
- 0.26×
- Total profit
- $-41,268
- Equity at exit
- $29,671
- IRR
- -26.7%
- Equity multiple
- -0.09×
- Total profit
- $-60,746
- Equity at exit
- $17,206
Cash invested: $55,720 (down + closing). Projections, not guarantees.
Landlord ↔ Tenant lean methodology
- Overall (STATE)
- 87 Strongly Landlord-Friendly
- State Texas
- 87 Strongly Landlord-Friendly · R+5
- County
- — inherits STATE
- City
- — inherits STATE
ZIP-level market 78245
- Home prices YoY
- -18.5%
- Rents YoY
- -3.0%
- Active inventory
- 1133
- Price-to-rent
- 9.3×
Monthly cashflow live
- Estimated rent
- $1,777 high interval (Pro) →
- Mortgage (P&I)
- −$1,044
- Tax est. 1.5%
- −$249 /mo · $2,985/yr
- Insurance
- −$83
- HOA
- −$90
- Vacancy / Maint / Mgmt
- −$373
- Net cashflow
- $-61
Break-even live
UW: 25.0% down · 7.5% · 30yr · 1.5% tax · 5.0% vac · 8.0% maint · 8.0% mgmt
Financing live
Cash to close
- Down payment
- $49,750
- Closing costs
- $5,970
- Reserves months
- —
- Total cash needed
- —
Loan-product check · same deal, 3 products live
Conventional
25% down · 7.5% · 30yr
- Down + closing
- —
- Monthly P&I
- —
- Monthly cashflow
- —
- DSCR
- —
- Eligible?
- —
Personal DTI + credit; lowest rate.
DSCR
20% down · 8.5% · 30yr
- Down + closing
- —
- Monthly P&I
- —
- Monthly cashflow
- —
- DSCR
- —
- Eligible?
- —
No personal income docs; deal must DSCR.
Hard money
10% down · 12.0% · 12mo
- Down + closing
- —
- Monthly P&I
- —
- Monthly cashflow
- —
- DSCR
- —
- Eligible?
- —
Short-term bridge; refi at stabilization.
Rent comps 34 comps
| Address | Beds | Baths | Sqft | Rent | $/sqft | DOM | Units | Dist |
|---|---|---|---|---|---|---|---|---|
| 12141 Pease Riv San Antonio, TX | 3.0 | 2.0 | 1396 | $1,595 | $1.14 | 3d | 1 | 0.26mi |
| 12126 Sampson Crk San Antonio, TX | 3.0 | 2.0 | 1489 | $1,895 | $1.27 | 23d | 1 | 0.29mi |
| 12118 Pease Riv San Antonio, TX | 3.0 | 2.0 | 1540 | $1,850 | $1.20 | 12d | 1 | 0.29mi |
| 12010 Mulberry Crk Unit NA San Antonio, TX | 3.0 | 2.0 | 1296 | $1,850 | $1.43 | 14d | 1 | 0.45mi |
| 11902 Mulberry Crk San Antonio, TX | 3.0 | 2.0 | 1413 | $1,647 | $1.17 | 43d | 1 | 0.52mi |
| 3232 Onion Crk San Antonio, TX | 3.0 | 2.0 | 1168 | $1,495 | $1.28 | 43d | 1 | 0.55mi |
| 3303 Mission Riv San Antonio, TX | 3.0 | 2.0 | 1489 | $1,850 | $1.24 | 43d | 1 | 0.57mi |
| 3127 Keuka Park Dr San Antonio, TX | 3.0 | 2.5 | 1698 | $1,950 | $1.15 | 23d | 1 | 0.60mi |
| 3111 Lamoka Lk San Antonio, TX | 3.0 | 2.5 | 1509 | $1,600 | $1.06 | 43d | 1 | 0.67mi |
| 3111 Lamoka Lk San Antonio, TX | 3.0 | 3.0 | 1508 | $1,600 | $1.06 | 1d | 1 | 0.67mi |
| 4615 Serpens San Antonio, TX | 3.0 | 2.5 | 1747 | $1,800 | $1.03 | 23d | 1 | 0.80mi |
| 2840 Tengyc Bow San Antonio, TX | 4.0 | 2.0 | 1704 | $1,775 | $1.04 | 44d | 1 | 0.86mi |
| 12627 Corona Borealis San Antonio, TX | 3.0 | 2.0 | 1408 | $1,680 | $1.19 | 43d | 1 | 0.91mi |
| 12510 Galatea San Antonio, TX | 3.0 | 2.0 | 1212 | $1,575 | $1.30 | 17d | 1 | 0.92mi |
| 5010 Jovian San Antonio, TX | 3.0 | 2.0 | 1536 | $2,100 | $1.37 | 4d | 1 | 0.92mi |
| 12515 Antilia San Antonio, TX | 3.0 | 2.0 | 1405 | $1,800 | $1.28 | 10d | 1 | 0.95mi |
| 13078 Cygnus San Antonio, TX | 4.0 | 1.0–3.0 | 1656 | $1,911 | $1.15 | 1d | 8 | 0.98mi |
| 14618 Fowler Rdg San Antonio, TX | 3.0 | 2.0 | 1266 | $1,776 | $1.40 | 14d | 1 | 0.98mi |
| 11727 Black Rose San Antonio, TX | 3.0 | 2.0 | 1316 | $1,650 | $1.25 | 43d | 1 | 1.03mi |
| 11806 Red Pheasant San Antonio, TX | 3.0 | 2.0 | 1252 | $1,550 | $1.24 | 4d | 1 | 1.03mi |
| 3011 Lindenwood Way San Antonio, TX | 3.0 | 2.5 | 1700 | $1,955 | $1.15 | 23d | 1 | 1.04mi |
| 11752 Red Pheasant San Antonio, TX | 3.0 | 2.0 | 1246 | $1,595 | $1.28 | 23d | 1 | 1.05mi |
| 12530 Larissa San Antonio, TX | 3.0 | 2.0 | 1661 | $2,300 | $1.38 | 23d | 1 | 1.06mi |
| 11732 Red Pheasant San Antonio, TX | 3.0 | 2.5 | 1780 | $1,795 | $1.01 | 23d | 1 | 1.08mi |
| 11735 Midnight Rain San Antonio, TX | 4.0 | 2.0 | 1417 | $1,595 | $1.13 | 20d | 1 | 1.10mi |
| 2917 Wentwood Run San Antonio, TX | 4.0 | 2.0 | 1650 | $1,825 | $1.11 | 16d | 1 | 1.13mi |
| 11348 Top Hat San Antonio, TX | 3.0 | 2.0 | 1658 | $1,775 | $1.07 | 43d | 1 | 1.22mi |
| 11620 Midnight Rain San Antonio, TX | 3.0 | 2.5 | 1780 | $1,795 | $1.01 | 21d | 1 | 1.22mi |
| 11620 Midnight Rain San Antonio, TX | 3.0 | 2.5 | 1780 | $1,850 | $1.04 | 43d | 1 | 1.22mi |
| 11328 Silver Rose San Antonio, TX | 3.0 | 2.0 | 1691 | $1,870 | $1.11 | 43d | 1 | 1.26mi |
| 11215 Aristides San Antonio, TX | 4.0 | 2.0 | 1520 | $1,925 | $1.27 | 4d | 1 | 1.36mi |
| 11323 Pink Star San Antonio, TX | 3.0 | 2.0 | 1695 | $1,700 | $1.00 | 4d | 1 | 1.44mi |
| 12136 U.S. 90 Unit 710 San Antonio, TX | 2.0 | 2.0 | 967 | $1,658 | $1.71 | 3d | 1 | 1.49mi |
| 5565 Mansions Blfs San Antonio, TX | 1.0–4.0 | 1.0–3.0 | 1326 | $1,901 | $1.43 | 1d | 33 | 1.49mi |
HOA detail
- Monthly dues
- $90 · $1,080/yr
Listing history 14 events
-
2026-06-18days on market $198,999 Active 55 DOM
-
2026-06-17days on market $198,999 Active 54 DOM
-
2026-06-16days on market $198,999 Active 53 DOM
-
2026-06-15days on market $198,999 Active 52 DOM
-
2026-06-13days on market $198,999 Active 50 DOM
-
2026-06-09days on market $198,999 Active 46 DOM
-
2026-06-08days on market $198,999 Active 45 DOM
-
2026-06-07days on market $198,999 Active 44 DOM
-
2026-06-04days on market $198,999 Active 41 DOM
-
2026-06-03days on market $198,999 Active 40 DOM
-
2026-06-02days on market $198,999 Active 39 DOM
-
2026-06-01days on market $198,999 Active 38 DOM
-
2026-05-31remarks 522-char remark
-
2026-05-31$198,999 Active 37 DOM
ⓘ Source: listings_history table (triggers on properties + properties_extension) + one-shot
backfill from property_details.listing_events for pre-trigger history.
Nearby sold comps map
Loading sold comps map…
Walkable amenities ~0.75 mi
Loading nearby amenities…
Taxation est. · year 1
- Rental income
- $21,328
- − Mortgage interest
- −$11,147
- − Property taxes
- −$2,985
- − Insurance
- −$995
- − Repairs & maintenance
- −$1,706
- − Management
- −$1,706
- − HOA
- −$1,080
- − Depreciation
- −$5,789
- Taxable loss
- −$4,081
- Est. tax savings @ 24.0%
- +$979
- After-tax cash flow
- $246/yr
For passive investors: Depreciation is non-cash, so a rental often shows a tax loss while cash-flowing — sheltering income. Rental losses are passive: they offset passive income freely, and up to $25,000/yr can offset ordinary (W-2) income if you actively participate and your MAGI is under $100k (phasing out to $0 by $150k); unused losses carry forward. On sale, claimed depreciation is recaptured at up to 25%, and gains may owe capital-gains tax (a 1031 exchange can defer both). Figures are a year-1 estimate at your 24.0% rate — not tax advice; consult a CPA.
Condition & rehab AI · 12 photos
This two-story home is move-in ready with excellent condition and modern finishes. It offers a spacious open floorplan and three bedrooms, including a luxurious owner's suite. The home is set to be completed in July 2026 and is expected to be a great investment.
Value-add opportunities
- Both Painting the exterior and interior walls — Fresh paint can enhance curb appeal and interior aesthetics.
- Resale Updating the kitchen backsplash — A fresh backsplash can add value and appeal to potential buyers.
- Both Adding smart home features — Smart home features can increase both resale and rental value by making the home more convenient and energy-efficient.
Renovation cost estimate screening
Value-add ROI direction
- Both Painting the exterior and interior walls — Fresh paint can enhance curb appeal and interior aesthetics. ↑
- Resale Updating the kitchen backsplash — A fresh backsplash can add value and appeal to potential buyers. ↑
- Both Adding smart home features — Smart home features can increase both resale and rental value by making the home more convenient and energy-efficient. ↑
ⓘ Cost ranges are severity-bucket heuristics (US national rule-of-thumb). Get contractor quotes + a written scope before underwriting a rehab budget.
Schools (NCES district)
- District
- Medina Valley ISD
- NCES district ID
- 4830060
- Math proficiency
- 48% ▼ -9.00%
- Reading proficiency
- 53% ▼ -2.00%
- Median HH income
- $60,596
- Composite
- 44.2/100
- National rank
- #2851
- State rank
- #148 of 826 in TX
Livability — San Antonio
- Score
- 80/100
- State rank
- #31
- US rank
- #1616
Category grades
Schools grade is shown separately in the Schools card above.
Census & demographics
- County
- Bexar County · 1,990,555 people
- City population
- 1,806,925
- Metro
- San Antonio-New Braunfels, TX
- Population (ZIP)
- 96,015
- Household income
- $90,029
- Rent vs Own
- Severe rent burden
- 2466.0
Population outlook (Bexar County) Hauer SSP2
- Today (2025)
- 2,336,851 people
- By 2030
- 2,560,728 · +9.6%
- By 2040
- 3,020,569 · +29.3%
- By 2050
- 3,493,522 · +49.5%
- By 2075
- 4,668,459 · +99.8%
- By 2100
- 5,533,242 · +136.8%
Race, ethnicity, and origin ACS 2023
- Neighborhood character
- Majority Hispanic (64%)
- Race & ethnicity
- Hispanic / Latino 64% Two or more races 27% White 20% Black 9% Asian 2%
- Hispanic origin (detail)
- Mexican 53% Puerto Rican 2%
- Common ancestry
- Slovak 1% Lithuanian 1% Romanian 1%
- Foreign-born
- 9% · Canada, Vietnam
- Languages at home
- 66% English-only · Spanish 30% Arabic 1% Tagalog/Filipino 1%
Political lean MEDSL · Bexar
- 2024 margin
- Lean D (+9.8) · D 54.3% · R 44.6% · Other 1.1%
- 2008→2024 swing
- +4.2pp toward D · 2008: 5.6pp · 2024: 9.8pp
- All cycles
- 2024: D+9.8 2020: D+18.2 2016: D+13.5 2012: D+4.6 2008: D+5.6
Not yet ingested
- Civics
- —
Market trends
- HPI YoY
- ▼ -53.31%
- Current HPI
- 234.7931
- Rent YoY
- ▼ -3.02%
- Metro
- San Antonio-New Braunfels, TX
- State GDP YoY
- ▲ 3.95%
- F500 in state
- 110
Industry mix (Fortune 500 HQ in TX)
| Industry | F500 HQs | Revenue |
|---|---|---|
| Energy | 16 | $1,198B |
|
||
| Technology | 5 | $198B |
|
||
| Engineering / Construction | 4 | $72B |
|
||
| Energy Services | 3 | $60B |
|
||
| Utilities | 3 | $41B |
|
||
| Healthcare | 2 | $330B |
|
||
Price history
-0.5% since first listed2 events — show timeline
- 2026-04-30 Price Changed $198,999 LERA
- 2026-04-24 Listed $199,999 LERA
Cash-flow waterfall
monthlySold comps — $/sqft
last 12 mo · ≤1 miLoading sold comps…