1174 E Main St #148 · El Cajon, CA
Flood risk 4/10 · Minor
- FEMA flood zone
- X (unshaded)
- Chance of flooding over 30 yrs
- 0.22%
- Est. flood insurance / yr
- $507 – $1,088
Fire risk 1/10 · Minimal
- Est. fire insurance / yr
- $659 – $1,223
Heat risk 5/10 · Moderate
- Hot days now (above 99°F)
- 6 days/yr
- Hot days in 30 yrs
- 17 days/yr
Wind risk 1/10 · Minimal
- Chance of severe wind over 30 yrs
- —
Air-quality risk 4/10 · Minor
- Unhealthy air days now
- 6 days/yr
- Unhealthy air days in 30 yrs
- 7 days/yr
Risk factors via First Street. Map © Google.
Why this score? — see what drove the C+ grade
The composite is a weighted blend of 9 inputs, each scored 0–100. Each bar is that input's sub-score; the figure is the points it added to the 100-point composite (weight × sub-score).
- Cash flow +30.0/30.0
- 1% rule +10.0/10.0
- DSCR +10.0/10.0
- Schools +4.0/10.0
- Livability +3.5/5.0
- Rent growth +2.3/5.0
- Condition / age +2.2/5.0
- ARV discount +0.0/15.0
- Appreciation +0.0/10.0
$69,000
🖨 Deal sheet 📄 Offer letter ✓ Due diligence
Listing remarks MLS
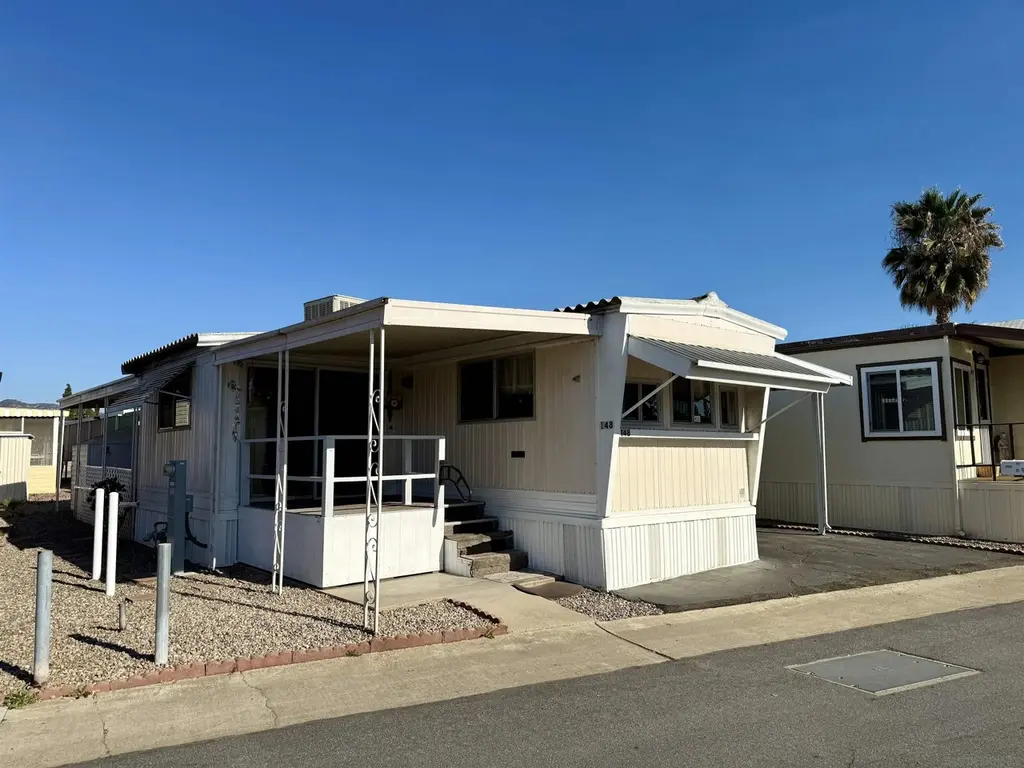
This is a fantastic opportunity to own a home in Safari Mobile Lodge. A gorgeous retirement community for 55 years and up. Beautiful park with many amenities like a large swimming pool and clubhouse. This 2 bedroom home features an awning on both sides of the home. Covered porch. Covered parking. 2 sheds on the property. Access through the back part of the home and front porch. Decorative gravel rock and stepping stone landscaping.
Key facts
- Covered porch
- Clubhouse
- Covered parking
Tags
Property features AI
Finance
- HOA & community: Located in the Safari community (El Cajon subdivision)
Exterior
- Parking: Tandem 2-car garage (2 parking spaces total)
- Utilities: Connected to sewer
- Home design: Manufactured home; Single-story
- Construction: Metal roof
- Exterior features: Partial fencing; Community pool
Interior
- Kitchen: Gas cooktop
- Bedrooms: Space for 2 bedrooms
- Bathrooms: 1 full bathroom
- Heating & cooling: Electric heating; Evaporative cooling
- Interior features: Gas cooktop
Neighborhood map
What this means for you Summary
Snapshot
- This is a 2-bed/1.0-bath manufactured listed at $69k. Condition is rated fair.
Deal economics
- At list price, monthly cash flow is $1k ($13k/yr) — positive.
- The deal already cash-flows at list — no discount required.
- Meets the 1% rule at list price ($2k rent vs $69k).
- Recommended offer: $67k (3.0% below list) — sets the bar for market timing.
- Cap rate 25.3% vs local median 2.4% in El Cajon — top-decile yield for the area; either an underpriced asset or a hidden risk that comps aren't pricing in. Stress-test before assuming the spread holds.
Location & tenants
- Location reads 70/100 on livability (#230 in CA) — a middle-class / working-renter tenant base. Strengths: amenities A+, commute A+; Watch: health & safety C-, crime D+, cost of living F.
- Grossmont Union High (suburban): math 31% / reading 60% proficiency, ranked #173 of 517 in CA (top 34%) — families likely to look elsewhere, expect single-tenant / working-renter base with shorter leases; only 17% free/reduced lunch — higher-income household profile.
- Market conditions: Rents soft (-0.8%/yr); 238 active listings in the ZIP; 40 comparable units currently listed for rent nearby; rentals leasing fast (median 2d on market — plan ~1-2 weeks tenant-placement turnaround); 11,759 units permitted in San Diego County in 2024 (7,244 in 5+ unit buildings).
- This rent runs 32% of the median local income ($74k/yr) — at the standard rent-burdened threshold; future hikes will face affordability resistance.
Forward outlook
- Local home prices are declining (-3.0%/yr); year-one equity from $477 of loan paydown is wiped out by about $2k of value loss. Plan a longer hold.
- San Diego County population projected at +20% by 2050 — long-run rental-demand tailwind backs the buy-and-hold thesis.
- At projected returns (-3.0% appreciation + 0.0% rent growth), your $19k cash investment doubles in ~2 years — after that, you're playing with house money.
Negotiation context
- It's been on market 47 days — a 3% lower offer ($67k) is reasonable based on typical stale-listing flexibility.
- 4 sale attempts since 2y ago; this cycle's ask has dropped $4k (5%) from the opening price — seller is motivated, your offer sets the floor, not the list.
- Current owner paid $42k; list at $69k implies a 64% gain — meaningful room to come down on a strong offer.
Risks & watch-outs
- Climate carrying-cost: extreme-heat days projected 6→17/yr by 2055 (HVAC capex compounding) — expect insurance premiums to compound above CPI over the hold.
Questions for the listing agent
- It's been on market 47 days. Have you received any prior offers? Is the seller open to a 3% concession, seller financing, or rate buy-down credit?
- Have any recent inspections been done? Can we get a copy of the seller's disclosures and any deferred-maintenance estimates?
- Built in 1963 — when were the roof, HVAC, electrical panel, plumbing, and water heater last replaced?
- Is there a deadline driving the sale (1031 exchange, divorce, estate, relocation)? That informs how much negotiation room exists.
- Crime grade is D in this area — have there been break-ins, vandalism, or insurance claims at this property in the last 3 years? What carrier currently insures it and at what premium?
- What's the average days-on-market for RENTAL listings here right now (not sales)? A rising rental-DOM trend means longer vacancies and softer asking-rent achievability than the comps imply.
- What's the recent tenant-quality profile in this submarket — average credit score on applications, eviction rate, late-payment / NSF rate, and stable-employment percentage? A property-management company in the area should have these aggregated.
- How much new for-sale + rental construction is in the pipeline within 1–3 miles? Heavy new supply typically softens prices + rents 12–24 months out; constrained supply supports both.
Investment metrics
- 1% rule
- 2.88% ✓
- Cap rate
- 25.32%
- Cash-on-cash
- 67.95%
- DSCR
- 4.02
- GRM
- 2.9
CMA / ARV
- ARV (on-the-fly)
- $58,850
- Comps found
- 8
Show comp detail 8 sales within ~0.75 mi
| Address | Dist | Beds/Ba | Sqft | Sold | Price | $/sf | Match |
|---|---|---|---|---|---|---|---|
| 1174 E Main St Spc 7 | 0.05mi | 2/1.5 | 540 (-2%) | 14mo | $49,000 | $91 | 81 |
| 1174 E Main St Spc 151 | 0.05mi | 2/1.0 | 576 (+5%) | 14mo | $60,000 | $104 | 78 |
| 187 Ballard St #115 | 0.20mi | 2/1.0 | 562 (+2%) | 14mo | $85,000 | $151 | 75 |
| 410 S 1st St Spc 142 | 0.61mi | 1/1.0 (-1) | 550 (0%) | 13mo | $52,000 | $95 | 56 |
| 1425 E Madison Ave Spc 57 | 0.68mi | 1/1.0 (-1) | 560 (+2%) | 12mo | $60,000 | $107 | 50 |
| 1425 E Madison Ave #16 | 0.71mi | 1/1.0 (-1) | 540 (-2%) | 13mo | $65,000 | $120 | 48 |
| 150 S Anza St #41 | 0.48mi | 2/1.0 | 600 (+9%) | 20mo | $35,000 | $58 | 46 |
| 1425 E Madison Ave #29 | 0.68mi | 1/1.0 (-1) | 480 (-13%) | 10mo | $60,000 | $125 | 33 |
Match score weights: distance 35% · size 25% · config 20% · recency 20%. Top-matched comps best support the ARV.
Projected returns pro-forma
-3.0% appreciation · 0.0% rent growth · sell at horizon
- IRR
- 63.9%
- Equity multiple
- 3.73×
- Total profit
- $52,698
- Equity at exit
- $10,288
- IRR
- 67.4%
- Equity multiple
- 6.86×
- Total profit
- $113,209
- Equity at exit
- $5,966
Cash invested: $19,320 (down + closing). Projections, not guarantees.
Landlord ↔ Tenant lean methodology
- Overall (STATE)
- 18 Strongly Tenant-Friendly
- State California
- 18 Strongly Tenant-Friendly · D+13
- County
- — inherits STATE
- City
- — inherits STATE
ZIP-level market 92021
- Rents YoY
- -0.8%
- Active inventory
- 238
- Price-to-rent
- 2.9×
Monthly cashflow live
- Estimated rent
- $1,988 high interval (Pro) →
- Mortgage (P&I)
- −$362
- Tax est. 1.5%
- −$86 /mo · $1,035/yr
- Insurance
- −$29
- HOA
- −$0
- Vacancy / Maint / Mgmt
- −$418
- Net cashflow
- $1,094
Break-even live
UW: 25.0% down · 7.5% · 30yr · 1.5% tax · 5.0% vac · 8.0% maint · 8.0% mgmt
Financing live
Cash to close
- Down payment
- $17,250
- Closing costs
- $2,070
- Reserves months
- —
- Total cash needed
- —
Loan-product check · same deal, 3 products live
Conventional
25% down · 7.5% · 30yr
- Down + closing
- —
- Monthly P&I
- —
- Monthly cashflow
- —
- DSCR
- —
- Eligible?
- —
Personal DTI + credit; lowest rate.
DSCR
20% down · 8.5% · 30yr
- Down + closing
- —
- Monthly P&I
- —
- Monthly cashflow
- —
- DSCR
- —
- Eligible?
- —
No personal income docs; deal must DSCR.
Hard money
10% down · 12.0% · 12mo
- Down + closing
- —
- Monthly P&I
- —
- Monthly cashflow
- —
- DSCR
- —
- Eligible?
- —
Short-term bridge; refi at stabilization.
Rent comps 40 comps
| Address | Beds | Baths | Sqft | Rent | $/sqft | DOM | Units | Dist |
|---|---|---|---|---|---|---|---|---|
| 368 Orlando St #21 El Cajon, CA | 1.0 | 1.0 | 692 | $1,850 | $2.67 | 10d | 1 | 0.14mi |
| 368 Orlando St El Cajon, CA | 1.0 | 1.0 | 692 | $1,850 | $2.67 | 2d | 1 | 0.14mi |
| 359 N 1st St Apt 8 El Cajon, CA | 1.0 | 1.0 | 500 | $1,575 | $3.15 | 2d | 1 | 0.18mi |
| 180 N 1st St El Cajon, CA | 1.0–2.0 | 1.0–2.0 | 830 | $2,125 | $2.56 | 2d | 3 | 0.20mi |
| 360 N 1st St El Cajon, CA | 2.0 | 2.0 | 725 | $1,995 | $2.75 | 16d | 1 | 0.22mi |
| 233 Shady Ln El Cajon, CA | 1.0 | 1.0 | 650 | $1,795 | $2.76 | 2d | 1 | 0.25mi |
| 187 Ballard St El Cajon, CA | 1.0–2.0 | 1.0–2.0 | 542 | $2,150 | $3.97 | 2d | 2 | 0.25mi |
| 301 Shady Ln El Cajon, CA | 1.0–2.0 | 1.0 | 720 | $2,250 | $3.12 | 2d | 8 | 0.27mi |
| 422 Shady Ln El Cajon, CA | 1.0–3.0 | 1.0–2.0 | 900 | $2,304 | $2.56 | 2d | 18 | 0.28mi |
| 541 N 1st St Apt 14 El Cajon, CA | 1.0 | 1.0 | 550 | $1,550 | $2.82 | 2d | 1 | 0.31mi |
| 421 Shady Ln El Cajon, CA | 1.0 | 1.0 | 575 | $1,708 | $2.97 | 2d | 3 | 0.31mi |
| 1018 E Lexington Ave El Cajon, CA | 1.0 | 1.0 | 670 | $1,800 | $2.69 | 2d | 1 | 0.40mi |
| 1037 E Lexington Ave El Cajon, CA | 1.0–3.0 | 1.0–2.0 | 855 | $2,225 | $2.60 | 2d | 5 | 0.40mi |
| 1041-89 E Lexington Ave El Cajon, CA | 1.0–2.0 | 1.0–2.0 | 838 | $2,425 | $2.89 | 2d | 8 | 0.40mi |
| 233 N Mollison Ave El Cajon, CA | 1.0–2.0 | 1.0–2.0 | 843 | $2,202 | $2.61 | 2d | 10 | 0.47mi |
| 291 Jamacha Rd El Cajon, CA | 1.0–2.0 | 1.0 | 825 | $2,095 | $2.54 | 2d | 4 | 0.53mi |
| 917 E Madison Ave El Cajon, CA | 2.0 | 1.0 | 750 | $2,195 | $2.93 | 2d | 1 | 0.54mi |
| 545 N Mollison Ave El Cajon, CA | 2.0 | 1.0 | 700 | $2,028 | $2.90 | 2d | 11 | 0.55mi |
| 545 N Mollison Ave El Cajon, CA | 2.0 | 1.0 | 700 | $2,000 | $2.86 | 8d | 9 | 0.55mi |
| 280 N Mollison Ave El Cajon, CA | 1.0–2.0 | 1.0 | 825 | $2,195 | $2.66 | 2d | 1 | 0.56mi |
| 1343 Oakdale Ave El Cajon, CA | 1.0–2.0 | 1.0–2.0 | 800 | $2,195 | $2.74 | 2d | 1 | 0.57mi |
| 150 S Mollison Ave El Cajon, CA | 1.0 | 1.0 | 515 | $1,800 | $3.50 | 2d | 1 | 0.58mi |
| 1382 Ivory Ct Unit 1382B El Cajon, CA | 1.0 | 1.0 | 550 | $1,625 | $2.95 | 2d | 1 | 0.58mi |
| 279 S Mollison Ave El Cajon, CA | 1.0 | 1.0 | 570 | $1,950 | $3.42 | 2d | 1 | 0.59mi |
| 1360 E Madison Ave El Cajon, CA | 1.0–2.0 | 1.0 | 550 | $2,595 | $4.72 | 2d | 22 | 0.59mi |
| 421 S Mollison Ave El Cajon, CA | 1.0–2.0 | 1.0 | 726 | $1,900 | $2.62 | 2d | 2 | 0.61mi |
| 588 S Anza St El Cajon, CA | 1.0–2.0 | 1.0 | 767 | $2,100 | $2.74 | 2d | 6 | 0.61mi |
| 390 S Mollison Ave El Cajon, CA | 1.0 | 1.0 | 750 | $1,725 | $2.30 | 2d | 1 | 0.65mi |
| 523 Grape St El Cajon, CA | 1.0 | 1.0 | 648 | $1,695 | $2.62 | 2d | 2 | 0.68mi |
| 1037 Peach Ave El Cajon, CA | 1.0 | 1.0 | 560 | $1,694 | $3.03 | 2d | 4 | 0.69mi |
| 1019 Peach Ave El Cajon, CA | 1.0–2.0 | 1.0–2.0 | 700 | $2,161 | $3.09 | 2d | 8 | 0.71mi |
| 633 E Park Ave El Cajon, CA | 1.0 | 1.0 | 650 | $1,675 | $2.58 | 11d | 1 | 0.73mi |
| 633 E Park Ave Unit 12 El Cajon, CA | 1.0 | 1.0 | 650 | $1,675 | $2.58 | 17d | 1 | 0.73mi |
| 989 Peach Ave El Cajon, CA | 1.0–3.0 | 1.0–2.0 | 845 | $2,150 | $2.54 | 2d | 11 | 0.75mi |
| 798 McClure St Apt 7 El Cajon, CA | 1.0 | 1.0 | 570 | $1,595 | $2.80 | 2d | 1 | 0.75mi |
| 444 S Lincoln Ave El Cajon, CA | 2.0 | 1.0 | 748 | $2,000 | $2.67 | 24d | 1 | 0.81mi |
| 800 N Mollison Ave #48 El Cajon, CA | 1.0 | 1.0 | 460 | $1,575 | $3.42 | 2d | 1 | 0.81mi |
| 800 N Mollison Ave #48 El Cajon, CA | 1.0 | 1.0 | 460 | $1,875 | $4.08 | 22d | 1 | 0.81mi |
| 195 Ballantyne St Unit 8 El Cajon, CA | 1.0 | 1.0 | 500 | $1,650 | $3.30 | 8d | 1 | 0.84mi |
| 181 Ballantyne St Apt 12 El Cajon, CA | 2.0 | 1.0 | 583 | $2,067 | $3.55 | 5d | 1 | 0.85mi |
Listing history 28 events
-
2026-06-18days on market $69,000 Active 47 DOM
-
2026-06-17days on market $69,000 Active 46 DOM
-
2026-06-16days on market $69,000 Active 45 DOM
-
2026-06-15days on market $69,000 Active 44 DOM
-
2026-06-13days on market $69,000 Active 42 DOM
-
2026-06-13days on market $69,000 Active 41 DOM
-
2026-06-09days on market $69,000 Active 38 DOM
-
2026-06-08days on market $69,000 Active 37 DOM
-
2026-06-07days on market $69,000 Active 51 DOM
-
2026-06-04days on market $69,000 Active 48 DOM
-
2026-06-03days on market $69,000 Active 47 DOM
-
2026-06-02days on market $69,000 Active 46 DOM
-
2026-06-02price $69,000 Active 45 DOM
-
2026-06-01days on market $73,000 Active 45 DOM
-
2026-05-31days on market $73,000 Active 44 DOM
-
2026-04-17historical
-
2026-04-17$73,000 Active
-
2026-03-12$79,000 Active
-
2024-09-06soldstatus $42,000 Closed 435-char remark
Show marketing remark (435 chars)
This is a fantastic opportunity to own a home in Safari Mobile Lodge. A gorgeous retirement community for 55 years and up. Beautiful park with many amenities like a large swimming pool and clubhouse. This 2 bedroom home features an awning on both sides of the home. Covered porch. Covered parking. 2 sheds on the property. Access through the back part of the home and front porch. Decorative gravel rock and stepping stone landscaping.
-
2024-09-06soldstatus $42,000 Closed Sale
Show marketing remark (435 chars)
This is a fantastic opportunity to own a home in Safari Mobile Lodge. A gorgeous retirement community for 55 years and up. Beautiful park with many amenities like a large swimming pool and clubhouse. This 2 bedroom home features an awning on both sides of the home. Covered porch. Covered parking. 2 sheds on the property. Access through the back part of the home and front porch. Decorative gravel rock and stepping stone landscaping.
-
2024-08-07status Pending Sale
Show marketing remark (435 chars)
This is a fantastic opportunity to own a home in Safari Mobile Lodge. A gorgeous retirement community for 55 years and up. Beautiful park with many amenities like a large swimming pool and clubhouse. This 2 bedroom home features an awning on both sides of the home. Covered porch. Covered parking. 2 sheds on the property. Access through the back part of the home and front porch. Decorative gravel rock and stepping stone landscaping.
-
2024-08-07status Pending 435-char remark
Show marketing remark (435 chars)
This is a fantastic opportunity to own a home in Safari Mobile Lodge. A gorgeous retirement community for 55 years and up. Beautiful park with many amenities like a large swimming pool and clubhouse. This 2 bedroom home features an awning on both sides of the home. Covered porch. Covered parking. 2 sheds on the property. Access through the back part of the home and front porch. Decorative gravel rock and stepping stone landscaping.
-
2024-08-01price $48,500 435-char remark
Show marketing remark (435 chars)
This is a fantastic opportunity to own a home in Safari Mobile Lodge. A gorgeous retirement community for 55 years and up. Beautiful park with many amenities like a large swimming pool and clubhouse. This 2 bedroom home features an awning on both sides of the home. Covered porch. Covered parking. 2 sheds on the property. Access through the back part of the home and front porch. Decorative gravel rock and stepping stone landscaping.
-
2024-08-01price $48,500
Show marketing remark (435 chars)
This is a fantastic opportunity to own a home in Safari Mobile Lodge. A gorgeous retirement community for 55 years and up. Beautiful park with many amenities like a large swimming pool and clubhouse. This 2 bedroom home features an awning on both sides of the home. Covered porch. Covered parking. 2 sheds on the property. Access through the back part of the home and front porch. Decorative gravel rock and stepping stone landscaping.
-
2024-06-23price $60,000 435-char remark
Show marketing remark (435 chars)
This is a fantastic opportunity to own a home in Safari Mobile Lodge. A gorgeous retirement community for 55 years and up. Beautiful park with many amenities like a large swimming pool and clubhouse. This 2 bedroom home features an awning on both sides of the home. Covered porch. Covered parking. 2 sheds on the property. Access through the back part of the home and front porch. Decorative gravel rock and stepping stone landscaping.
-
2024-06-23price $60,000
Show marketing remark (435 chars)
This is a fantastic opportunity to own a home in Safari Mobile Lodge. A gorgeous retirement community for 55 years and up. Beautiful park with many amenities like a large swimming pool and clubhouse. This 2 bedroom home features an awning on both sides of the home. Covered porch. Covered parking. 2 sheds on the property. Access through the back part of the home and front porch. Decorative gravel rock and stepping stone landscaping.
-
2024-05-21$70,000 Active 435-char remark
Show marketing remark (435 chars)
This is a fantastic opportunity to own a home in Safari Mobile Lodge. A gorgeous retirement community for 55 years and up. Beautiful park with many amenities like a large swimming pool and clubhouse. This 2 bedroom home features an awning on both sides of the home. Covered porch. Covered parking. 2 sheds on the property. Access through the back part of the home and front porch. Decorative gravel rock and stepping stone landscaping.
-
2024-05-21$70,000 Active
Show marketing remark (435 chars)
This is a fantastic opportunity to own a home in Safari Mobile Lodge. A gorgeous retirement community for 55 years and up. Beautiful park with many amenities like a large swimming pool and clubhouse. This 2 bedroom home features an awning on both sides of the home. Covered porch. Covered parking. 2 sheds on the property. Access through the back part of the home and front porch. Decorative gravel rock and stepping stone landscaping.
ⓘ Source: listings_history table (triggers on properties + properties_extension) + one-shot
backfill from property_details.listing_events for pre-trigger history.
Climate risk First Street
- Flood 4/10 Moderate FEMA zone X (unshaded) · 22% chance over 30 yrs
- Wildfire 1/10 Low
- Heat 5/10 Major 6 d/yr ≥99°F today · 17 d/yr by 30 yrs out
- Wind 1/10 Low
- Air quality 4/10 Moderate 6 unhealthy d/yr today · 7 by 30 yrs out
Nearby sold comps map
Loading sold comps map…
Walkable amenities ~0.75 mi
Loading nearby amenities…
Taxation est. · year 1
- Rental income
- $23,861
- − Mortgage interest
- −$3,865
- − Property taxes
- −$1,035
- − Insurance
- −$345
- − Repairs & maintenance
- −$1,909
- − Management
- −$1,909
- − Depreciation
- −$2,007
- Taxable income
- $12,791
- Est. tax owed @ 24.0%
- −$3,070
- After-tax cash flow
- $10,058/yr
For passive investors: Depreciation is non-cash, so a rental often shows a tax loss while cash-flowing — sheltering income. Rental losses are passive: they offset passive income freely, and up to $25,000/yr can offset ordinary (W-2) income if you actively participate and your MAGI is under $100k (phasing out to $0 by $150k); unused losses carry forward. On sale, claimed depreciation is recaptured at up to 25%, and gains may owe capital-gains tax (a 1031 exchange can defer both). Figures are a year-1 estimate at your 24.0% rate — not tax advice; consult a CPA.
Condition & rehab AI · 12 photos
This manufactured home requires moderate repairs and updates to improve its condition and value. Key areas for improvement include the kitchen and bathroom, as well as exterior painting and landscaping.
Repairs flagged
- Major kitchen appliances — outdated and worn
- Major bathroom vanity — dated and worn
- Moderate exterior siding — weathered and peeling
- Moderate interior walls — light wear
- Minor HVAC system — basic, no visible damage
Value-add opportunities
- Resale new kitchen appliances — modernizes the space and appeals to buyers
- Resale new bathroom vanity — modernizes the space and appeals to buyers
- Both paint exterior — enhances curb appeal and value
- Both landscaping — enhances curb appeal and value
Renovation cost estimate screening
| Repair item | Severity | Est. cost |
|---|---|---|
| kitchen appliances · outdated and worn | Major | $15,000–50,000 |
| bathroom vanity · dated and worn | Major | $15,000–50,000 |
| exterior siding · weathered and peeling | Moderate | $3,000–15,000 |
| interior walls · light wear | Moderate | $3,000–15,000 |
| HVAC system · basic, no visible damage | Minor | $500–3,000 |
| Total estimated repair cost · 5 items | $36,500–133,000 |
Value-add ROI direction
- Resale new kitchen appliances — modernizes the space and appeals to buyers ↑
- Resale new bathroom vanity — modernizes the space and appeals to buyers ↑
- Both paint exterior — enhances curb appeal and value ↑
- Both landscaping — enhances curb appeal and value ↑
ⓘ Cost ranges are severity-bucket heuristics (US national rule-of-thumb). Get contractor quotes + a written scope before underwriting a rehab budget.
Schools (NCES district)
- District
- Grossmont Union High
- NCES district ID
- 0616230
- Math proficiency
- 31% ▼ -1.00%
- Reading proficiency
- 60% ▲ 5.00%
- Median HH income
- $61,801
- Composite
- 40.07/100
- National rank
- #3810
- State rank
- #173 of 517 in CA
Livability — El Cajon
- Score
- 70/100
- State rank
- #230
- US rank
- #7531
Category grades
Schools grade is shown separately in the Schools card above.
Census & demographics
- Census place
- El Cajon, CA
- County
- San Diego County · 3,178,799 people
- City population
- 173,694
- Metro
- San Diego-Chula Vista-Carlsbad, CA
- Population (ZIP)
- 70,501
- Household income
- $74,013
- Rent vs Own
- Severe rent burden
- 4178.0
Population outlook (San Diego County) Hauer SSP2
- Today (2025)
- 3,678,185 people
- By 2030
- 3,856,546 · +4.8%
- By 2040
- 4,171,407 · +13.4%
- By 2050
- 4,421,607 · +20.2%
- By 2075
- 4,831,599 · +31.4%
- By 2100
- 4,832,502 · +31.4%
Race, ethnicity, and origin ACS 2023
- Neighborhood character
- Diverse neighborhood (Simpson 0.62)
- Race & ethnicity
- White 54% Hispanic / Latino 28% Two or more races 14% Black 6% Asian 5% Native American 2%
- Hispanic origin (detail)
- Mexican 24%
- Common ancestry
- Arab 6% Italian 2% Lithuanian 2%
- Foreign-born
- 22% · Canada
- Languages at home
- 65% English-only · Spanish 18% Arabic 7% Other Indo-European 3%
Political lean MEDSL · San Diego
- 2024 margin
- D (+16.8) · D 56.9% · R 40.1% · Other 2.9%
- 2008→2024 swing
- +6.6pp toward D · 2008: 10.2pp · 2024: 16.8pp
- All cycles
- 2024: D+16.8 2020: D+22.8 2016: D+17.8 2012: D+5.1 2008: D+10.2
Not yet ingested
- Civics
- —
Market trends
- HPI YoY
- ▼ -654.88%
- Current HPI
- 335.0617
- Rent YoY
- ▼ -0.83%
- Metro
- San Diego-Chula Vista-Carlsbad, CA
- State GDP YoY
- ▲ 3.21%
- F500 in state
- 116
Industry mix (Fortune 500 HQ in CA)
| Industry | F500 HQs | Revenue |
|---|---|---|
| Technology | 27 | $1,492B |
|
||
| Financial Services | 3 | $174B |
|
||
| Retail | 3 | $44B |
|
||
| Insurance | 3 | $26B |
|
||
| Media / Entertainment | 2 | $115B |
|
||
| Pharmaceuticals / Biotech | 2 | $62B |
|
||
Price history
+4.3% since first listed13 events — show timeline
- 2026-04-17 Listed $73,000 SDMLS
- 2026-04-17 Listing Removed — SDMLS
- 2026-03-12 Listed $79,000 SDMLS
- 2024-09-06 Sold (MLS) $42,000 CRMLS
- 2024-09-06 Sold (MLS) $42,000 AVMLS
- 2024-08-07 Pending — CRMLS
- 2024-08-07 Pending — AVMLS
- 2024-08-01 Price Changed $48,500 AVMLS
- 2024-08-01 Price Changed $48,500 CRMLS
- 2024-06-23 Price Changed $60,000 AVMLS
- 2024-06-23 Price Changed $60,000 CRMLS
- 2024-05-21 Listed $70,000 CRMLS
- 2024-05-21 Listed $70,000 AVMLS
Cash-flow waterfall
monthlySold comps — $/sqft
last 12 mo · ≤1 miLoading sold comps…