 🏗️ New Construction
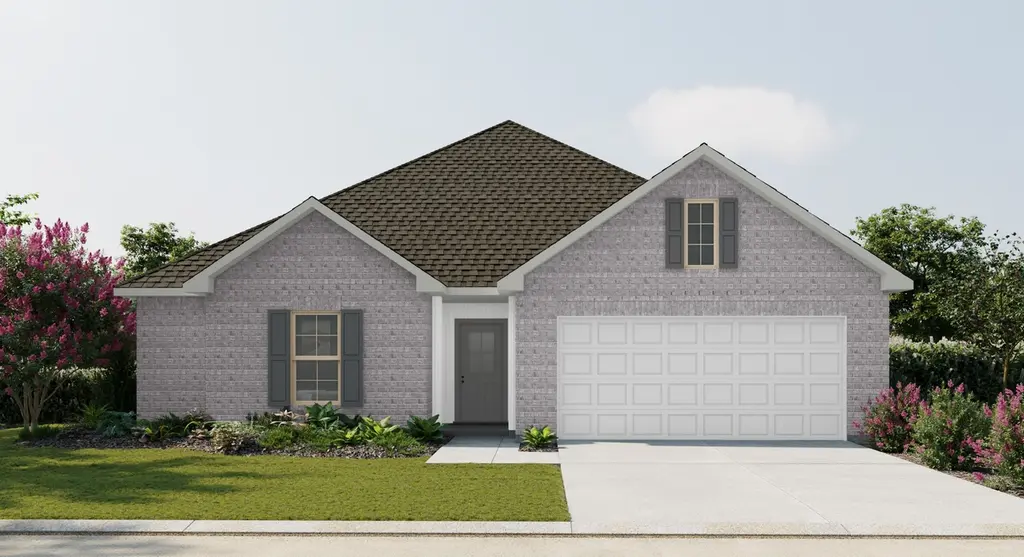
Hoffman IV G Plan · Maurice, LA
Flood risk No data
- FEMA flood zone
- —
- Chance of flooding over 30 yrs
- —
- Est. flood insurance / yr
- —
Fire risk No data
- Est. fire insurance / yr
- —
Heat risk No data
- Hot days now (above threshold)
- —
- Hot days in 30 yrs
- —
Wind risk No data
- Chance of severe wind over 30 yrs
- —
Air-quality risk No data
- Unhealthy air days now
- —
- Unhealthy air days in 30 yrs
- —
Risk factors via First Street. Map © Google.
Why this score? — see what drove the D- grade
The composite is a weighted blend of 9 inputs, each scored 0–100. Each bar is that input's sub-score; the figure is the points it added to the 100-point composite (weight × sub-score).
- Cash flow +12.1/30.0
- ARV discount +7.5/15.0
- Schools +3.9/10.0
- Livability +3.8/5.0
- DSCR +3.6/10.0
- 1% rule +3.5/10.0
- Rent growth +2.5/5.0
- Condition / age +1.0/5.0
- Appreciation +0.0/10.0
$227,990
🖨 Deal sheet 📄 Offer letter ✓ Due diligence
Listing remarks MLS
- Open Floor Plan - Three Bedrooms, Two Bathrooms - Brick & Vinyl Exterior - Recessed Can Lighting in Kitchen - Walk-In Master Closet - Two Car Garage - Covered Rear Patio
Key facts
- Open floor plan
- Brick vinyl exterior
- Covered rear patio
Tags
Neighborhood map
What this means for you Summary
Snapshot
- This is a 3-bed/2.0-bath single-family listed at $228k. Condition is rated poor.
Deal economics
- At list price, monthly cash flow is $-52 ($-622/yr) — negative.
- To cash-flow at today's rent, offer at most $223k (2.2% below list).
- To meet the 1% rule (rent ≥ 1% of price), the offer needs to be $195k (14.5% below list).
- Recommended offer: $195k (14.5% below list) — sets the bar for 1% rule.
Location & tenants
- Location reads 76/100 on livability (#15 in LA, #3,333 nationally) — a middle-class / working-renter tenant base. Strengths: crime A+, cost of living A+, housing A+; Watch: amenities F, commute F.
- Vermilion Parish (town): math 40% / reading 53% proficiency, ranked #15 of 98 in LA (top 15%) — families likely to look elsewhere, expect single-tenant / working-renter base with shorter leases.
- Market conditions: 248 active listings in the ZIP; 3 comparable units currently listed for rent nearby; rentals leasing fast (median 13d on market — plan ~1-2 weeks tenant-placement turnaround); solid renter incomes; 228 units permitted in Vermilion Parish in 2024 (0 in 5+ unit buildings).
- This rent runs 31% of the median local income ($76k/yr) — at the standard rent-burdened threshold; future hikes will face affordability resistance.
Forward outlook
- Local home prices are declining (-3.0%/yr); year-one equity from $2k of loan paydown is wiped out by about $7k of value loss. Plan a longer hold.
- Vermilion County population projected at +10% by 2050 — modest demand growth; plan on rents tracking national, not racing it.
Negotiation context
- It's been on market 64 days — a 6% lower offer ($214k) is reasonable based on typical stale-listing flexibility.
Questions for the listing agent
- What do current leases actually rent for vs. the listed asking? Can we see a recent rent roll and the last 12 months of T-12 income?
- It's been on market 64 days. Have you received any prior offers? Is the seller open to a 14% concession, seller financing, or rate buy-down credit?
- Have any recent inspections been done? Can we get a copy of the seller's disclosures and any deferred-maintenance estimates?
- Why hasn't it sold? Are there any deal-killer items the seller is aware of (foundation, flood, title, zoning, code violations)?
- Is there a deadline driving the sale (1031 exchange, divorce, estate, relocation)? That informs how much negotiation room exists.
- Schools are A-rated — typically a magnet for longer-tenancy family renters. What's the average tenant stay here, and is there a school-zone premium baked into asking?
- The area grade is low — what's the realistic commute time and amenity access for the typical tenant pool here? Any planned neighborhood developments (good or bad) we should know about?
- What's the average days-on-market for RENTAL listings here right now (not sales)? A rising rental-DOM trend means longer vacancies and softer asking-rent achievability than the comps imply.
- What's the recent tenant-quality profile in this submarket — average credit score on applications, eviction rate, late-payment / NSF rate, and stable-employment percentage? A property-management company in the area should have these aggregated.
- How much new for-sale + rental construction is in the pipeline within 1–3 miles? Heavy new supply typically softens prices + rents 12–24 months out; constrained supply supports both.
Investment metrics
- 1% rule
- 0.85% ✗
- Cap rate
- 6.02%
- Cash-on-cash
- -0.96%
- DSCR
- 0.96
- GRM
- 9.8
CMA / ARV
- ARV (median comp)
- $230,395
- List price
- $227,990
- Delta
- -1.04%
- Verdict
- FAIR
- Comps
- 20 within 1.0 mi
Show comp detail 12 sales within ~0.75 mi
| Address | Dist | Beds/Ba | Sqft | Sold | Price | $/sf | Match |
|---|---|---|---|---|---|---|---|
| 7399 Alley Oak Ln | 0.15mi | 3/2.0 | 1,490 (0%) | 4mo | $230,114 | $154 | 90 |
| 7392 Alley Oak Ln | 0.15mi | 3/2.0 | 1,498 (+0%) | 5mo | $230,835 | $154 | 88 |
| 3415 Autumn Park Dr | 0.00mi | 4/2.0 (+1) | 1,458 (-2%) | 5mo | $229,235 | $157 | 88 |
| 7386 Alley Oak Ln | 0.15mi | 3/2.0 | 1,422 (-5%) | 1mo | $219,385 | $154 | 84 |
| 7385 Alley Oak Ln | 0.15mi | 3/2.0 | 1,578 (+6%) | 0mo | $234,425 | $149 | 83 |
| 7393 Alley Oak Ln | 0.16mi | 3/2.0 | 1,394 (-6%) | 1mo | $216,521 | $155 | 81 |
| 7375 Alley Oak Ln | 0.15mi | 3/2.0 | 1,649 (+11%) | 1mo | $237,470 | $144 | 75 |
| 7403 Alley Oak Ln | 0.15mi | 3/2.0 | 1,649 (+11%) | 1mo | $246,132 | $149 | 75 |
| 7411 Alley Oak Ln | 0.15mi | 3/2.0 | 1,649 (+11%) | 1mo | $246,726 | $150 | 74 |
| 7389 Alley Oak Ln | 0.15mi | 3/2.0 | 1,649 (+11%) | 4mo | $238,080 | $144 | 72 |
| 7410 Seven Oaks Cir | 0.21mi | 3/2.0 | 1,649 (+11%) | 3mo | $245,000 | $149 | 70 |
| 3306 Myrtle St | 0.29mi | 3/2.0 | 1,363 (-8%) | 4mo | $215,152 | $158 | 69 |
Match score weights: distance 35% · size 25% · config 20% · recency 20%. Top-matched comps best support the ARV.
Projected returns pro-forma
-3.0% appreciation · 3.0% rent growth · sell at horizon
- IRR
- -17.9%
- Equity multiple
- 0.37×
- Total profit
- $-40,604
- Equity at exit
- $34,353
- IRR
- -10.0%
- Equity multiple
- 0.39×
- Total profit
- $-39,486
- Equity at exit
- $19,920
Cash invested: $64,511 (down + closing). Projections, not guarantees.
Landlord ↔ Tenant lean methodology
- Overall (STATE)
- 90 Strongly Landlord-Friendly
- State Louisiana
- 90 Strongly Landlord-Friendly · R+12
- County
- — inherits STATE
- City
- — inherits STATE
ZIP-level market 70555
- Home prices YoY
- -29.4%
- Active inventory
- 248
- Price-to-rent
- 9.7×
Monthly cashflow live
- Estimated rent
- $1,950 medium interval (Pro) →
- Mortgage (P&I)
- −$1,208
- Tax est. 1.5%
- −$288 /mo · $3,456/yr
- Insurance
- −$96
- HOA
- −$0
- Vacancy / Maint / Mgmt
- −$409
- Net cashflow
- $-52
Break-even live
UW: 25.0% down · 7.5% · 30yr · 1.5% tax · 5.0% vac · 8.0% maint · 8.0% mgmt
Financing live
Cash to close
- Down payment
- $57,599
- Closing costs
- $6,912
- Reserves months
- —
- Total cash needed
- —
Loan-product check · same deal, 3 products live
Conventional
25% down · 7.5% · 30yr
- Down + closing
- —
- Monthly P&I
- —
- Monthly cashflow
- —
- DSCR
- —
- Eligible?
- —
Personal DTI + credit; lowest rate.
DSCR
20% down · 8.5% · 30yr
- Down + closing
- —
- Monthly P&I
- —
- Monthly cashflow
- —
- DSCR
- —
- Eligible?
- —
No personal income docs; deal must DSCR.
Hard money
10% down · 12.0% · 12mo
- Down + closing
- —
- Monthly P&I
- —
- Monthly cashflow
- —
- DSCR
- —
- Eligible?
- —
Short-term bridge; refi at stabilization.
Rent comps 3 comps
| Address | Beds | Baths | Sqft | Rent | $/sqft | DOM | Units | Dist |
|---|---|---|---|---|---|---|---|---|
| 3504 Canebreak Mill Dr Maurice, LA | 3.0–4.0 | 2.0 | 1502 | $1,700 | $1.13 | 13d | 8 | 0.49mi |
| 8550 Cat Rd Unit B Maurice, LA | 3.0 | 2.0 | 1324 | $1,650 | $1.25 | 43d | 1 | 1.06mi |
| 222 Weaver Way Maurice, LA | 3.0 | 2.0 | 1538 | $1,850 | $1.20 | 13d | 1 | 1.49mi |
Listing history 16 events
-
2026-06-18days on market $227,990 Active 64 DOM
-
2026-06-17days on market $227,990 Active 63 DOM
-
2026-06-16days on market $227,990 Active 62 DOM
-
2026-06-15days on market $227,990 Active 61 DOM
-
2026-06-14days on market $227,990 Active 59 DOM
-
2026-06-13days on market $227,990 Active 58 DOM
-
2026-06-10days on market $227,990 Active 56 DOM
-
2026-06-09days on market $227,990 Active 55 DOM
-
2026-06-08days on market $227,990 Active 54 DOM
-
2026-06-07days on market $227,990 Active 53 DOM
-
2026-06-03days on market $227,990 Active 49 DOM
-
2026-06-02days on market $227,990 Active 48 DOM
-
2026-06-01days on market $227,990 Active 47 DOM
-
2026-05-31days on market $227,990 Active 46 DOM
-
2026-05-30days on market $227,990 Active 45 DOM
-
2026-04-16$227,990 Active 177-char remark
Show marketing remark (177 chars)
- Open Floor Plan - Three Bedrooms, Two Bathrooms - Brick & Vinyl Exterior - Recessed Can Lighting in Kitchen - Walk-In Master Closet - Two Car Garage - Covered Rear Patio
ⓘ Source: listings_history table (triggers on properties + properties_extension) + one-shot
backfill from property_details.listing_events for pre-trigger history.
Nearby sold comps map
Loading sold comps map…
Walkable amenities ~0.75 mi
Loading nearby amenities…
Taxation est. · year 1
- Rental income
- $23,399
- − Mortgage interest
- −$12,906
- − Property taxes
- −$3,456
- − Insurance
- −$1,152
- − Repairs & maintenance
- −$1,872
- − Management
- −$1,872
- − Depreciation
- −$6,702
- Taxable loss
- −$4,561
- Est. tax savings @ 24.0%
- +$1,095
- After-tax cash flow
- $473/yr
For passive investors: Depreciation is non-cash, so a rental often shows a tax loss while cash-flowing — sheltering income. Rental losses are passive: they offset passive income freely, and up to $25,000/yr can offset ordinary (W-2) income if you actively participate and your MAGI is under $100k (phasing out to $0 by $150k); unused losses carry forward. On sale, claimed depreciation is recaptured at up to 25%, and gains may owe capital-gains tax (a 1031 exchange can defer both). Figures are a year-1 estimate at your 24.0% rate — not tax advice; consult a CPA.
Condition & rehab AI · 3 photos
The property is in poor condition with extensive repairs and maintenance needed. Significant improvements are required to increase its resale and rental value.
Repairs flagged
- Major exterior siding — Significant wear and tear on the exterior siding.
- Major roof — Significant wear and tear on the roof.
- Major flooring — Significant wear and tear on the flooring.
- Major interior walls/paint — Significant wear and tear on the interior walls and paint.
- Major HVAC/mechanicals — No visible signs of HVAC/mechanical condition in the provided photos.
- Major landscaping — Overgrown grass and lack of maintenance.
- Major windows — Significant wear and tear on the windows.
Value-add opportunities
- Both exterior siding repair — Improves curb appeal and property value.
- Both roof repair — Improves property value and safety.
- Both flooring replacement — Improves property value and comfort.
- Both interior paint — Improves property value and comfort.
- Both HVAC system replacement — Improves property value and comfort.
- Both landscaping — Improves curb appeal and property value.
- Both window replacement — Improves property value and comfort.
Renovation cost estimate screening
| Repair item | Severity | Est. cost |
|---|---|---|
| exterior siding · Significant wear and tear on the exterior siding. | Major | $15,000–50,000 |
| roof · Significant wear and tear on the roof. | Major | $15,000–50,000 |
| flooring · Significant wear and tear on the flooring. | Major | $15,000–50,000 |
| interior walls/paint · Significant wear and tear on the interior walls and paint. | Major | $15,000–50,000 |
| HVAC/mechanicals · No visible signs of HVAC/mechanical condition in the provided photos. | Major | $15,000–50,000 |
| landscaping · Overgrown grass and lack of maintenance. | Major | $15,000–50,000 |
| windows · Significant wear and tear on the windows. | Major | $15,000–50,000 |
| Total estimated repair cost · 7 items | $105,000–350,000 |
Value-add ROI direction
- Both exterior siding repair — Improves curb appeal and property value. ↑
- Both roof repair — Improves property value and safety. ↑
- Both flooring replacement — Improves property value and comfort. ↑
- Both interior paint — Improves property value and comfort. ↑
- Both HVAC system replacement — Improves property value and comfort. ↑
- Both landscaping — Improves curb appeal and property value. ↑
- Both window replacement — Improves property value and comfort. ↑
ⓘ Cost ranges are severity-bucket heuristics (US national rule-of-thumb). Get contractor quotes + a written scope before underwriting a rehab budget.
Schools (NCES district)
- District
- Vermilion Parish
- NCES district ID
- 2201800
- Math proficiency
- 40% ▼ -38.00%
- Reading proficiency
- 53% ▼ -32.00%
- Median HH income
- $45,115
- Composite
- 39.37/100
- National rank
- #3974
- State rank
- #15 of 98 in LA
Livability — Maurice
- Score
- 76/100
- State rank
- #15
- US rank
- #3333
Category grades
Schools grade is shown separately in the Schools card above.
Census & demographics
- County
- Vermilion Parish · 8,759 people
- City population
- 8,759
- Metro
- Lafayette, LA
- Population (ZIP)
- 8,759
- Household income
- $76,213
- Rent vs Own
- Severe rent burden
- 46.0
Population outlook (Vermilion County) Hauer SSP2
- Today (2025)
- 64,095 people
- By 2030
- 65,915 · +2.8%
- By 2040
- 68,985 · +7.6%
- By 2050
- 70,804 · +10.5%
- By 2075
- 73,897 · +15.3%
- By 2100
- 71,793 · +12.0%
Race, ethnicity, and origin ACS 2023
- Neighborhood character
- Predominantly White (82%)
- Race & ethnicity
- White 82% Black 8% Two or more races 5% Hispanic / Latino 4% Asian 3%
- Common ancestry
- Lithuanian 25% Romanian 3% Italian 1%
- Foreign-born
- 2% · Vietnam
- Languages at home
- 93% English-only · French/Haitian/Cajun 4% Vietnamese 2% Spanish 1%
Political lean MEDSL · Vermilion
- 2024 margin
- Solid R (+63.8) · D 17.6% · R 81.4% · Other 1.1%
- 2008→2024 swing
- -16.3pp toward R · 2008: -47.5pp · 2024: -63.8pp
- All cycles
- 2024: R+63.8 2020: R+61.9 2016: R+59.6 2012: R+52.8 2008: R+47.5
Not yet ingested
- Civics
- —
Market trends
- HPI YoY
- ▼ -55.61%
- Current HPI
- 133.7146
- Rent YoY
- —
- Metro
- Lafayette, LA
- State GDP YoY
- ▲ 3.29%
- F500 in state
- 10
Industry mix (Fortune 500 HQ in LA)
| Industry | F500 HQs | Revenue |
|---|---|---|
| Telecommunications | 2 | $23B |
|
||
| Utilities | 1 | $12B |
|
||
| Wholesale / Distribution | 1 | $5B |
|
||
| Advertising | 1 | $2B |
|
||
Price history
1 event — show timeline
- 2026-04-16 Listed $227,990 Zillow
Cash-flow waterfall
monthlySold comps — $/sqft
last 12 mo · ≤1 miLoading sold comps…