1980 Old Dixie Hwy · Mims, FL
Flood risk 1/10 · Minimal
- FEMA flood zone
- X (unshaded)
- Chance of flooding over 30 yrs
- 0.0%
- Est. flood insurance / yr
- $507 – $1,088
Fire risk 3/10 · Minor
- Est. fire insurance / yr
- $947 – $1,759
Heat risk 10/10 · Severe
- Hot days now (above 108°F)
- 7 days/yr
- Hot days in 30 yrs
- 22 days/yr
Wind risk 10/10 · Severe
- Chance of severe wind over 30 yrs
- 99.0%
Air-quality risk 1/10 · Minimal
- Unhealthy air days now
- 0 days/yr
- Unhealthy air days in 30 yrs
- 0 days/yr
Risk factors via First Street. Map © Google.
Why this score? — see what drove the C grade
The composite is a weighted blend of 9 inputs, each scored 0–100. Each bar is that input's sub-score; the figure is the points it added to the 100-point composite (weight × sub-score).
- Cash flow +23.7/30.0
- DSCR +7.6/10.0
- ARV discount +7.5/15.0
- 1% rule +5.8/10.0
- Schools +4.7/10.0
- Livability +3.1/5.0
- Rent growth +2.6/5.0
- Condition / age +2.5/5.0
- Appreciation +0.0/10.0
$186,000
🖨 Deal sheet (PDF) 📄 Offer letter ✓ Due diligence
Listing remarks MLS
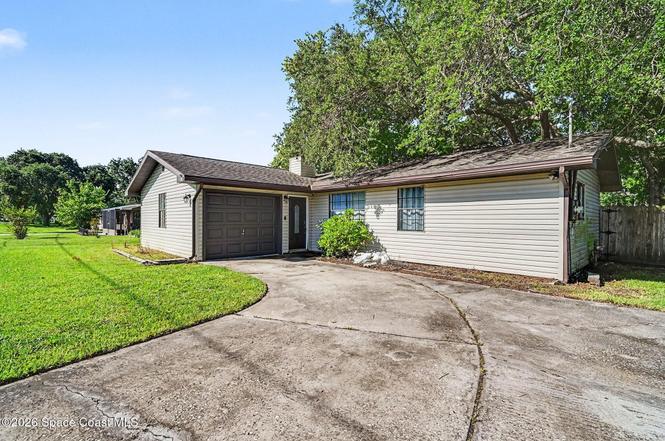
Picture perfect! Beautiful 3/2 split plan with wood burning fireplace. Updated throughout with all the right stuff! Large back yard with new privacy fence and back deck.
Key facts
- Private sanctuary
- Gourmet kitchen
- Stone fireplace
Tags
Property features AI
Exterior
- Parking: Attached garage (1 car)
- Utilities: Public sewer; Electricity connected
- Home design: Single-family residence; Faces east
- Construction: Frame construction
- Exterior features: Back yard fencing; No private pool
Interior
- Kitchen: Convection oven; Microwave; Refrigerator
- Bedrooms: 3 bedrooms
- Flooring: Concrete flooring
- Bathrooms: 2 full bathrooms
- Heating & cooling: Central heating; Central electric air conditioning
- Interior features: Ceiling fans; Wood-burning fireplace (1)
- Laundry & utility: Unfurnished (no included washer/dryer listed)
Neighborhood map
What this means for you Summary
Snapshot
- This is a 2-bed/1.0-bath single-family listed at $186k.
Deal economics
- At list price, monthly cash flow is $355 ($4k/yr) — positive.
- The deal already cash-flows at list — no discount required.
- Meets the 1% rule at list price ($2k rent vs $186k).
Location & tenants
- Location reads 62/100 on livability (#765 in FL) — a middle-class / working-renter tenant base. Strengths: cost of living A+, housing A+, crime B+; Watch: amenities F, commute F, employment F.
- Brevard (suburban): math 53% / reading 57% proficiency, ranked #19 of 73 in FL (top 26%) — acceptable for families but not a draw, mixed tenant base, ~2y average lease.
- Zoned schools: Mims Elementary School (math 42% / reading 47%, grade F, #1,288 of 2,144 statewide, top 62%, 462 students, 80% FRL); James Madison Middle School (math 39% / reading 39%, grade F, #381 of 571 statewide, top 67%, 446 students, 65% FRL); Astronaut High School (math 25% / reading 43%, grade F, #394 of 667 statewide, top 60%, 1,112 students, 51% FRL) — zoned schools average 65% FRL vs 43% district-wide (22 pts higher); higher-poverty schools than district average — tighter screening recommended.
- Zoned-school proficiency averages 39% at this address vs 55% district-wide (-16 pts) — the specific schools serving this property underperform the Brevard average; the district grade overstates school quality for this exact location.
- Market conditions: Rents flat; 256 active listings in the ZIP; 3 comparable units currently listed for rent nearby; rentals at typical pace (median 15d on market — plan ~3-4 weeks tenant-placement turnaround); 4,602 units permitted in Brevard County in 2024 (702 in 5+ unit buildings).
- This rent runs 36% of the median local income ($67k/yr) — at the standard rent-burdened threshold; future hikes will face affordability resistance.
Forward outlook
- Local home prices are declining (-3.0%/yr); year-one equity from $1k of loan paydown is wiped out by about $6k of value loss. Plan a longer hold.
- Brevard County population projected at +15% by 2050 — modest demand growth; plan on rents tracking national, not racing it.
Negotiation context
- Only 1 days on market — expect competitive offers; lowballing is unlikely to land.
- 7 sale attempts since 21y ago; this cycle's ask has dropped $14k (7%) from the opening price — seller is motivated, your offer sets the floor, not the list.
Risks & watch-outs
- Climate carrying-cost: severe wind risk, 99% chance of damaging wind over 30y; extreme-heat days projected 7→22/yr by 2055 (HVAC capex compounding) — expect insurance premiums to compound above CPI over the hold.
Questions for the listing agent
- Is there a deadline driving the sale (1031 exchange, divorce, estate, relocation)? That informs how much negotiation room exists.
- Schools are D-rated, which usually means shorter tenancies and higher turnover. Who's the typical renter profile here, and what's been the actual vacancy rate?
- What's the average days-on-market for RENTAL listings here right now (not sales)? A rising rental-DOM trend means longer vacancies and softer asking-rent achievability than the comps imply.
- What's the recent tenant-quality profile in this submarket — average credit score on applications, eviction rate, late-payment / NSF rate, and stable-employment percentage? A property-management company in the area should have these aggregated.
- How much new for-sale + rental construction is in the pipeline within 1–3 miles? Heavy new supply typically softens prices + rents 12–24 months out; constrained supply supports both.
Investment metrics
- 1% rule
- 1.08% ✓
- Cap rate
- 8.58%
- Cash-on-cash
- 8.19%
- DSCR
- 1.36
- GRM
- 7.7
CMA / ARV
No comps found within radius.
Projected returns pro-forma
-3.0% appreciation · 0.59% rent growth · sell at horizon
- IRR
- -6.5%
- Equity multiple
- 0.76×
- Total profit
- $-12,275
- Equity at exit
- $27,733
- IRR
- -0.1%
- Equity multiple
- 1.00×
- Total profit
- $-170
- Equity at exit
- $16,082
Cash invested: $52,080 (down + closing). Projections, not guarantees.
Landlord ↔ Tenant lean methodology
- Overall (STATE)
- 87 Strongly Landlord-Friendly
- State Florida
- 87 Strongly Landlord-Friendly · R+3
- County
- — inherits STATE
- City
- — inherits STATE
ZIP-level market 32796
- Rents YoY
- 0.6%
- Active inventory
- 256
- Price-to-rent
- 7.7×
Monthly cashflow live
- Estimated rent
- $2,010 medium interval (Pro) →
- Mortgage (P&I)
- −$975
- Tax from tax record
- −$179 /mo · $2,153/yr
- Insurance
- −$78
- HOA
- −$0
- Vacancy / Maint / Mgmt
- −$422
- Net cashflow
- $355
Break-even live
Sensitivity live
| Price | -10% $461 | -5% $408 | +0% $355 | +5% $303 | +10% $250 |
|---|---|---|---|---|---|
| Rent | -10% $196 | -5% $276 | +0% $355 | +5% $435 | +10% $514 |
| Rate | -1.0pp $449 | -0.5pp $403 | base $355 | +0.5pp $307 | +1.0pp $258 |
UW: 25.0% down · 7.5% · 30yr · 1.5% tax · 5.0% vac · 8.0% maint · 8.0% mgmt
Financing live
Cash to close
- Down payment
- $46,500
- Closing costs
- $5,580
- Reserves months
- —
- Total cash needed
- —
Loan-product check · same deal, 3 products live
Conventional
25% down · 7.5% · 30yr
- Down + closing
- —
- Monthly P&I
- —
- Monthly cashflow
- —
- DSCR
- —
- Eligible?
- —
Personal DTI + credit; lowest rate.
DSCR
20% down · 8.5% · 30yr
- Down + closing
- —
- Monthly P&I
- —
- Monthly cashflow
- —
- DSCR
- —
- Eligible?
- —
No personal income docs; deal must DSCR.
Hard money
10% down · 12.0% · 12mo
- Down + closing
- —
- Monthly P&I
- —
- Monthly cashflow
- —
- DSCR
- —
- Eligible?
- —
Short-term bridge; refi at stabilization.
Rent comps 3 comps
| Address | Beds | Baths | Sqft | Rent | $/sqft | DOM | Units | Dist |
|---|---|---|---|---|---|---|---|---|
| 1580 Liberty Tree Rd Titusville, FL | 3.0 | 2.0 | 1458 | $2,145 | $1.47 | 15d | 1 | 0.97mi |
| 1539 Lafayette Ave Titusville, FL | 3.0 | 2.0 | 1457 | $2,260 | $1.55 | 15d | 1 | 1.12mi |
| 1105 Morse Ave Titusville, FL | 3.0 | 2.0 | 1218 | $1,995 | $1.64 | 24d | 1 | 1.47mi |
Listing history 24 events
-
2026-06-19remarks 699-char remark
-
2026-06-19pricedays on market $186,000 Active 1 DOM
-
2026-03-11price $189,999
-
2026-02-20$199,999 Active
-
2021-05-03soldstatus $183,000
-
2021-04-30soldstatus $183,000 Closed 170-char remark
Show marketing remark (170 chars)
Picture perfect! Beautiful 3/2 split plan with wood burning fireplace. Updated throughout with all the right stuff! Large back yard with new privacy fence and back deck.
-
2021-03-03historical Contingent 170-char remark
Show marketing remark (170 chars)
Picture perfect! Beautiful 3/2 split plan with wood burning fireplace. Updated throughout with all the right stuff! Large back yard with new privacy fence and back deck.
-
2021-02-27price $175,000 170-char remark
Show marketing remark (170 chars)
Picture perfect! Beautiful 3/2 split plan with wood burning fireplace. Updated throughout with all the right stuff! Large back yard with new privacy fence and back deck.
-
2021-02-26status Active 170-char remark
Show marketing remark (170 chars)
Picture perfect! Beautiful 3/2 split plan with wood burning fireplace. Updated throughout with all the right stuff! Large back yard with new privacy fence and back deck.
-
2021-02-15historical Contingent 170-char remark
Show marketing remark (170 chars)
Picture perfect! Beautiful 3/2 split plan with wood burning fireplace. Updated throughout with all the right stuff! Large back yard with new privacy fence and back deck.
-
2021-02-04$169,900 Active 170-char remark
Show marketing remark (170 chars)
Picture perfect! Beautiful 3/2 split plan with wood burning fireplace. Updated throughout with all the right stuff! Large back yard with new privacy fence and back deck.
-
2019-04-05soldstatus $144,000 225-char remark
Show marketing remark (225 chars)
Ready to move in! Stunning stone fireplace, gourmet kitchen with waterfall granite, Master Bath with granite countertops. Brand new deck overlooks shady backyard with large oaks. Brand new 2 Ton A/C. Security System included.
-
2019-03-22soldstatus $144,000
-
2019-01-08historical
Show marketing remark (225 chars)
Ready to move in! Stunning stone fireplace, gourmet kitchen with waterfall granite, Master Bath with granite countertops. Brand new deck overlooks shady backyard with large oaks. Brand new 2 Ton A/C. Security System included.
-
2019-01-08$149,900 225-char remark
Show marketing remark (225 chars)
Ready to move in! Stunning stone fireplace, gourmet kitchen with waterfall granite, Master Bath with granite countertops. Brand new deck overlooks shady backyard with large oaks. Brand new 2 Ton A/C. Security System included.
-
2018-12-09$154,900
-
2018-06-02soldstatus $80,000
-
2017-10-04$89,400
-
2005-05-03soldstatus $133,500
-
2005-04-28soldstatus $133,500
-
2005-03-25$133,500
-
1994-03-10soldstatus $57,500
-
1990-12-01soldstatus $50,000
-
1981-08-01soldstatus $39,000
ⓘ Source: listings_history table (triggers on properties + properties_extension) + one-shot
backfill from property_details.listing_events for pre-trigger history.
Tax reassessment forecast FL · Resets to sale price
- Current annual tax
- $2,153 · $179/mo
- Projected year-2 tax
- $2,153 · $179/mo
- Expected delta
- $0/yr ($0/mo · 0.0%)
ⓘ Screening estimate from a state-policy table — verify with the county assessor before closing.
Climate risk First Street
- Flood 1/10 Low FEMA zone X (unshaded) · 0% chance over 30 yrs
- Wildfire 3/10 Moderate
- Heat 10/10 Extreme 7 d/yr ≥108°F today · 22 d/yr by 30 yrs out
- Wind 10/10 Extreme 99% chance of damaging wind over 30 yrs
- Air quality 1/10 Low 0 unhealthy d/yr today · 0 by 30 yrs out
Nearby sold comps map
Loading sold comps map…
Walkable amenities ~0.75 mi
Loading nearby amenities…
Taxation est. · year 1
- Rental income
- $24,115
- − Mortgage interest
- −$10,419
- − Property taxes
- −$2,153
- − Insurance
- −$930
- − Repairs & maintenance
- −$1,929
- − Management
- −$1,929
- − Depreciation
- −$5,411
- Taxable income
- $1,344
- Est. tax owed @ 24.0%
- −$323
- After-tax cash flow
- $3,940/yr
For passive investors: Depreciation is non-cash, so a rental often shows a tax loss while cash-flowing — sheltering income. Rental losses are passive: they offset passive income freely, and up to $25,000/yr can offset ordinary (W-2) income if you actively participate and your MAGI is under $100k (phasing out to $0 by $150k); unused losses carry forward. On sale, claimed depreciation is recaptured at up to 25%, and gains may owe capital-gains tax (a 1031 exchange can defer both). Figures are a year-1 estimate at your 24.0% rate — not tax advice; consult a CPA.
Schools (NCES district)
- District
- Brevard
- NCES district ID
- 1200150
- Math proficiency
- 53% ▼ -9.00%
- Reading proficiency
- 57% ▼ -4.00%
- Median HH income
- $49,426
- Composite
- 46.86/100
- National rank
- #2370
- State rank
- #19 of 73 in FL
Livability — Mims
- Score
- 62/100
- State rank
- #765
- US rank
- #17094
Category grades
Schools grade is shown separately in the Schools card above.
Census & demographics
- County
- Brevard County · 602,871 people
- Metro
- Palm Bay-Melbourne-Titusville, FL
- Population (ZIP)
- 20,222
- Household income
- $67,491
- Rent vs Own
- Severe rent burden
- 403.0
Population outlook (Brevard County) Hauer SSP2
- Today (2025)
- 623,254 people
- By 2030
- 648,420 · +4.0%
- By 2040
- 690,009 · +10.7%
- By 2050
- 715,669 · +14.8%
- By 2075
- 775,744 · +24.5%
- By 2100
- 776,687 · +24.6%
Race, ethnicity, and origin ACS 2023
- Neighborhood character
- Predominantly White (81%)
- Race & ethnicity
- White 81% Black 8% Hispanic / Latino 6% Two or more races 4%
- Hispanic origin (detail)
- Puerto Rican 3%
- Common ancestry
- Romanian 3% Italian 3% Slovak 2%
- Foreign-born
- 3% · Canada
- Languages at home
- 94% English-only · Spanish 5%
Political lean MEDSL · Brevard
- 2024 margin
- Strong R (+20.8) · D 39.1% · R 59.9% · Other 1.0%
- 2008→2024 swing
- -10.4pp toward R · 2008: -10.4pp · 2024: -20.8pp
- All cycles
- 2024: R+20.8 2020: R+16.4 2016: R+19.8 2012: R+12.7 2008: R+10.4
Not yet ingested
- Civics
- —
Market trends
- HPI YoY
- ▼ -172.25%
- Current HPI
- 303.5534
- Rent YoY
- ▲ 0.59%
- Metro
- Palm Bay-Melbourne-Titusville, FL
- State GDP YoY
- ▲ 3.28%
- F500 in state
- 36
Industry mix (Fortune 500 HQ in FL)
| Industry | F500 HQs | Revenue |
|---|---|---|
| Industrial Technology | 2 | $29B |
|
||
| Insurance | 2 | $17B |
|
||
| Retail | 1 | $60B |
|
||
| Technology Distribution | 1 | $58B |
|
||
| Homebuilding | 1 | $35B |
|
||
| Technology Manufacturing | 1 | $35B |
|
||
Price history
+387.2% since first listed22 events — show timeline
- 2026-03-11 Price Changed $189,999 SCMLS
- 2026-02-20 Listed $199,999 SCMLS
- 2021-05-03 Sold (Public Records) $183,000 Public Records
- 2021-04-30 Sold (MLS) $183,000 SCMLS
- 2021-03-03 Contingent — SCMLS
- 2021-02-27 Price Changed $175,000 SCMLS
- 2021-02-26 Relisted — SCMLS
- 2021-02-15 Contingent — SCMLS
- 2021-02-04 Listed $169,900 SCMLS
- 2019-04-05 Sold (MLS) $144,000 SCMLS
- 2019-03-22 Sold (Public Records) $144,000 Public Records
- 2019-01-08 Listed $149,900 SCMLS
- 2019-01-08 Listing Removed — Stellar MLS as Distributed by MLS Grid
- 2018-12-09 Listed $154,900 Stellar MLS as Distributed by MLS Grid
- 2018-06-02 Sold (MLS) $80,000 SCMLS
- 2017-10-04 Listed $89,400 SCMLS
- 2005-05-03 Sold (Public Records) $133,500 Public Records
- 2005-04-28 Sold (MLS) $133,500 SCMLS
- 2005-03-25 Listed $133,500 SCMLS
- 1994-03-10 Sold (Public Records) $57,500 Public Records
- 1990-12-01 Sold (Public Records) $50,000 Public Records
- 1981-08-01 Sold (Public Records) $39,000 Public Records
Property tax history
+12.2%/yrLatest (2025): $2,153 · +6.4% YoY. Source: county tax records.
Cash-flow waterfall
monthlySold comps — $/sqft
last 12 mo · ≤1 miLoading sold comps…