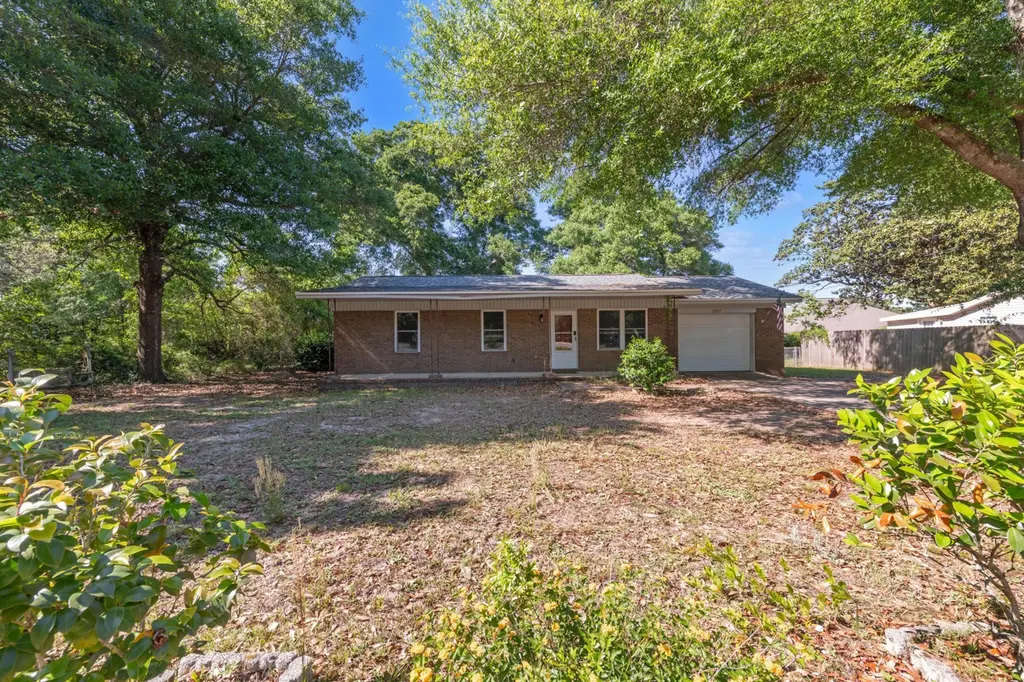
2317 Lewis St · Crestview, FL
Flood risk 1/10 · Minimal
- FEMA flood zone
- X (unshaded)
- Chance of flooding over 30 yrs
- 0.0%
- Est. flood insurance / yr
- $507 – $1,088
Fire risk 4/10 · Minor
- Est. fire insurance / yr
- $947 – $1,759
Heat risk 9/10 · Severe
- Hot days now (above 107°F)
- 7 days/yr
- Hot days in 30 yrs
- 19 days/yr
Wind risk 9/10 · Severe
- Chance of severe wind over 30 yrs
- 99.0%
Air-quality risk 2/10 · Minimal
- Unhealthy air days now
- 1 days/yr
- Unhealthy air days in 30 yrs
- 1 days/yr
Risk factors via First Street. Map © Google.
Why this score? — see what drove the D+ grade
The composite is a weighted blend of 9 inputs, each scored 0–100. Each bar is that input's sub-score; the figure is the points it added to the 100-point composite (weight × sub-score).
- Cash flow +14.4/30.0
- ARV discount +13.0/15.0
- Schools +5.2/10.0
- DSCR +4.4/10.0
- Livability +3.8/5.0
- 1% rule +2.9/10.0
- Rent growth +2.8/5.0
- Condition / age +2.5/5.0
- Appreciation +0.0/10.0
$222,000
🖨 Deal sheet 📄 Offer letter ✓ Due diligence
Listing remarks MLS
Pre-sold . New photos after completion.
Key facts
- Custom cabinetry
- Fully renovated
- Granite countertops
Tags
Property features AI
Exterior
- Parking: Garage
- Utilities: Public water; Septic tank; Electric service (central AC)
- Home design: Rustic-style single-family home; One story; Built in 1979
- Construction: Built in 1979
- Exterior features: Lot approximately 0.32 acres (80 x 140); Subdivision: LEON HEIGHTS; No pool
Interior
- Kitchen: Kitchen on the first floor
- Bedrooms: Three bedrooms on the first floor (each approximately 13' x 13')
- Bathrooms: One full bathroom
- Heating & cooling: Central electric air conditioning
- Interior features: Central air conditioning
Neighborhood map
What this means for you Summary
Snapshot
- This is a 3-bed/1.0-bath single-family listed at $222k.
Deal economics
- At list price, monthly cash flow is $44 ($529/yr) — positive.
- The deal already cash-flows at list — no discount required.
- To meet the 1% rule (rent ≥ 1% of price), the offer needs to be $176k (20.7% below list).
- Recommended offer: $176k (20.7% below list) — sets the bar for 1% rule.
- Cap rate 6.5% vs local median 4.4% in Crestview — top-decile yield for the area; either an underpriced asset or a hidden risk that comps aren't pricing in. Stress-test before assuming the spread holds.
Location & tenants
- Location reads 75/100 on livability (#252 in FL, #3,858 nationally) — a middle-class / working-renter tenant base. Strengths: cost of living A+, housing A+, health & safety A+; Watch: employment D, amenities F, commute F.
- Okaloosa (other): math 60% / reading 60% proficiency, ranked #12 of 73 in FL (top 16%) — acceptable for families but not a draw, mixed tenant base, ~2y average lease.
- Zoned schools: Bob Sikes Elementary School (math 53% / reading 60%, grade C+, #816 of 2,144 statewide, top 39%, 829 students, 52% FRL); Crestview High School (math 49% / reading 54%, grade D+, #167 of 667 statewide, top 25%, 2,315 students, 42% FRL).
- Market conditions: Rents rising (+1.2%/yr); 349 active listings in the ZIP; 8 comparable units currently listed for rent nearby; rentals at typical pace (median 21d on market — plan ~3-4 weeks tenant-placement turnaround); solid renter incomes; 1,268 units permitted in Okaloosa County in 2024 (175 in 5+ unit buildings).
Forward outlook
- Local home prices are declining (-3.0%/yr); year-one equity from $2k of loan paydown is wiped out by about $7k of value loss. Plan a longer hold.
- Okaloosa County population projected at +37% by 2050 — long-run rental-demand tailwind backs the buy-and-hold thesis.
Negotiation context
- It's been on market 41 days — a 3% lower offer ($215k) is reasonable based on typical stale-listing flexibility.
Risks & watch-outs
- Climate carrying-cost: severe wind risk, 99% chance of damaging wind over 30y; extreme-heat days projected 7→19/yr by 2055 (HVAC capex compounding) — expect insurance premiums to compound above CPI over the hold.
Questions for the listing agent
- It's been on market 41 days. Have you received any prior offers? Is the seller open to a 21% concession, seller financing, or rate buy-down credit?
- Built in 1979 — when were the roof, HVAC, electrical panel, plumbing, and water heater last replaced?
- Is there a deadline driving the sale (1031 exchange, divorce, estate, relocation)? That informs how much negotiation room exists.
- Schools are B-rated — typically a magnet for longer-tenancy family renters. What's the average tenant stay here, and is there a school-zone premium baked into asking?
- The area grade is low — what's the realistic commute time and amenity access for the typical tenant pool here? Any planned neighborhood developments (good or bad) we should know about?
- What's the average days-on-market for RENTAL listings here right now (not sales)? A rising rental-DOM trend means longer vacancies and softer asking-rent achievability than the comps imply.
- What's the recent tenant-quality profile in this submarket — average credit score on applications, eviction rate, late-payment / NSF rate, and stable-employment percentage? A property-management company in the area should have these aggregated.
- How much new for-sale + rental construction is in the pipeline within 1–3 miles? Heavy new supply typically softens prices + rents 12–24 months out; constrained supply supports both.
Investment metrics
- 1% rule
- 0.79% ✗
- Cap rate
- 6.53%
- Cash-on-cash
- 0.85%
- DSCR
- 1.04
- GRM
- 10.5
CMA / ARV
- ARV (median comp)
- $252,913
- List price
- $222,000
- Delta
- -12.22%
- Verdict
- UNDERPRICED
- Comps
- 20 within 1.0 mi
Projected returns pro-forma
-3.0% appreciation · 1.17% rent growth · sell at horizon
- IRR
- -16.8%
- Equity multiple
- 0.41×
- Total profit
- $-36,437
- Equity at exit
- $33,101
- IRR
- -12.0%
- Equity multiple
- 0.34×
- Total profit
- $-41,069
- Equity at exit
- $19,195
Cash invested: $62,160 (down + closing). Projections, not guarantees.
Landlord ↔ Tenant lean methodology
- Overall (STATE)
- 87 Strongly Landlord-Friendly
- State Florida
- 87 Strongly Landlord-Friendly · R+3
- County
- — inherits STATE
- City
- — inherits STATE
ZIP-level market 32536
- Home prices YoY
- -16.2%
- Rents YoY
- 1.2%
- Active inventory
- 349
- Price-to-rent
- 10.5×
Monthly cashflow live
- Estimated rent
- $1,762 high interval (Pro) →
- Mortgage (P&I)
- −$1,164
- Tax from tax record
- −$91 /mo · $1,090/yr
- Insurance
- −$92
- HOA
- −$0
- Vacancy / Maint / Mgmt
- −$370
- Net cashflow
- $44
Break-even live
UW: 25.0% down · 7.5% · 30yr · 1.5% tax · 5.0% vac · 8.0% maint · 8.0% mgmt
Financing live
Cash to close
- Down payment
- $55,500
- Closing costs
- $6,660
- Reserves months
- —
- Total cash needed
- —
Loan-product check · same deal, 3 products live
Conventional
25% down · 7.5% · 30yr
- Down + closing
- —
- Monthly P&I
- —
- Monthly cashflow
- —
- DSCR
- —
- Eligible?
- —
Personal DTI + credit; lowest rate.
DSCR
20% down · 8.5% · 30yr
- Down + closing
- —
- Monthly P&I
- —
- Monthly cashflow
- —
- DSCR
- —
- Eligible?
- —
No personal income docs; deal must DSCR.
Hard money
10% down · 12.0% · 12mo
- Down + closing
- —
- Monthly P&I
- —
- Monthly cashflow
- —
- DSCR
- —
- Eligible?
- —
Short-term bridge; refi at stabilization.
Rent comps 8 comps
| Address | Beds | Baths | Sqft | Rent | $/sqft | DOM | Units | Dist |
|---|---|---|---|---|---|---|---|---|
| 800 Spring Creek Blvd Crestview, FL | 1.0–3.0 | 1.0–2.0 | 1009 | $1,900 | $1.88 | 13d | 28 | 0.81mi |
| 257 Lindberg St Crestview, FL | 2.0 | 1.0 | 832 | $1,100 | $1.32 | 43d | 1 | 1.02mi |
| 131 Adkinson Dr Crestview, FL | 4.0 | 1.0 | 1332 | $1,750 | $1.31 | 13d | 1 | 1.16mi |
| 132 Cabana Way Crestview, FL | 3.0 | 2.0 | 1408 | $1,750 | $1.24 | 13d | 1 | 1.37mi |
| 830 Arbor Lake Dr Crestview, FL | 2.0 | 2.5 | 1200 | $1,400 | $1.17 | 13d | 1 | 1.40mi |
| 720 Arbor Lake Dr Crestview, FL | 2.0 | 2.5 | 1100 | $1,400 | $1.27 | 43d | 1 | 1.41mi |
| 720 Arbor Lake Dr Crestview, FL | 2.0 | 2.5 | 1100 | $1,375 | $1.25 | 21d | 1 | 1.41mi |
| 156 Cabana Way Crestview, FL | 4.0 | 2.0 | 1244 | $1,800 | $1.45 | 43d | 1 | 1.46mi |
Listing history 20 events
-
2026-06-18days on market $222,000 Active 41 DOM
-
2026-06-17days on market $222,000 Active 40 DOM
-
2026-06-16days on market $222,000 Active 39 DOM
-
2026-06-15days on market $222,000 Active 38 DOM
-
2026-06-14days on market $222,000 Active 36 DOM
-
2026-06-13days on market $222,000 Active 35 DOM
-
2026-06-10days on market $222,000 Active 33 DOM
-
2026-06-09days on market $222,000 Active 32 DOM
-
2026-06-08days on market $222,000 Active 31 DOM
-
2026-06-07pricedays on market $222,000 Active 30 DOM
-
2026-06-05days on market $227,000 Active 27 DOM
-
2026-06-02days on market $227,000 Active 25 DOM
-
2026-06-01days on market $227,000 Active 24 DOM
-
2026-05-31days on market $227,000 Active 23 DOM
-
2026-05-30days on market $227,000 Active 22 DOM
-
2026-05-14price $229,000 665-char remark
-
2026-05-08$238,000 Active 665-char remark
-
2023-07-31soldstatus $208,000
-
2023-07-25soldstatus $208,000 Sold 39-char remark
Show marketing remark (39 chars)
Pre-sold . New photos after completion.
-
1980-03-01soldstatus $25,800
ⓘ Source: listings_history table (triggers on properties + properties_extension) + one-shot
backfill from property_details.listing_events for pre-trigger history.
Tax reassessment forecast FL · Resets to sale price
- Current annual tax
- $1,090 · $91/mo
- Projected year-2 tax
- $1,843 · $154/mo
- Expected delta
- +$753/yr (+$63/mo · 69.1%)
ⓘ Screening estimate from a state-policy table — verify with the county assessor before closing.
Climate risk First Street
- Flood 1/10 Low FEMA zone X (unshaded) · 0% chance over 30 yrs
- Wildfire 4/10 Moderate
- Heat 9/10 Extreme 7 d/yr ≥107°F today · 19 d/yr by 30 yrs out
- Wind 9/10 Extreme 99% chance of damaging wind over 30 yrs
- Air quality 2/10 Low 1 unhealthy d/yr today · 1 by 30 yrs out
Nearby sold comps map
Loading sold comps map…
Walkable amenities ~0.75 mi
Loading nearby amenities…
Taxation est. · year 1
- Rental income
- $21,138
- − Mortgage interest
- −$12,435
- − Property taxes
- −$1,090
- − Insurance
- −$1,110
- − Repairs & maintenance
- −$1,691
- − Management
- −$1,691
- − Depreciation
- −$6,458
- Taxable loss
- −$3,337
- Est. tax savings @ 24.0%
- +$801
- After-tax cash flow
- $1,330/yr
For passive investors: Depreciation is non-cash, so a rental often shows a tax loss while cash-flowing — sheltering income. Rental losses are passive: they offset passive income freely, and up to $25,000/yr can offset ordinary (W-2) income if you actively participate and your MAGI is under $100k (phasing out to $0 by $150k); unused losses carry forward. On sale, claimed depreciation is recaptured at up to 25%, and gains may owe capital-gains tax (a 1031 exchange can defer both). Figures are a year-1 estimate at your 24.0% rate — not tax advice; consult a CPA.
Schools (NCES district)
- District
- Okaloosa
- NCES district ID
- 1201380
- Math proficiency
- 60% ▼ -12.00%
- Reading proficiency
- 60% ▼ -4.00%
- Median HH income
- $55,601
- Composite
- 51.62/100
- National rank
- #1705
- State rank
- #12 of 73 in FL
Livability — Crestview
- Score
- 75/100
- State rank
- #252
- US rank
- #3858
Category grades
Schools grade is shown separately in the Schools card above.
Census & demographics
- County
- Okaloosa County · 194,352 people
- City population
- 58,889
- Metro
- Crestview-Fort Walton Beach-Destin, FL
- Population (ZIP)
- 25,599
- Household income
- $78,119
- Rent vs Own
- Severe rent burden
- 634.0
Population outlook (Okaloosa County) Hauer SSP2
- Today (2025)
- 235,133 people
- By 2030
- 253,483 · +7.8%
- By 2040
- 289,537 · +23.1%
- By 2050
- 322,954 · +37.3%
- By 2075
- 399,624 · +70.0%
- By 2100
- 425,311 · +80.9%
Race, ethnicity, and origin ACS 2023
- Neighborhood character
- Diverse neighborhood (Simpson 0.56)
- Race & ethnicity
- White 64% Black 16% Hispanic / Latino 12% Two or more races 9% Asian 3%
- Hispanic origin (detail)
- Mexican 4% Puerto Rican 2% Dominican 1%
- Common ancestry
- Lithuanian 2% Slovak 2% Italian 2%
- Foreign-born
- 6% · Canada, South Korea
- Languages at home
- 91% English-only · Spanish 7% Tagalog/Filipino 1%
Political lean MEDSL · Okaloosa
- 2024 margin
- Solid R (+42.4) · D 28.2% · R 70.7% · Other 1.1%
- 2008→2024 swing
- +2.5pp toward D · 2008: -44.9pp · 2024: -42.4pp
- All cycles
- 2024: R+42.4 2020: R+39.1 2016: R+47.8 2012: R+49.4 2008: R+44.9
Not yet ingested
- Civics
- —
Market trends
- HPI YoY
- ▼ -51.48%
- Current HPI
- 265.9926
- Rent YoY
- ▲ 1.17%
- Metro
- Crestview-Fort Walton Beach-Destin, FL
- State GDP YoY
- ▲ 3.28%
- F500 in state
- 36
Industry mix (Fortune 500 HQ in FL)
| Industry | F500 HQs | Revenue |
|---|---|---|
| Industrial Technology | 2 | $29B |
|
||
| Insurance | 2 | $17B |
|
||
| Retail | 1 | $60B |
|
||
| Technology Distribution | 1 | $58B |
|
||
| Homebuilding | 1 | $35B |
|
||
| Technology Manufacturing | 1 | $35B |
|
||
Price history
+760.5% since first listed7 events — show timeline
- 2026-06-06 Price Changed $222,000 ECAR
- 2026-05-25 Price Changed $227,000 ECAR
- 2026-05-14 Price Changed $229,000 ECAR
- 2026-05-08 Listed $238,000 ECAR
- 2023-07-31 Sold (Public Records) $208,000 Public Records
- 2023-07-25 Sold (MLS) $208,000 ECAR
- 1980-03-01 Sold (Public Records) $25,800 Public Records
Property tax history
+10.1%/yrLatest (2025): $1,090 · -1.3% YoY. Source: county tax records.
Cash-flow waterfall
monthlySold comps — $/sqft
last 12 mo · ≤1 miLoading sold comps…