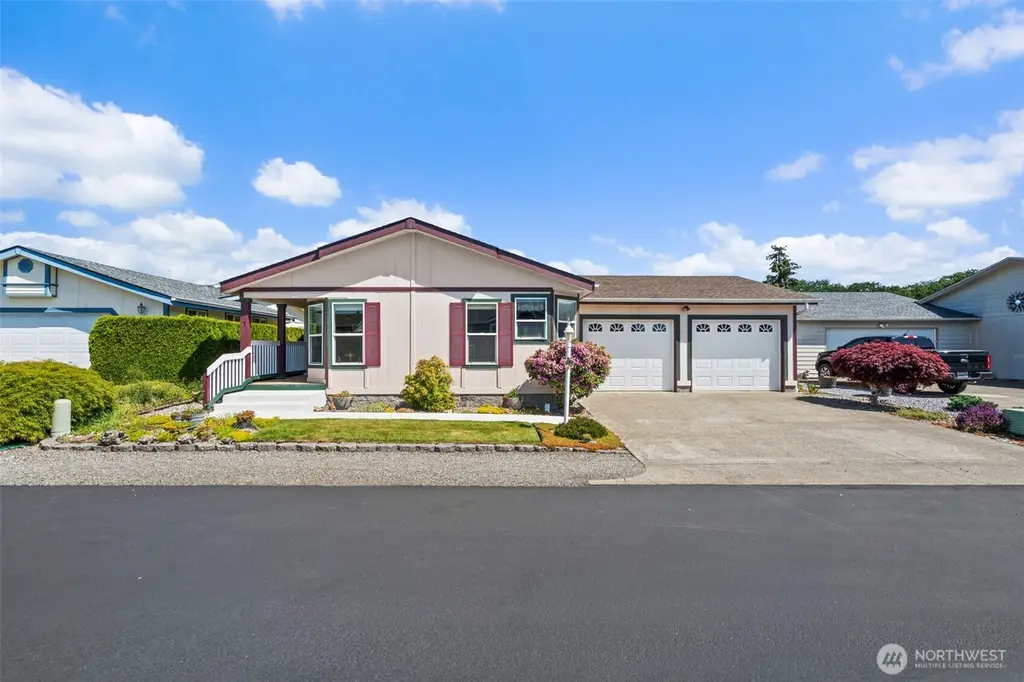
1918 Harrison Ave #3 · Centralia, WA
Flood risk 1/10 · Minimal
- FEMA flood zone
- X
- Chance of flooding over 30 yrs
- 0.0%
- Est. flood insurance / yr
- $507 – $1,088
Fire risk 1/10 · Minimal
- Est. fire insurance / yr
- $604 – $1,122
Heat risk 3/10 · Minor
- Hot days now (above 90°F)
- 8 days/yr
- Hot days in 30 yrs
- 16 days/yr
Wind risk 1/10 · Minimal
- Chance of severe wind over 30 yrs
- —
Air-quality risk 6/10 · Moderate
- Unhealthy air days now
- 8 days/yr
- Unhealthy air days in 30 yrs
- 8 days/yr
Risk factors via First Street. Map © Google.
Why this score? — see what drove the D grade
The composite is a weighted blend of 9 inputs, each scored 0–100. Each bar is that input's sub-score; the figure is the points it added to the 100-point composite (weight × sub-score).
- Cash flow +12.4/30.0
- ARV discount +7.5/15.0
- Schools +4.0/10.0
- Livability +4.0/5.0
- DSCR +3.7/10.0
- Rent growth +3.2/5.0
- 1% rule +2.7/10.0
- Condition / age +2.5/5.0
- Appreciation +0.0/10.0
$257,000
🖨 Deal sheet (PDF) 📄 Offer letter ✓ Due diligence
Listing remarks
Located in Golden Estates, a desirable 55+ community in Centralia! This well-maintained 3-bedroom, 2-bath manufactured home offers comfortable, easy living with thoughtful features throughout. Both bathrooms include convenient walk-in showers, while the spacious kitchen provides plenty of room for cooking and gathering. The inviting living areas create a warm and comfortable atmosphere to relax and entertain. Step outside to enjoy the private back patio and beautifully landscaped yard. Additional amenities include a 2-car garage plus off-street parking for two more vehicles. Residents of Golden Estates also enjoy access to a wonderful community clubhouse and party room. Ideally located near
Key facts
- Community clubhouse
- Access to i-5
- Private back patio
Tags
Property features AI
Finance
- Other: Property type: Residential manufactured home; Structure type: Manufactured house; Calculated building area: 1512 (source: public records)
- Financial info: Land lease amount: $525; Listing terms: Cash or Conventional
- HOA & community: Located in Golden Estates senior community; Manufactured home park amenities include clubhouse and high-speed internet availability; Park approved for sale
Exterior
- Parking: Individual garage (has garage)
- Utilities: Public water (City of Centralia); Public sewer (City of Centralia); Electric service (City of Centralia power company)
- Home design: Manufactured home (double wide); One story
- Construction: Composition roof
- Exterior features: Paved lot; Has view; Patio/porch/deck; Awnings; Landscaped
Interior
- Kitchen: Dishwasher; Refrigerator; Stove/Range
- Bedrooms: 3 bedrooms
- Flooring: Laminate; Carpet
- Bathrooms: 1 full bath; 1 three-quarter bath; 1 bathtub; 2 showers
- Heating & cooling: Heat pump heating; No central cooling indicated
- Interior features: Ceiling fan(s); Double pane windows; Jetted/soaking tub; Bath off primary; Awnings; Patio/porch/deck; Landscaped
- Laundry & utility: Electric energy source; Heat pump (heating)
Neighborhood map
What this means for you Summary
Snapshot
- This is a 3-bed/2.0-bath other listed at $257k.
Deal economics
- At list price, monthly cash flow is $-41 ($-491/yr) — negative.
- To cash-flow at today's rent, offer at most $250k (2.8% below list).
- To meet the 1% rule (rent ≥ 1% of price), the offer needs to be $198k (23.1% below list).
- Recommended offer: $198k (23.1% below list) — sets the bar for 1% rule.
- Cap rate 6.1% vs local median 3.0% in Centralia — top-decile yield for the area; either an underpriced asset or a hidden risk that comps aren't pricing in. Stress-test before assuming the spread holds.
Location & tenants
- Location reads 81/100 on livability (#81 in WA, #1,497 nationally) — a professional / high-income tenant draw. Strengths: commute A+, health & safety A+, cost of living A; Watch: schools C-, crime C-, employment F.
- Centralia School District (town): math 39% / reading 52% proficiency, ranked #187 of 291 in WA (top 64%) — families likely to look elsewhere, expect single-tenant / working-renter base with shorter leases; 65% free/reduced lunch — lower-income household profile, screen leases tightly.
- Market conditions: Rents rising (+3.0%/yr); 258 active listings in the ZIP; 7 comparable units currently listed for rent nearby; rentals lingering (median 45d on market — plan ~5-8 weeks vacancy on turnover, expect pricing pressure); 71% of comp listings sitting > 30 days — soft ceiling on asking rent; 265 units permitted in Lewis County in 2024 (44 in 5+ unit buildings).
- This rent runs 37% of the median local income ($63k/yr) — at the standard rent-burdened threshold; future hikes will face affordability resistance.
Forward outlook
- Local home prices are declining (-3.0%/yr); year-one equity from $2k of loan paydown is wiped out by about $8k of value loss. Plan a longer hold.
- Lewis County population projected at -11% by 2050 — secular population decline; favor cash flow + early exit over multi-decade hold.
Negotiation context
- Only 9 days on market — expect competitive offers; lowballing is unlikely to land.
- 5 sale attempts since 12y ago with the ask held roughly flat each time — persistent listings suggest the price (not the market) is what's stuck; bring a comps-based counter.
- Current owner paid $80k; list at $257k implies a 221% gain — meaningful room to come down on a strong offer.
Questions for the listing agent
- What do current leases actually rent for vs. the listed asking? Can we see a recent rent roll and the last 12 months of T-12 income?
- Is there a deadline driving the sale (1031 exchange, divorce, estate, relocation)? That informs how much negotiation room exists.
- The area grade is low — what's the realistic commute time and amenity access for the typical tenant pool here? Any planned neighborhood developments (good or bad) we should know about?
- What's the average days-on-market for RENTAL listings here right now (not sales)? A rising rental-DOM trend means longer vacancies and softer asking-rent achievability than the comps imply.
- What's the recent tenant-quality profile in this submarket — average credit score on applications, eviction rate, late-payment / NSF rate, and stable-employment percentage? A property-management company in the area should have these aggregated.
- How much new for-sale + rental construction is in the pipeline within 1–3 miles? Heavy new supply typically softens prices + rents 12–24 months out; constrained supply supports both.
Investment metrics
- 1% rule
- 0.77% ✗
- Cap rate
- 6.10%
- Cash-on-cash
- -0.68%
- DSCR
- 0.97
- GRM
- 10.8
CMA / ARV
No comps found within radius.
Projected returns pro-forma
-3.0% appreciation · 3.0% rent growth · sell at horizon
- IRR
- -17.5%
- Equity multiple
- 0.38×
- Total profit
- $-44,329
- Equity at exit
- $38,320
- IRR
- -9.6%
- Equity multiple
- 0.41×
- Total profit
- $-42,272
- Equity at exit
- $22,221
Cash invested: $71,960 (down + closing). Projections, not guarantees.
Landlord ↔ Tenant lean methodology
- Overall (STATE)
- 28 Tenant-Leaning
- State Washington
- 28 Tenant-Leaning · D+8
- County
- — inherits STATE
- City
- — inherits STATE
ZIP-level market 98531
- Rents YoY
- 3.0%
- Active inventory
- 258
- Price-to-rent
- 10.8×
Monthly cashflow live
- Estimated rent
- $1,975 high interval (Pro) →
- Mortgage (P&I)
- −$1,348
- Tax from tax record
- −$147 /mo · $1,759/yr
- Insurance
- −$107
- HOA
- −$0
- Vacancy / Maint / Mgmt
- −$415
- Net cashflow
- $-41
Break-even live
Sensitivity live
| Price | -10% $105 | -5% $32 | +0% $-41 | +5% $-114 | +10% $-186 |
|---|---|---|---|---|---|
| Rent | -10% $-197 | -5% $-119 | +0% $-41 | +5% $37 | +10% $115 |
| Rate | -1.0pp $89 | -0.5pp $24 | base $-41 | +0.5pp $-108 | +1.0pp $-175 |
UW: 25.0% down · 7.5% · 30yr · 1.5% tax · 5.0% vac · 8.0% maint · 8.0% mgmt
Financing live
Cash to close
- Down payment
- $64,250
- Closing costs
- $7,710
- Reserves months
- —
- Total cash needed
- —
Loan-product check · same deal, 3 products live
Conventional
25% down · 7.5% · 30yr
- Down + closing
- —
- Monthly P&I
- —
- Monthly cashflow
- —
- DSCR
- —
- Eligible?
- —
Personal DTI + credit; lowest rate.
DSCR
20% down · 8.5% · 30yr
- Down + closing
- —
- Monthly P&I
- —
- Monthly cashflow
- —
- DSCR
- —
- Eligible?
- —
No personal income docs; deal must DSCR.
Hard money
10% down · 12.0% · 12mo
- Down + closing
- —
- Monthly P&I
- —
- Monthly cashflow
- —
- DSCR
- —
- Eligible?
- —
Short-term bridge; refi at stabilization.
Rent comps 7 comps
| Address | Beds | Baths | Sqft | Rent | $/sqft | DOM | Units | Dist |
|---|---|---|---|---|---|---|---|---|
| 1413 Nora Ln Centralia, WA | 2.0 | 3.0 | 1315 | $1,850 | $1.41 | 44d | 1 | 0.44mi |
| 1413 Nora Ln Unit B Centralia, WA | 2.0 | 2.5 | 1315 | $1,850 | $1.41 | 44d | 1 | 0.44mi |
| 2711 Niki Ln Bldg D8 Centralia, WA | 3.0 | 2.5 | 1312 | $2,100 | $1.60 | 44d | 1 | 0.90mi |
| 2711 Niki LN Centralia, WA | 3.0 | 2.0 | 1250 | $2,100 | $1.68 | 44d | 1 | 0.95mi |
| 683 Bryden Ave Unit A Centralia, WA | 4.0 | 2.5 | 1944 | $2,900 | $1.49 | 44d | 1 | 1.02mi |
| 2999 Harrison Ave Centralia, WA | 3.0 | 2.5 | 1312 | $2,100 | $1.60 | 22d | 1 | 1.05mi |
| 2991 Yaro Ln Unit A Centralia, WA | 3.0 | 2.5 | 1312 | $2,100 | $1.60 | 22d | 1 | 1.06mi |
Listing history 8 events
-
2026-06-19days on market $257,000 Active 9 DOM
-
2026-06-18days on market $257,000 Active 8 DOM
-
2026-06-17days on market $257,000 Active 7 DOM
-
2026-06-16days on market $257,000 Active 6 DOM
-
2026-06-15days on market $257,000 Active 5 DOM
-
2026-06-14days on market $257,000 Active 3 DOM
-
2026-06-12remarks 699-char remark
-
2026-06-12$257,000 Active 2 DOM
ⓘ Source: listings_history table (triggers on properties + properties_extension) + one-shot
backfill from property_details.listing_events for pre-trigger history.
Tax reassessment forecast WA · Resets to sale price
- Current annual tax
- $1,759 · $147/mo
- Projected year-2 tax
- $2,519 · $210/mo
- Expected delta
- +$759/yr (+$63/mo · 43.2%)
ⓘ Screening estimate from a state-policy table — verify with the county assessor before closing.
Climate risk First Street
- Flood 1/10 Low FEMA zone X · 0% chance over 30 yrs
- Wildfire 1/10 Low
- Heat 3/10 Moderate 8 d/yr ≥90°F today · 16 d/yr by 30 yrs out
- Wind 1/10 Low
- Air quality 6/10 Major 8 unhealthy d/yr today · 8 by 30 yrs out
Nearby sold comps map
Loading sold comps map…
Walkable amenities ~0.75 mi
Loading nearby amenities…
Taxation est. · year 1
- Rental income
- $23,704
- − Mortgage interest
- −$14,396
- − Property taxes
- −$1,759
- − Insurance
- −$1,285
- − Repairs & maintenance
- −$1,896
- − Management
- −$1,896
- − Depreciation
- −$7,476
- Taxable loss
- −$5,005
- Est. tax savings @ 24.0%
- +$1,201
- After-tax cash flow
- $710/yr
For passive investors: Depreciation is non-cash, so a rental often shows a tax loss while cash-flowing — sheltering income. Rental losses are passive: they offset passive income freely, and up to $25,000/yr can offset ordinary (W-2) income if you actively participate and your MAGI is under $100k (phasing out to $0 by $150k); unused losses carry forward. On sale, claimed depreciation is recaptured at up to 25%, and gains may owe capital-gains tax (a 1031 exchange can defer both). Figures are a year-1 estimate at your 24.0% rate — not tax advice; consult a CPA.
Schools (NCES district)
- District
- Centralia School District
- NCES district ID
- 5301140
- Math proficiency
- 39% ▼ -2.00%
- Reading proficiency
- 52% ▼ -2.00%
- Median HH income
- $38,851
- Composite
- 40.17/100
- National rank
- #7832
- State rank
- #187 of 291 in WA
Livability — Centralia
- Score
- 81/100
- State rank
- #81
- US rank
- #1497
Category grades
Schools grade is shown separately in the Schools card above.
Census & demographics
- Census place
- Centralia, WA
- County
- Lewis County · 27,337 people
- City population
- 27,337
- Metro
- Centralia, WA
- Population (ZIP)
- 27,337
- Household income
- $63,406
- Rent vs Own
- Severe rent burden
- 1000.0
Population outlook (Lewis County) Hauer SSP2
- Today (2025)
- 75,749 people
- By 2030
- 74,647 · -1.5%
- By 2040
- 71,310 · -5.9%
- By 2050
- 67,748 · -10.6%
- By 2075
- 59,829 · -21.0%
- By 2100
- 52,293 · -31.0%
Race, ethnicity, and origin ACS 2023
- Neighborhood character
- Predominantly White (74%)
- Race & ethnicity
- White 74% Hispanic / Latino 19% Two or more races 10% Asian 1%
- Hispanic origin (detail)
- Mexican 15% Puerto Rican 1%
- Common ancestry
- Portuguese 3% Slovak 3% Lithuanian 2%
- Foreign-born
- 9% · Canada, Vietnam
- Languages at home
- 83% English-only · Spanish 16% Tagalog/Filipino 1%
Political lean MEDSL · Lewis
- 2024 margin
- Solid R (+33.0) · D 32.0% · R 65.0% · Other 3.0%
- 2008→2024 swing
- -13.8pp toward R · 2008: -19.2pp · 2024: -33.0pp
- All cycles
- 2024: R+33.0 2020: R+32.8 2016: R+36.2 2012: R+23.5 2008: R+19.2
Not yet ingested
- Civics
- —
Market trends
- HPI YoY
- ▼ -249.98%
- Current HPI
- 378.6936
- Rent YoY
- ▲ 3.00%
- Metro
- Centralia, WA
- State GDP YoY
- ▲ 4.65%
- F500 in state
- 22
Industry mix (Fortune 500 HQ in WA)
| Industry | F500 HQs | Revenue |
|---|---|---|
| Retail | 2 | $269B |
|
||
| Technology / Retail | 1 | $638B |
|
||
| Technology | 1 | $245B |
|
||
| Telecommunications | 1 | $38B |
|
||
| Food / Beverage | 1 | $36B |
|
||
| Automotive / Trucks | 1 | $34B |
|
||
Price history
+179.3% since first listed16 events — show timeline
- 2026-06-09 Listed $257,000 NWMLS as Distributed by MLS Grid
- 2014-08-13 Delisted — NWMLS as Distributed by MLS Grid
- 2014-08-06 Sold (MLS) $80,000 NWMLS as Distributed by MLS Grid
- 2014-07-29 Pending — NWMLS as Distributed by MLS Grid
- 2014-06-03 Price Changed $80,000 NWMLS as Distributed by MLS Grid
- 2014-06-03 Pending — NWMLS as Distributed by MLS Grid
- 2014-05-15 Price Changed $82,000 NWMLS as Distributed by MLS Grid
- 2014-05-04 Relisted — NWMLS as Distributed by MLS Grid
- 2014-05-02 Pending — NWMLS as Distributed by MLS Grid
- 2014-05-02 Relisted — NWMLS as Distributed by MLS Grid
- 2014-04-30 Pending — NWMLS as Distributed by MLS Grid
- 2014-04-08 Price Changed $84,000 NWMLS as Distributed by MLS Grid
- 2014-03-31 Price Changed $89,000 NWMLS as Distributed by MLS Grid
- 2014-03-12 Relisted — NWMLS as Distributed by MLS Grid
- 2014-03-10 Pending — NWMLS as Distributed by MLS Grid
- 2014-02-06 Listed $92,000 NWMLS as Distributed by MLS Grid
Property tax history
+3.8%/yrLatest (2026): $1,759 · +11.5% YoY. Source: county tax records.
Cash-flow waterfall
monthlySold comps — $/sqft
last 12 mo · ≤1 miLoading sold comps…