331 Clark St · Starke, FL
Flood risk 1/10 · Minimal
- FEMA flood zone
- X (unshaded)
- Chance of flooding over 30 yrs
- 0.0%
- Est. flood insurance / yr
- $507 – $1,088
Fire risk 8/10 · Major
- Est. fire insurance / yr
- $947 – $1,759
Heat risk 8/10 · Major
- Hot days now (above 107°F)
- 7 days/yr
- Hot days in 30 yrs
- 21 days/yr
Wind risk 9/10 · Severe
- Chance of severe wind over 30 yrs
- 99.0%
Air-quality risk 3/10 · Minor
- Unhealthy air days now
- 3 days/yr
- Unhealthy air days in 30 yrs
- 3 days/yr
Risk factors via First Street. Map © Google.
Why this score? — see what drove the B- grade
The composite is a weighted blend of 9 inputs, each scored 0–100. Each bar is that input's sub-score; the figure is the points it added to the 100-point composite (weight × sub-score).
- Cash flow +29.2/30.0
- DSCR +10.0/10.0
- 1% rule +8.6/10.0
- ARV discount +7.5/15.0
- Schools +3.6/10.0
- Livability +3.6/5.0
- Rent growth +2.5/5.0
- Condition / age +2.5/5.0
- Appreciation +0.0/10.0
$129,999
🖨 Deal sheet 📄 Offer letter ✓ Due diligence
Listing remarks MLS
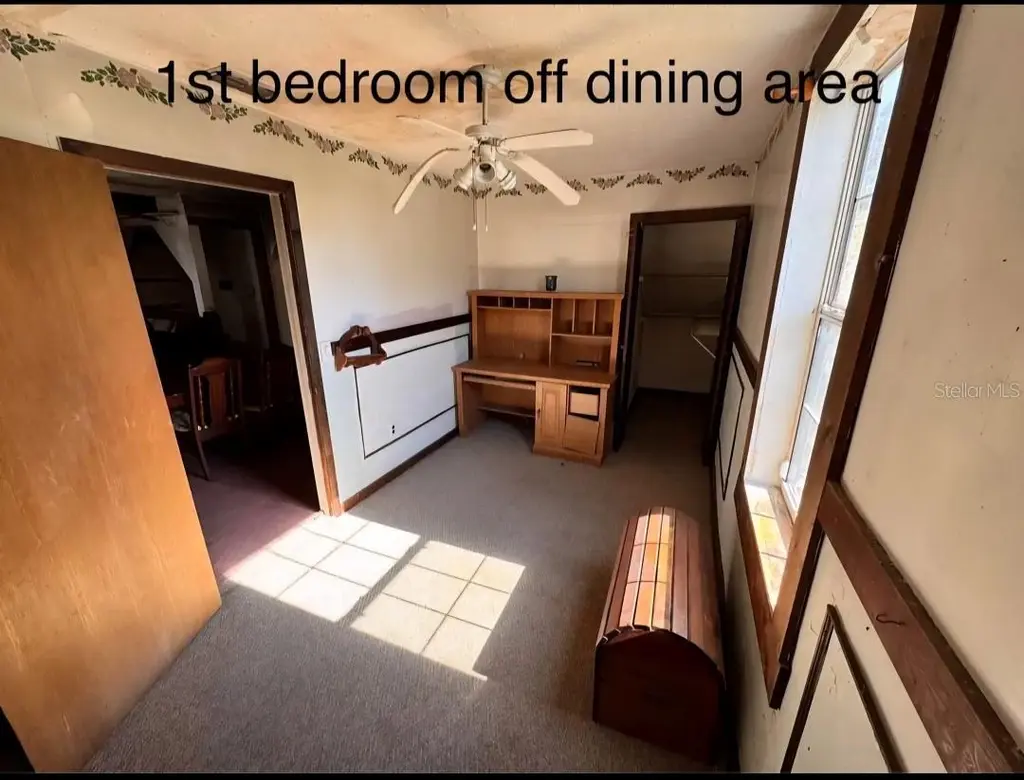
Conveniently located just north of Downtown Starke, this property offers easy access to shopping, restaurants, the movie theater, churches, and the post office. The main home features a 3-bedroom, 2-bath layout on the ground floor, along with a separate 1-bedroom, 1-bath upstairs apartment with its own private first-floor entrance. The apartment is completely independent and does not connect to the main living area, offering great potential for guests, rental income, or multi-generational living.
Key facts
- Separate apartment
- 6,090 sq ft lot
- Built 1930
Tags
Property features AI
Finance
- Other: Property type: Residential; Lot size about 0.14 acres; Living area about 2,778 square feet
- Financial info: No lease restrictions
- HOA & community: No association
Exterior
- Utilities: Public water; Public sewer; Electricity connected
- Home design: Single Family Residence; Two levels; Faces north
- Construction: Metal roof; Other construction materials; Other foundation details; Built on two levels
- Exterior features: Other exterior features; Paved road access
Interior
- Kitchen: Range; Refrigerator; Eat-in kitchen
- Bedrooms: 4 bedrooms
- Flooring: Other
- Bathrooms: 3 full bathrooms
- Heating & cooling: Other heating; Central air; Wall/window unit(s)
- Interior features: Ceiling fans; Eat-in kitchen; Gas fireplace
- Laundry & utility: Washer; Dryer; Laundry: Other
Neighborhood map
What this means for you Summary
Snapshot
- This is a 4-bed/2.0-bath single-family listed at $130k.
Deal economics
- At list price, monthly cash flow is $452 ($5k/yr) — positive.
- The deal already cash-flows at list — no discount required.
- Meets the 1% rule at list price ($2k rent vs $130k).
- Recommended offer: $128k (1.5% below list) — sets the bar for market timing.
- Cap rate 10.5% vs local median 3.5% in Starke — top-decile yield for the area; either an underpriced asset or a hidden risk that comps aren't pricing in. Stress-test before assuming the spread holds.
Location & tenants
- Location reads 72/100 on livability (#336 in FL) — a middle-class / working-renter tenant base. Strengths: cost of living A+, housing A+, health & safety A+; Watch: amenities D, commute F, employment F.
- Bradford (town): math 43% / reading 42% proficiency, ranked #57 of 73 in FL (top 78%) — families likely to look elsewhere, expect single-tenant / working-renter base with shorter leases; 60% free/reduced lunch — lower-income household profile, screen leases tightly.
- Market conditions: 153 active listings in the ZIP; 93 units permitted in Bradford County in 2024 (0 in 5+ unit buildings).
Forward outlook
- Local home prices are declining (-3.0%/yr); year-one equity from $899 of loan paydown is wiped out by about $4k of value loss. Plan a longer hold.
- Bradford County population projected at -25% by 2050 — secular population decline; favor cash flow + early exit over multi-decade hold.
- At projected returns (-3.0% appreciation + 3.0% rent growth), your $36k cash investment doubles in ~8 years — after that, you're playing with house money.
Negotiation context
- It's been on market 20 days — a 2% lower offer ($128k) is reasonable based on typical stale-listing flexibility.
- 5 sale attempts with the ask held roughly flat each time — persistent listings suggest the price (not the market) is what's stuck; bring a comps-based counter.
Risks & watch-outs
- Watch-outs: built in 1930 — expect roof / HVAC / electrical / plumbing capex.
- Climate carrying-cost: severe wind risk, 99% chance of damaging wind over 30y; severe wildfire risk; extreme-heat days projected 7→21/yr by 2055 (HVAC capex compounding) — expect insurance premiums to compound above CPI over the hold.
Questions for the listing agent
- Built in 1930 — when were the roof, HVAC, electrical panel, plumbing, and water heater last replaced?
- Is there a deadline driving the sale (1031 exchange, divorce, estate, relocation)? That informs how much negotiation room exists.
- What's the average days-on-market for RENTAL listings here right now (not sales)? A rising rental-DOM trend means longer vacancies and softer asking-rent achievability than the comps imply.
- What's the recent tenant-quality profile in this submarket — average credit score on applications, eviction rate, late-payment / NSF rate, and stable-employment percentage? A property-management company in the area should have these aggregated.
- How much new for-sale + rental construction is in the pipeline within 1–3 miles? Heavy new supply typically softens prices + rents 12–24 months out; constrained supply supports both.
Investment metrics
- 1% rule
- 1.36% ✓
- Cap rate
- 10.46%
- Cash-on-cash
- 14.89%
- DSCR
- 1.66
- GRM
- 6.1
CMA / ARV
- ARV (on-the-fly)
- $317,262
- Comps found
- 1
Show comp detail 1 sale within ~0.75 mi
| Address | Dist | Beds/Ba | Sqft | Sold | Price | $/sf | Match |
|---|---|---|---|---|---|---|---|
| 213 W Mimosa Dr | 0.74mi | 4/3.0 | 2,566 (-2%) | 17mo | $310,000 | $121 | 44 |
Match score weights: distance 35% · size 25% · config 20% · recency 20%. Top-matched comps best support the ARV.
Projected returns pro-forma
-3.0% appreciation · 3.0% rent growth · sell at horizon
- IRR
- 5.5%
- Equity multiple
- 1.21×
- Total profit
- $7,746
- Equity at exit
- $19,383
- IRR
- 14.9%
- Equity multiple
- 2.21×
- Total profit
- $43,995
- Equity at exit
- $11,240
Cash invested: $36,400 (down + closing). Projections, not guarantees.
Landlord ↔ Tenant lean methodology
- Overall (STATE)
- 87 Strongly Landlord-Friendly
- State Florida
- 87 Strongly Landlord-Friendly · R+3
- County
- — inherits STATE
- City
- — inherits STATE
ZIP-level market 32091
- Home prices YoY
- -10.6%
- Active inventory
- 153
- Price-to-rent
- 6.1×
Monthly cashflow live
- Estimated rent
- $1,766 medium interval (Pro) →
- Mortgage (P&I)
- −$682
- Tax from tax record
- −$208 /mo · $2,493/yr
- Insurance
- −$54
- HOA
- −$0
- Vacancy / Maint / Mgmt
- −$371
- Net cashflow
- $452
Break-even live
UW: 25.0% down · 7.5% · 30yr · 1.5% tax · 5.0% vac · 8.0% maint · 8.0% mgmt
Financing live
Cash to close
- Down payment
- $32,500
- Closing costs
- $3,900
- Reserves months
- —
- Total cash needed
- —
Loan-product check · same deal, 3 products live
Conventional
25% down · 7.5% · 30yr
- Down + closing
- —
- Monthly P&I
- —
- Monthly cashflow
- —
- DSCR
- —
- Eligible?
- —
Personal DTI + credit; lowest rate.
DSCR
20% down · 8.5% · 30yr
- Down + closing
- —
- Monthly P&I
- —
- Monthly cashflow
- —
- DSCR
- —
- Eligible?
- —
No personal income docs; deal must DSCR.
Hard money
10% down · 12.0% · 12mo
- Down + closing
- —
- Monthly P&I
- —
- Monthly cashflow
- —
- DSCR
- —
- Eligible?
- —
Short-term bridge; refi at stabilization.
Listing history 16 events
-
2026-06-03remarks 541-char remark
-
2026-06-03status $129,999 Pending 20 DOM
-
2026-06-02days on market $129,999 Active 20 DOM
-
2026-06-01days on market $129,999 Active 19 DOM
-
2026-05-31days on market $129,999 Active 18 DOM
-
2026-05-30days on market $129,999 Active 17 DOM
-
2026-05-13$129,999 Active
-
2026-05-02$129,999 Active 501-char remark
Show marketing remark (501 chars)
Conveniently located just north of Downtown Starke, this property offers easy access to shopping, restaurants, the movie theater, churches, and the post office. The main home features a 3-bedroom, 2-bath layout on the ground floor, along with a separate 1-bedroom, 1-bath upstairs apartment with its own private first-floor entrance. The apartment is completely independent and does not connect to the main living area, offering great potential for guests, rental income, or multi-generational living.
-
2026-04-16historical
-
2026-04-10price $104,900
-
2026-04-08$119,900 Active
-
2026-03-09historical
-
2026-03-02status Active
-
2026-02-28historical
-
2026-02-26price $134,000
-
2026-02-06$140,000 Active
ⓘ Source: listings_history table (triggers on properties + properties_extension) + one-shot
backfill from property_details.listing_events for pre-trigger history.
Tax reassessment forecast FL · Resets to sale price
- Current annual tax
- $2,493 · $208/mo
- Projected year-2 tax
- $2,493 · $208/mo
- Expected delta
- $0/yr ($0/mo · 0.0%)
ⓘ Screening estimate from a state-policy table — verify with the county assessor before closing.
Climate risk First Street
- Flood 1/10 Low FEMA zone X (unshaded) · 0% chance over 30 yrs
- Wildfire 8/10 Severe
- Heat 8/10 Severe 7 d/yr ≥107°F today · 21 d/yr by 30 yrs out
- Wind 9/10 Extreme 99% chance of damaging wind over 30 yrs
- Air quality 3/10 Moderate 3 unhealthy d/yr today · 3 by 30 yrs out
Nearby sold comps map
Loading sold comps map…
Walkable amenities ~0.75 mi
Loading nearby amenities…
Taxation est. · year 1
- Rental income
- $21,193
- − Mortgage interest
- −$7,282
- − Property taxes
- −$2,493
- − Insurance
- −$650
- − Repairs & maintenance
- −$1,695
- − Management
- −$1,695
- − Depreciation
- −$3,782
- Taxable income
- $3,595
- Est. tax owed @ 24.0%
- −$863
- After-tax cash flow
- $4,555/yr
For passive investors: Depreciation is non-cash, so a rental often shows a tax loss while cash-flowing — sheltering income. Rental losses are passive: they offset passive income freely, and up to $25,000/yr can offset ordinary (W-2) income if you actively participate and your MAGI is under $100k (phasing out to $0 by $150k); unused losses carry forward. On sale, claimed depreciation is recaptured at up to 25%, and gains may owe capital-gains tax (a 1031 exchange can defer both). Figures are a year-1 estimate at your 24.0% rate — not tax advice; consult a CPA.
Schools (NCES district)
- District
- Bradford
- NCES district ID
- 1200120
- Math proficiency
- 43% ▼ -9.00%
- Reading proficiency
- 42% ▼ -3.00%
- Median HH income
- $41,661
- Composite
- 35.78/100
- National rank
- #4840
- State rank
- #57 of 73 in FL
Livability — Starke
- Score
- 72/100
- State rank
- #336
- US rank
- #5839
Category grades
Schools grade is shown separately in the Schools card above.
Census & demographics
- Census place
- Starke, FL
- City population
- 16,062
- Population (ZIP)
- 16,062
Population outlook (Bradford County) Hauer SSP2
- Today (2025)
- 24,999 people
- By 2030
- 23,895 · -4.4%
- By 2040
- 21,329 · -14.7%
- By 2050
- 18,681 · -25.3%
- By 2075
- 13,557 · -45.8%
- By 2100
- 9,228 · -63.1%
Race, ethnicity, and origin ACS 2023
- Neighborhood character
- Predominantly White (69%)
- Race & ethnicity
- White 69% Black 20% Hispanic / Latino 6% Two or more races 6%
- Hispanic origin (detail)
- Puerto Rican 4%
- Common ancestry
- Lithuanian 3% Serbian 1% Slovak 1%
- Foreign-born
- 3% · Canada, Mexico, Jamaica
- Languages at home
- 97% English-only · Spanish 2%
Political lean MEDSL · Bradford
- 2024 margin
- Solid R (+57.2) · D 21.1% · R 78.4%
- 2008→2024 swing
- -16.9pp toward R · 2008: -40.3pp · 2024: -57.2pp
- All cycles
- 2024: R+57.2 2020: R+52.6 2016: R+49.5 2012: R+42.1 2008: R+40.3
Not yet ingested
- Civics
- —
Market trends
- HPI YoY
- ▼ -36.09%
- Current HPI
- 305.3668
- Rent YoY
- —
- Metro
- —
- State GDP YoY
- ▲ 3.28%
- F500 in state
- 36
Industry mix (Fortune 500 HQ in FL)
| Industry | F500 HQs | Revenue |
|---|---|---|
| Industrial Technology | 2 | $29B |
|
||
| Insurance | 2 | $17B |
|
||
| Retail | 1 | $60B |
|
||
| Technology Distribution | 1 | $58B |
|
||
| Homebuilding | 1 | $35B |
|
||
| Technology Manufacturing | 1 | $35B |
|
||
Price history
-7.1% since first listed10 events — show timeline
- 2026-05-13 Listed $129,999 Stellar MLS as Distributed by MLS Grid
- 2026-05-02 Listed $129,999 realMLS
- 2026-04-16 Listing Removed — Stellar MLS as Distributed by MLS Grid
- 2026-04-10 Price Changed $104,900 Stellar MLS as Distributed by MLS Grid
- 2026-04-08 Listed $119,900 Stellar MLS as Distributed by MLS Grid
- 2026-03-09 Listing Removed — Stellar MLS as Distributed by MLS Grid
- 2026-03-02 Relisted — Stellar MLS as Distributed by MLS Grid
- 2026-02-28 Listing Removed — Stellar MLS as Distributed by MLS Grid
- 2026-02-26 Price Changed $134,000 Stellar MLS as Distributed by MLS Grid
- 2026-02-06 Listed $140,000 Stellar MLS as Distributed by MLS Grid
Property tax history
+7.6%/yrLatest (2025): $2,493 · +8.4% YoY. Source: county tax records.
Cash-flow waterfall
monthlySold comps — $/sqft
last 12 mo · ≤1 miLoading sold comps…