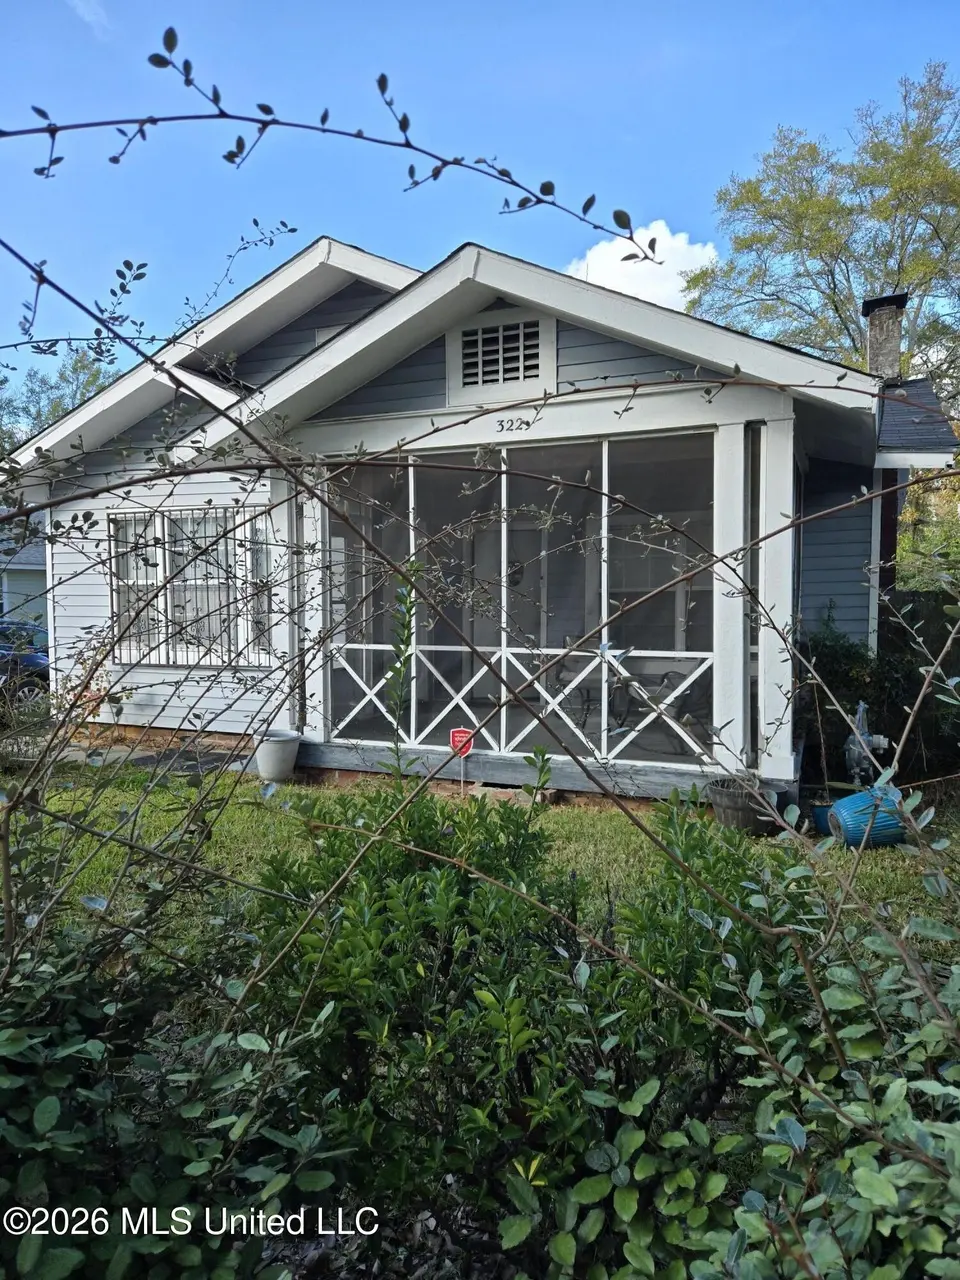
322 S Westview St · Jackson, MS
Flood risk 1/10 · Minimal
- FEMA flood zone
- X (unshaded)
- Chance of flooding over 30 yrs
- 0.0%
- Est. flood insurance / yr
- $507 – $1,088
Fire risk 1/10 · Minimal
- Est. fire insurance / yr
- $1,241 – $2,305
Heat risk 7/10 · Major
- Hot days now (above 108°F)
- 7 days/yr
- Hot days in 30 yrs
- 20 days/yr
Wind risk 8/10 · Major
- Chance of severe wind over 30 yrs
- 80.0%
Air-quality risk 1/10 · Minimal
- Unhealthy air days now
- 0 days/yr
- Unhealthy air days in 30 yrs
- 0 days/yr
Risk factors via First Street. Map © Google.
Why this score? — see what drove the B+ grade
The composite is a weighted blend of 9 inputs, each scored 0–100. Each bar is that input's sub-score; the figure is the points it added to the 100-point composite (weight × sub-score).
- Cash flow +30.0/30.0
- ARV discount +15.0/15.0
- 1% rule +10.0/10.0
- DSCR +10.0/10.0
- Rent growth +4.0/5.0
- Livability +3.4/5.0
- Condition / age +2.5/5.0
- Schools +1.1/10.0
- Appreciation +0.0/10.0
$69,000
🖨 Deal sheet 📄 Offer letter ✓ Due diligence
Listing remarks
Great Investment property located close to downtown Jackson where many houses are being remodeled.
Key facts
- 0.5 acre lot
- Listed 7 days
Tags
Property features AI
Exterior
- Parking: Driveway
- Utilities: Public water; Public sewer; Electricity available; Natural gas available
- Home design: Single-family house; One level
- Construction: Wood siding; Conventional foundation; Built as single family residence
- Exterior features: Shingle roof; Lot approximately 0.5 acre
Interior
- Flooring: Laminate; Tile
- Bathrooms: 1 bathroom
- Heating & cooling: Central heating (natural gas); Central air; Ceiling fan(s)
- Interior features: Laminate and tile flooring
Neighborhood map
What this means for you Summary
Snapshot
- This is a 3-bed/1.0-bath single-family listed at $69k.
Deal economics
- At list price, monthly cash flow is $434 ($5k/yr) — positive.
- The deal already cash-flows at list — no discount required.
- Meets the 1% rule at list price ($1k rent vs $69k).
- Cap rate 13.8% vs local median 9.9% in Jackson — top-decile yield for the area; either an underpriced asset or a hidden risk that comps aren't pricing in. Stress-test before assuming the spread holds.
Location & tenants
- Location reads 68/100 on livability (#66 in MS) — a middle-class / working-renter tenant base. Strengths: commute A+, cost of living A+, housing A+; Watch: schools F, amenities F, employment F.
- Jackson Public School District (urban): math 9% / reading 18% proficiency, ranked #112 of 130 in MS (top 86%) — low school quality limits family demand, transient renter base, plan for 1-2y turnover; 88% free/reduced lunch — lower-income household profile, screen leases tightly.
- Market conditions: Rents rising fast (+5.9%/yr); 40 active listings in the ZIP; 20 comparable units currently listed for rent nearby; rentals at typical pace (median 23d on market — plan ~3-4 weeks tenant-placement turnaround); lower-income renter base — watch delinquency; 167 units permitted in Hinds County in 2024 (0 in 5+ unit buildings).
- This rent runs 35% of the median local income ($39k/yr) — at the standard rent-burdened threshold; future hikes will face affordability resistance.
Forward outlook
- Local home prices are declining (-3.0%/yr); year-one equity from $477 of loan paydown is wiped out by about $2k of value loss. Plan a longer hold.
- Hinds County population projected to shrink 6% by 2050 — rents likely to lag national; underwrite the cash flow, not the appreciation.
- At projected returns (-3.0% appreciation + 5.9% rent growth), your $19k cash investment doubles in ~5 years — after that, you're playing with house money.
Negotiation context
- Only 7 days on market — expect competitive offers; lowballing is unlikely to land.
- 6 sale attempts since 6y ago with the ask held roughly flat each time — persistent listings suggest the price (not the market) is what's stuck; bring a comps-based counter.
Risks & watch-outs
- Watch-outs: built in 1930 — expect roof / HVAC / electrical / plumbing capex.
- Climate carrying-cost: severe wind risk, 80% chance of damaging wind over 30y; extreme-heat days projected 7→20/yr by 2055 (HVAC capex compounding) — expect insurance premiums to compound above CPI over the hold.
Questions for the listing agent
- Built in 1930 — when were the roof, HVAC, electrical panel, plumbing, and water heater last replaced?
- Is there a deadline driving the sale (1031 exchange, divorce, estate, relocation)? That informs how much negotiation room exists.
- Schools are F-rated, which usually means shorter tenancies and higher turnover. Who's the typical renter profile here, and what's been the actual vacancy rate?
- What's the average days-on-market for RENTAL listings here right now (not sales)? A rising rental-DOM trend means longer vacancies and softer asking-rent achievability than the comps imply.
- What's the recent tenant-quality profile in this submarket — average credit score on applications, eviction rate, late-payment / NSF rate, and stable-employment percentage? A property-management company in the area should have these aggregated.
- How much new for-sale + rental construction is in the pipeline within 1–3 miles? Heavy new supply typically softens prices + rents 12–24 months out; constrained supply supports both.
Investment metrics
- 1% rule
- 1.64% ✓
- Cap rate
- 13.84%
- Cash-on-cash
- 26.95%
- DSCR
- 2.20
- GRM
- 5.1
CMA / ARV
- ARV (on-the-fly)
- $119,700
- Comps found
- 5
Show comp detail 5 sales within ~0.75 mi
| Address | Dist | Beds/Ba | Sqft | Sold | Price | $/sf | Match |
|---|---|---|---|---|---|---|---|
| 193 E Bell St | 0.22mi | 3/1.0 | 1,207 (+1%) | 12mo | $120,500 | $100 | 78 |
| 2003 N Lamar St | 0.44mi | 2/1.0 (-1) | 1,079 (-10%) | 9mo | $99,900 | $93 | 50 |
| 1017 Riverview Dr | 0.74mi | 2/1.0 (-1) | 1,208 (+1%) | 21mo | $56,000 | $46 | 42 |
| 1710 Pine St | 0.71mi | 2/2.0 (-1) | 1,352 (+13%) | 1mo | $203,900 | $151 | 36 |
| 944 Poplar Blvd | 0.67mi | 2/0.5 (-1) | 1,028 (-14%) | 12mo | $215,000 | $209 | 28 |
Match score weights: distance 35% · size 25% · config 20% · recency 20%. Top-matched comps best support the ARV.
Projected returns pro-forma
-3.0% appreciation · 5.91% rent growth · sell at horizon
- IRR
- 24.1%
- Equity multiple
- 2.03×
- Total profit
- $19,866
- Equity at exit
- $10,288
- IRR
- 33.7%
- Equity multiple
- 4.51×
- Total profit
- $67,737
- Equity at exit
- $5,966
Cash invested: $19,320 (down + closing). Projections, not guarantees.
Landlord ↔ Tenant lean methodology
- Overall (STATE)
- 90 Strongly Landlord-Friendly
- State Mississippi
- 90 Strongly Landlord-Friendly · R+11
- County
- — inherits STATE
- City
- — inherits STATE
ZIP-level market 39202
- Home prices YoY
- -23.3%
- Rents YoY
- 5.9%
- Active inventory
- 40
- Price-to-rent
- 5.1×
Monthly cashflow live
- Estimated rent
- $1,130 high interval (Pro) →
- Mortgage (P&I)
- −$362
- Tax from tax record
- −$68 /mo · $814/yr
- Insurance
- −$29
- HOA
- −$0
- Vacancy / Maint / Mgmt
- −$237
- Net cashflow
- $434
Break-even live
UW: 25.0% down · 7.5% · 30yr · 1.5% tax · 5.0% vac · 8.0% maint · 8.0% mgmt
Financing live
Cash to close
- Down payment
- $17,250
- Closing costs
- $2,070
- Reserves months
- —
- Total cash needed
- —
Loan-product check · same deal, 3 products live
Conventional
25% down · 7.5% · 30yr
- Down + closing
- —
- Monthly P&I
- —
- Monthly cashflow
- —
- DSCR
- —
- Eligible?
- —
Personal DTI + credit; lowest rate.
DSCR
20% down · 8.5% · 30yr
- Down + closing
- —
- Monthly P&I
- —
- Monthly cashflow
- —
- DSCR
- —
- Eligible?
- —
No personal income docs; deal must DSCR.
Hard money
10% down · 12.0% · 12mo
- Down + closing
- —
- Monthly P&I
- —
- Monthly cashflow
- —
- DSCR
- —
- Eligible?
- —
Short-term bridge; refi at stabilization.
Rent comps 20 comps
| Address | Beds | Baths | Sqft | Rent | $/sqft | DOM | Units | Dist |
|---|---|---|---|---|---|---|---|---|
| 950 North St Jackson, MS | 2.0 | 1.0 | 1000 | $1,295 | $1.29 | 13d | 1 | 0.47mi |
| 910 Morningside St Jackson, MS | 3.0 | 2.5 | 1400 | $1,395 | $1.00 | 43d | 1 | 0.54mi |
| 731 N Jefferson St Jackson, MS | 2.0 | 2.0 | 840 | $944 | $1.12 | 13d | 3 | 0.60mi |
| 949 Morningside St Jackson, MS | 2.0 | 1.0 | 900 | $965 | $1.07 | 23d | 1 | 0.62mi |
| 948 Bellevue Pl Jackson, MS | 2.0 | 1.0 | 750 | $855 | $1.14 | 13d | 1 | 0.64mi |
| 850 N Jefferson St Jackson, MS | 1.0–2.0 | 1.0–2.0 | 880 | $1,099 | $1.25 | 13d | 4 | 0.64mi |
| 1225 Bailey Ave Jackson, MS | 2.0 | 1.0 | 990 | $750 | $0.76 | 43d | 1 | 0.66mi |
| 1043 Carlisle St Jackson, MS | 2.0 | 1.0 | 750 | $905 | $1.21 | 23d | 1 | 0.69mi |
| 1313 Hazel St Unit 2 Jackson, MS | 2.0 | 1.0 | 850 | $995 | $1.17 | 23d | 1 | 0.72mi |
| 836 Riverview Dr Jackson, MS | 2.0 | 1.5 | 945 | $1,095 | $1.16 | 23d | 1 | 0.81mi |
| 1202 E Fortification St Jackson, MS | 2.0 | 1.0 | 1225 | $1,150 | $0.94 | 23d | 1 | 0.82mi |
| 1140 Greymont Ave Jackson, MS | 1.0–2.0 | 1.0–2.0 | 835 | $1,250 | $1.50 | 13d | 6 | 0.96mi |
| 1140 Greymont Ave Unit C13 Jackson, MS | 2.0 | 2.0 | 1050 | $1,250 | $1.19 | 43d | 1 | 0.96mi |
| 209 Poindexter St Jackson, MS | 2.0 | 2.0 | 1075 | $825 | $0.77 | 43d | 1 | 1.11mi |
| 2566 Williamson Ave Jackson, MS | 3.0 | 1.5 | 940 | $1,150 | $1.22 | 43d | 1 | 1.29mi |
| 1204 First Ave Jackson, MS | 2.0 | 1.0 | 800 | $725 | $0.91 | 23d | 1 | 1.31mi |
| 137 Sivley Ave Jackson, MS | 3.0 | 1.0 | 1288 | $1,000 | $0.78 | 21d | 1 | 1.40mi |
| 509 Lorenz Blvd Jackson, MS | 2.0 | 1.0 | 850 | $995 | $1.17 | 23d | 1 | 1.45mi |
| 2157 Ludlow Ave Jackson, MS | 3.0 | 2.0 | 1123 | $1,300 | $1.16 | 43d | 1 | 1.48mi |
| 2157 Ludlow Ave Unit Na Jackson, MS | 3.0 | 2.0 | 1123 | $1,450 | $1.29 | 13d | 1 | 1.48mi |
Listing history 7 events
-
2026-06-18days on market $69,000 Active 7 DOM
-
2026-06-17days on market $69,000 Active 6 DOM
-
2026-06-16days on market $69,000 Active 5 DOM
-
2026-06-15days on market $69,000 Active 4 DOM
-
2026-06-14days on market $69,000 Active 2 DOM
-
2026-06-13remarks 98-char remark
-
2026-06-13$69,000 Active 1 DOM
ⓘ Source: listings_history table (triggers on properties + properties_extension) + one-shot
backfill from property_details.listing_events for pre-trigger history.
Tax reassessment forecast MS · Resets to sale price
- Current annual tax
- $814 · $68/mo
- Projected year-2 tax
- $814 · $68/mo
- Expected delta
- $0/yr ($0/mo · 0.0%)
ⓘ Screening estimate from a state-policy table — verify with the county assessor before closing.
Climate risk First Street
- Flood 1/10 Low FEMA zone X (unshaded) · 0% chance over 30 yrs
- Wildfire 1/10 Low
- Heat 7/10 Severe 7 d/yr ≥108°F today · 20 d/yr by 30 yrs out
- Wind 8/10 Severe 80% chance of damaging wind over 30 yrs
- Air quality 1/10 Low 0 unhealthy d/yr today · 0 by 30 yrs out
Nearby sold comps map
Loading sold comps map…
Walkable amenities ~0.75 mi
Loading nearby amenities…
Taxation est. · year 1
- Rental income
- $13,554
- − Mortgage interest
- −$3,865
- − Property taxes
- −$814
- − Insurance
- −$345
- − Repairs & maintenance
- −$1,084
- − Management
- −$1,084
- − Depreciation
- −$2,007
- Taxable income
- $4,355
- Est. tax owed @ 24.0%
- −$1,045
- After-tax cash flow
- $4,162/yr
For passive investors: Depreciation is non-cash, so a rental often shows a tax loss while cash-flowing — sheltering income. Rental losses are passive: they offset passive income freely, and up to $25,000/yr can offset ordinary (W-2) income if you actively participate and your MAGI is under $100k (phasing out to $0 by $150k); unused losses carry forward. On sale, claimed depreciation is recaptured at up to 25%, and gains may owe capital-gains tax (a 1031 exchange can defer both). Figures are a year-1 estimate at your 24.0% rate — not tax advice; consult a CPA.
Schools (NCES district)
- District
- Jackson Public School District
- NCES district ID
- 2802190
- Math proficiency
- 9% ▼ -14.00%
- Reading proficiency
- 18% ▼ -7.00%
- Median HH income
- $33,234
- Composite
- 10.89/100
- National rank
- #9755
- State rank
- #112 of 130 in MS
Livability — Jackson
- Score
- 68/100
- State rank
- #66
- US rank
- #9695
Category grades
Schools grade is shown separately in the Schools card above.
Census & demographics
- Census place
- Jackson, MS
- County
- Hinds County · 167,040 people
- City population
- 140,204
- Metro
- Jackson, MS
- Population (ZIP)
- 6,832
- Household income
- $38,554
- Rent vs Own
- Severe rent burden
- 628.0
Population outlook (Hinds County) Hauer SSP2
- Today (2025)
- 242,528 people
- By 2030
- 241,113 · -0.6%
- By 2040
- 235,557 · -2.9%
- By 2050
- 226,946 · -6.4%
- By 2075
- 199,995 · -17.5%
- By 2100
- 164,165 · -32.3%
Race, ethnicity, and origin ACS 2023
- Neighborhood character
- Majority Black (54%)
- Race & ethnicity
- Black 54% White 41% Two or more races 4% Hispanic / Latino 1%
- Common ancestry
- Italian 3% Lithuanian 2% Slovak 1%
- Foreign-born
- 2% · Canada
- Languages at home
- 96% English-only · Spanish 2%
Political lean MEDSL · Hinds
- 2024 margin
- Solid D (+46.1) · D 72.4% · R 26.3% · Other 1.4%
- 2008→2024 swing
- +7.1pp toward D · 2008: 39.0pp · 2024: 46.1pp
- All cycles
- 2024: D+46.1 2020: D+48.3 2016: D+43.7 2012: D+45.1 2008: D+39.0
Not yet ingested
- Civics
- —
Market trends
- HPI YoY
- ▼ -44.29%
- Current HPI
- 145.4466
- Rent YoY
- ▲ 5.91%
- Metro
- Jackson, MS
- State GDP YoY
- —
- F500 in state
- 0
Price history
+53.7% since first listed20 events — show timeline
- 2026-06-11 Listed $69,000 MLSU
- 2026-04-16 Listing Removed — MLSU
- 2026-03-03 Price Changed $79,900 MLSU
- 2026-01-26 Price Changed $84,500 MLSU
- 2025-12-17 Listed $104,500 MLSU
- 2025-10-30 Listing Removed — MLSU
- 2025-10-03 Price Changed $86,000 MLSU
- 2025-08-29 Listed $91,000 MLSU
- 2021-08-02 Sold (Public Records) — Public Records
- 2021-08-02 Sold (MLS) — MLSU
- 2021-06-17 Listed $60,500 MLSU
- 2021-01-26 Listing Removed — MLSU
- 2020-12-04 Listed $48,500 MLSU
- 2020-10-16 Sold (MLS) — MLSU
- 2020-10-15 Sold (Public Records) — Public Records
- 2020-09-27 Listed $44,900 MLSU
- 2019-08-26 Sold (Public Records) — Public Records
- 2013-08-05 Sold (Public Records) — Public Records
- 1989-03-16 Sold (Public Records) — Public Records
- 1973-08-20 Sold (Public Records) — Public Records
Property tax history
+0.8%/yrLatest (2025): $814 · +0.2% YoY. Source: county tax records.
Cash-flow waterfall
monthlySold comps — $/sqft
last 12 mo · ≤1 miLoading sold comps…