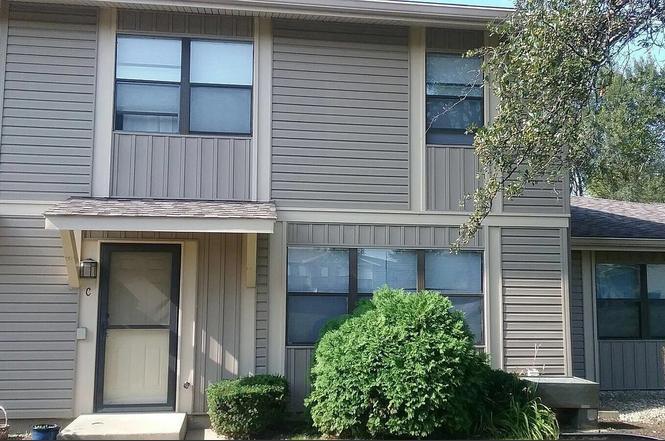
5715 Dutch Mill Ct Unit C · Hanover Park, IL
Flood risk 1/10 · Minimal
- FEMA flood zone
- X (unshaded)
- Chance of flooding over 30 yrs
- 0.0%
- Est. flood insurance / yr
- $507 – $1,088
Fire risk 1/10 · Minimal
- Est. fire insurance / yr
- $804 – $1,492
Heat risk 3/10 · Minor
- Hot days now (above 102°F)
- 7 days/yr
- Hot days in 30 yrs
- 14 days/yr
Wind risk 2/10 · Minimal
- Chance of severe wind over 30 yrs
- 0.0%
Air-quality risk 3/10 · Minor
- Unhealthy air days now
- 3 days/yr
- Unhealthy air days in 30 yrs
- 3 days/yr
Risk factors via First Street. Map © Google.
Why this score? — see what drove the D- grade
The composite is a weighted blend of 9 inputs, each scored 0–100. Each bar is that input's sub-score; the figure is the points it added to the 100-point composite (weight × sub-score).
- Cash flow +11.4/30.0
- ARV discount +7.5/15.0
- 1% rule +4.9/10.0
- Livability +3.9/5.0
- Schools +3.6/10.0
- DSCR +3.3/10.0
- Rent growth +2.5/5.0
- Condition / age +2.5/5.0
- Appreciation +0.0/10.0
$255,000
🖨 Deal sheet (PDF) 📄 Offer letter ✓ Due diligence
Listing remarks
Discover comfort, convenience, and incredible value at 5715 Dutch Mill Ct, Unit C in Hanover Park! This move-in ready 3-bedroom, 1.5-bath home sits in a peaceful cul-de-sac and features bright living spaces, a functional kitchen, and three spacious bedrooms. Enjoy the upgrades you want most-new furnace, water heater, stove, microwave, washer, dryer, and garage door opener system-all replaced within the last year! With major systems already taken care of, this home offers low-maintenance living from day one. Perfect for homeowners or investors, this property provides strong rental potential thanks to its desirable layout, attached garage, and close proximity to parks, schools, shopping, and
Key facts
- New furnace
- New stove
- New water heater
Tags
Property features AI
Finance
- Other: Four-unit building; Living area sourced from appraiser; Property owned fee simple with homeowners association
- HOA & community: Monthly association fee of $315; HOA covers insurance, exterior maintenance, lawn care, trash (scavenger) and snow removal; Pets allowed with additional pet rent
Exterior
- Parking: Attached garage (garage owned) with concrete driveway — 1 garage space, 1 total parking space
- Utilities: Public water service; Public sewer service
- Home design: Attached single property; Townhouse — 2 story; Entry level 1; Located in Hanover Park
- Construction: Built 41–50 years ago; Aluminum siding; Asphalt roof; Concrete perimeter foundation
- Exterior features: Public water; Public sewer
Interior
- Kitchen: Range; Microwave; Dishwasher; Refrigerator; Garbage disposal
- Bedrooms: Three bedrooms (master and two additional bedrooms on second level)
- Flooring: Wood laminate flooring in living areas, kitchen, dining room, family room and bedrooms
- Bathrooms: One full bathroom; One half bathroom
- Heating & cooling: Natural gas forced-air heating; Central air conditioning
- Interior features: Six total rooms; Some photos are virtually staged
- Laundry & utility: In-unit laundry (washer and dryer); Utility / laundry room on main level
Neighborhood map
What this means for you Summary
Snapshot
- This is a 3-bed/1.5-bath condo listed at $255k.
Deal economics
- At list price, monthly cash flow is $-88 ($-1k/yr) — negative.
- To cash-flow at today's rent, offer at most $239k (6.1% below list).
- To meet the 1% rule (rent ≥ 1% of price), the offer needs to be $252k (1.0% below list).
- Recommended offer: $224k (12.0% below list) — sets the bar for market timing.
- Cap rate 5.9% vs local median 4.5% in Hanover Park — top-decile yield for the area; either an underpriced asset or a hidden risk that comps aren't pricing in. Stress-test before assuming the spread holds.
Location & tenants
- Location reads 78/100 on livability (#150 in IL, #2,740 nationally) — a middle-class / working-renter tenant base. Strengths: crime A+, employment A+, housing A+; Watch: health & safety D+, amenities F.
- Lake Park Chsd 108 (suburban): math 37% / reading 43% proficiency, ranked #128 of 620 in IL (top 21%) — families likely to look elsewhere, expect single-tenant / working-renter base with shorter leases.
- Zoned schools: Greenbrook Elem School (math 12% / reading 13%, grade F, #1,368 of 2,056 statewide, top 67%, 428 students, 0% FRL); Spring Wood Middle School (math 12% / reading 20%, grade F, #488 of 665 statewide, top 74%, 450 students, 0% FRL); Lake Park High School (math 37% / reading 43%, grade F, #85 of 693 statewide, top 12%, 2,560 students, 0% FRL).
- Zoned-school proficiency averages 23% at this address vs 40% district-wide (-17 pts) — the specific schools serving this property underperform the Lake Park Chsd 108 average; the district grade overstates school quality for this exact location.
- Market conditions: 58 active listings in the ZIP; 11 comparable units currently listed for rent nearby; rentals leasing fast (median 13d on market — plan ~1-2 weeks tenant-placement turnaround); solid renter incomes; 1,378 units permitted in DuPage County in 2024 (594 in 5+ unit buildings).
- This rent runs 33% of the median local income ($92k/yr) — at the standard rent-burdened threshold; future hikes will face affordability resistance.
Forward outlook
- Local home prices are declining (-3.0%/yr); year-one equity from $2k of loan paydown is wiped out by about $8k of value loss. Plan a longer hold.
Negotiation context
- It's been on market 194 days — a 12% lower offer ($224k) is reasonable based on typical stale-listing flexibility.
- Current owner paid $149k; list at $255k implies a 71% gain — meaningful room to come down on a strong offer.
Questions for the listing agent
- What do current leases actually rent for vs. the listed asking? Can we see a recent rent roll and the last 12 months of T-12 income?
- It's been on market 194 days. Have you received any prior offers? Is the seller open to a 12% concession, seller financing, or rate buy-down credit?
- Built in 1977 — when were the roof, HVAC, electrical panel, plumbing, and water heater last replaced?
- What does the HOA fee cover, when was the last increase, and are there any pending special assessments or reserve-fund shortfalls?
- Any open or pending special assessments — roof, HVAC, plumbing, elevator, façade? What's the per-unit balance and payoff schedule, and is the seller paying it off at close or rolling it to the buyer?
- Why hasn't it sold? Are there any deal-killer items the seller is aware of (foundation, flood, title, zoning, code violations)?
- Is there a deadline driving the sale (1031 exchange, divorce, estate, relocation)? That informs how much negotiation room exists.
- Schools are F-rated, which usually means shorter tenancies and higher turnover. Who's the typical renter profile here, and what's been the actual vacancy rate?
- The area grade is low — what's the realistic commute time and amenity access for the typical tenant pool here? Any planned neighborhood developments (good or bad) we should know about?
- What's the average days-on-market for RENTAL listings here right now (not sales)? A rising rental-DOM trend means longer vacancies and softer asking-rent achievability than the comps imply.
- What's the recent tenant-quality profile in this submarket — average credit score on applications, eviction rate, late-payment / NSF rate, and stable-employment percentage? A property-management company in the area should have these aggregated.
- How much new apartment / multifamily construction is in the pipeline within 1–3 miles? Heavy new supply (>2% of stock underway) typically softens rents 12–24 months out; light construction supports rent growth.
Investment metrics
- 1% rule
- 0.99% ✗
- Cap rate
- 5.88%
- Cash-on-cash
- -1.48%
- DSCR
- 0.93
- GRM
- 8.4
CMA / ARV
No comps found within radius.
Projected returns pro-forma
-3.0% appreciation · 3.0% rent growth · sell at horizon
- IRR
- -18.6%
- Equity multiple
- 0.35×
- Total profit
- $-46,679
- Equity at exit
- $38,021
- IRR
- -10.8%
- Equity multiple
- 0.34×
- Total profit
- $-46,896
- Equity at exit
- $22,048
Cash invested: $71,400 (down + closing). Projections, not guarantees.
Landlord ↔ Tenant lean methodology
- Overall (STATE)
- 43 Moderately Tenant-Leaning
- State Illinois
- 43 Moderately Tenant-Leaning · D+7
- County
- — inherits STATE
- City
- — inherits STATE
ZIP-level market 60133
- Active inventory
- 58
- Price-to-rent
- 8.4×
Monthly cashflow live
- Estimated rent
- $2,523 high interval (Pro) →
- Mortgage (P&I)
- −$1,337
- Tax from tax record
- −$323 /mo · $3,874/yr
- Insurance
- −$106
- HOA
- −$315
- Vacancy / Maint / Mgmt
- −$530
- Net cashflow
- $-88
Break-even live
Sensitivity live
| Price | -10% $57 | -5% $-16 | +0% $-88 | +5% $-160 | +10% $-232 |
|---|---|---|---|---|---|
| Rent | -10% $-287 | -5% $-187 | +0% $-88 | +5% $12 | +10% $112 |
| Rate | -1.0pp $41 | -0.5pp $-23 | base $-88 | +0.5pp $-154 | +1.0pp $-221 |
UW: 25.0% down · 7.5% · 30yr · 1.5% tax · 5.0% vac · 8.0% maint · 8.0% mgmt
Financing live
Cash to close
- Down payment
- $63,750
- Closing costs
- $7,650
- Reserves months
- —
- Total cash needed
- —
Loan-product check · same deal, 3 products live
Conventional
25% down · 7.5% · 30yr
- Down + closing
- —
- Monthly P&I
- —
- Monthly cashflow
- —
- DSCR
- —
- Eligible?
- —
Personal DTI + credit; lowest rate.
DSCR
20% down · 8.5% · 30yr
- Down + closing
- —
- Monthly P&I
- —
- Monthly cashflow
- —
- DSCR
- —
- Eligible?
- —
No personal income docs; deal must DSCR.
Hard money
10% down · 12.0% · 12mo
- Down + closing
- —
- Monthly P&I
- —
- Monthly cashflow
- —
- DSCR
- —
- Eligible?
- —
Short-term bridge; refi at stabilization.
Rent comps 11 comps
| Address | Beds | Baths | Sqft | Rent | $/sqft | DOM | Units | Dist |
|---|---|---|---|---|---|---|---|---|
| 5850 Fresno Ct Unit C Hanover Park, IL | 3.0 | 2.0 | 1062 | $2,500 | $2.35 | 1d | 1 | 0.16mi |
| 5546 W Celebrity Cir Hanover Park, IL | 3.0 | 2.0 | 1336 | $2,850 | $2.13 | 5d | 1 | 0.31mi |
| 6048 Kit Carson Dr #6048 Hanover Park, IL | 2.0 | 1.0 | 956 | $2,200 | $2.30 | 26d | 1 | 0.64mi |
| 1440 Sutter Dr #1440 Hanover Park, IL | 2.0 | 1.0 | 924 | $1,895 | $2.05 | 9d | 1 | 0.71mi |
| 6155 Kit Carson Dr Hanover Park, IL | 2.0 | 1.5 | 944 | $1,900 | $2.01 | 26d | 1 | 0.73mi |
| 6334 Nugget Cir Hanover Park, IL | 3.0 | 2.5 | 1336 | $2,300 | $1.72 | 26d | 1 | 0.83mi |
| 485 Nicole Dr Apt D Bartlett, IL | 2.0 | 1.5 | 972 | $1,950 | $2.01 | 1d | 1 | 1.00mi |
| 467 Valleyview Dr Bartlett, IL | 3.0 | 2.0 | 1173 | $3,000 | $2.56 | 0d | 1 | 1.06mi |
| 1942 Heron Ave Unit B Schaumburg, IL | 2.0 | 2.0 | 1050 | $2,200 | $2.10 | 26d | 1 | 1.31mi |
| 1971 Lilac Ct Schaumburg, IL | 2.0 | 2.5 | 1300 | $2,450 | $1.88 | 17d | 1 | 1.36mi |
| 1733 Howe Ln Hanover Park, IL | 2.0 | 1.0 | 1010 | $1,900 | $1.88 | 12d | 1 | 1.47mi |
HOA detail condo
- Monthly dues
- $315 · $3,780/yr
- Likely covers
- water
- Assessments
- None detected in remarks — confirm with the listing agent.
Listing history 26 events
-
2026-06-21days on market $255,000 Active 194 DOM
-
2026-06-18days on market $255,000 Active 191 DOM
-
2026-06-17days on market $255,000 Active 190 DOM
-
2026-06-16days on market $255,000 Active 189 DOM
-
2026-06-15days on market $255,000 Active 188 DOM
-
2026-06-13days on market $255,000 Active 186 DOM
-
2026-06-13days on market $255,000 Active 185 DOM
-
2026-06-09days on market $255,000 Active 182 DOM
-
2026-06-08days on market $255,000 Active 181 DOM
-
2026-06-07days on market $255,000 Active 180 DOM
-
2026-06-04days on market $255,000 Active 177 DOM
-
2026-06-03days on market $255,000 Active 176 DOM
-
2026-06-02days on market $255,000 Active 175 DOM
-
2026-06-01days on market $255,000 Active 174 DOM
-
2026-05-31days on market $255,000 Active 173 DOM
-
2026-05-13price $255,000
-
2026-04-06price $265,000
-
2025-12-30price $275,000
-
2015-02-05historical
-
2015-02-05Reactivated
-
2006-12-07soldstatus $149,000
-
2006-05-11soldstatus $139,000
-
2004-12-03soldstatus $137,500
-
1989-12-19soldstatus $62,000
-
1989-12-19soldstatus $80,000
-
1987-04-30soldstatus $46,500
ⓘ Source: listings_history table (triggers on properties + properties_extension) + one-shot
backfill from property_details.listing_events for pre-trigger history.
Tax reassessment forecast IL · Partial reset (capped growth)
- Current annual tax
- $3,874 · $323/mo
- Projected year-2 tax
- $4,831 · $403/mo
- Expected delta
- +$957/yr (+$80/mo · 24.7%)
ⓘ Screening estimate from a state-policy table — verify with the county assessor before closing.
Climate risk First Street
- Flood 1/10 Low FEMA zone X (unshaded) · 0% chance over 30 yrs
- Wildfire 1/10 Low
- Heat 3/10 Moderate 7 d/yr ≥102°F today · 14 d/yr by 30 yrs out
- Wind 2/10 Low 0% chance of damaging wind over 30 yrs
- Air quality 3/10 Moderate 3 unhealthy d/yr today · 3 by 30 yrs out
Nearby sold comps map
Loading sold comps map…
Walkable amenities ~0.75 mi
Loading nearby amenities…
Taxation est. · year 1
- Rental income
- $30,282
- − Mortgage interest
- −$14,284
- − Property taxes
- −$3,874
- − Insurance
- −$1,275
- − Repairs & maintenance
- −$2,423
- − Management
- −$2,423
- − HOA
- −$3,780
- − Depreciation
- −$7,418
- Taxable loss
- −$5,195
- Est. tax savings @ 24.0%
- +$1,247
- After-tax cash flow
- $193/yr
For passive investors: Depreciation is non-cash, so a rental often shows a tax loss while cash-flowing — sheltering income. Rental losses are passive: they offset passive income freely, and up to $25,000/yr can offset ordinary (W-2) income if you actively participate and your MAGI is under $100k (phasing out to $0 by $150k); unused losses carry forward. On sale, claimed depreciation is recaptured at up to 25%, and gains may owe capital-gains tax (a 1031 exchange can defer both). Figures are a year-1 estimate at your 24.0% rate — not tax advice; consult a CPA.
Schools (NCES district)
- District
- Lake Park Chsd 108
- NCES district ID
- 1721840
- Math proficiency
- 37% ▼ -16.00%
- Reading proficiency
- 43% ▼ -6.00%
- Median HH income
- $69,790
- Composite
- 36.37/100
- National rank
- #4684
- State rank
- #128 of 620 in IL
Livability — Hanover Park
- Score
- 78/100
- State rank
- #150
- US rank
- #2740
Category grades
Schools grade is shown separately in the Schools card above.
Census & demographics
- Census place
- Hanover Park, IL
- County
- DuPage County · 904,569 people
- City population
- 36,732
- Metro
- Chicago-Naperville-Elgin, IL-IN-WI
- Population (ZIP)
- 36,732
- Household income
- $91,763
- Rent vs Own
- Severe rent burden
- 634.0
Population outlook (DuPage County) Hauer SSP2
- Today (2025)
- 960,187 people
- By 2030
- 965,850 · +0.6%
- By 2040
- 965,812 · +0.6%
- By 2050
- 954,890 · -0.6%
- By 2075
- 910,185 · -5.2%
- By 2100
- 816,255 · -15.0%
Race, ethnicity, and origin ACS 2023
- Neighborhood character
- Highly diverse neighborhood (Simpson 0.71)
- Race & ethnicity
- Hispanic / Latino 39% White 31% Two or more races 20% Asian 19% Black 8%
- Hispanic origin (detail)
- Mexican 28% Puerto Rican 3%
- Common ancestry
- Romanian 6% Lithuanian 2% Italian 1%
- Foreign-born
- 35% · Canada, Jamaica, China
- Languages at home
- 45% English-only · Spanish 33% Other Indo-European 13% Russian/Polish/Slavic 2%
Political lean MEDSL · DuPage
- 2024 margin
- D (+13.3) · D 55.9% · R 42.5% · Other 1.6%
- 2008→2024 swing
- +2.5pp toward D · 2008: 10.8pp · 2024: 13.3pp
- All cycles
- 2024: D+13.3 2020: D+18.1 2016: D+14.1 2012: D+1.0 2008: D+10.8
Not yet ingested
- Civics
- —
Market trends
- HPI YoY
- ▼ -252.78%
- Current HPI
- 254.6863
- Rent YoY
- —
- Metro
- Chicago-Naperville-Elgin, IL-IN-WI
- State GDP YoY
- ▲ 1.59%
- F500 in state
- 60
Industry mix (Fortune 500 HQ in IL)
| Industry | F500 HQs | Revenue |
|---|---|---|
| Insurance | 4 | $201B |
|
||
| Consumer Goods | 4 | $87B |
|
||
| Industrial Machinery | 3 | $64B |
|
||
| Healthcare | 2 | $55B |
|
||
| Retail / Pharmacy | 1 | $148B |
|
||
| Agriculture / Food | 1 | $86B |
|
||
Price history
+448.4% since first listed11 events — show timeline
- 2026-05-13 Price Changed $255,000 MRED as Distributed by MLS Grid
- 2026-04-06 Price Changed $265,000 MRED as Distributed by MLS Grid
- 2025-12-30 Price Changed $275,000 MRED as Distributed by MLS Grid
- 2015-02-05 Listing Removed — MRED as Distributed by MLS Grid
- 2015-02-05 Listed — MRED as Distributed by MLS Grid
- 2006-12-07 Sold (Public Records) $149,000 Public Records
- 2006-05-11 Sold (Public Records) $139,000 Public Records
- 2004-12-03 Sold (Public Records) $137,500 Public Records
- 1989-12-19 Sold (Public Records) $80,000 Public Records
- 1989-12-19 Sold (Public Records) $62,000 Public Records
- 1987-04-30 Sold (Public Records) $46,500 Public Records
Property tax history
+2.0%/yrLatest (2024): $3,874 · +6.1% YoY. Source: county tax records.
Cash-flow waterfall
monthlySold comps — $/sqft
last 12 mo · ≤1 miLoading sold comps…