 Duplex
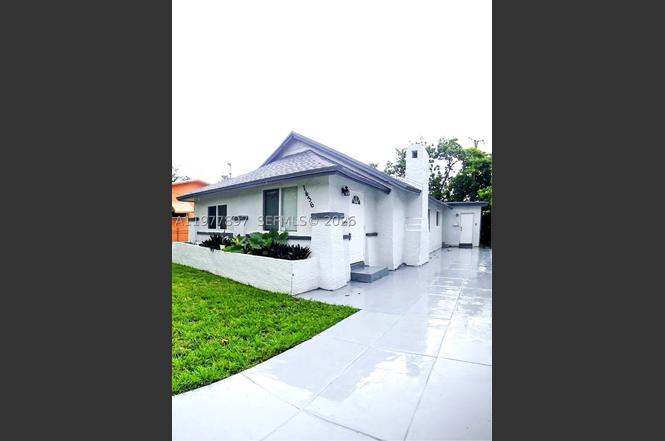
1436 NW 51st Ter · Miami, FL
Flood risk 4/10 · Minor
- FEMA flood zone
- X (unshaded)
- Chance of flooding over 30 yrs
- 0.22%
- Est. flood insurance / yr
- $507 – $1,088
Fire risk 1/10 · Minimal
- Est. fire insurance / yr
- $947 – $1,759
Heat risk 10/10 · Severe
- Hot days now (above 103°F)
- 7 days/yr
- Hot days in 30 yrs
- 29 days/yr
Wind risk 10/10 · Severe
- Chance of severe wind over 30 yrs
- 99.0%
Air-quality risk 2/10 · Minimal
- Unhealthy air days now
- 1 days/yr
- Unhealthy air days in 30 yrs
- 1 days/yr
Risk factors via First Street. Map © Google.
Why this score? — see what drove the D+ grade
The composite is a weighted blend of 9 inputs, each scored 0–100. Each bar is that input's sub-score; the figure is the points it added to the 100-point composite (weight × sub-score).
- Cash flow +14.1/30.0
- ARV discount +12.8/15.0
- DSCR +4.3/10.0
- Schools +4.2/10.0
- Livability +3.9/5.0
- 1% rule +3.1/10.0
- Condition / age +2.5/5.0
- Rent growth +2.4/5.0
- Appreciation +0.0/10.0
$620,000
🖨 Deal sheet 📄 Offer letter ✓ Due diligence
Multi-family units
County records classify this as Multi-Family (2-4 Unit). Listing-text estimate: 2 units. confirmed
Listing remarks
Gorgeous and cozy duplex for sale in a Miami desired area, rented month to month, tenants may stay or leave if you are looking to buy a property that help you pay the mortgage and reduce your living cost while growing a good asset. First unit has 2 bedrooms, a studio that may be use as extra bedroom, living-room, full kitchen, and 1 bathroom, while the 2nd unit has 2 bedrooms, living-room, full kitchen and 1 bathroom, independent meters, laundry room and ACs. The roof is fairly new, all windows are impact, full structure was freshly painted. There is also a large driveway with enough area for 3 vehicles and a large lot completely fenced. All kitchen cabinets and toilets are new, and all
Key facts
- Large driveway
- Laundry room
- Fenced
Tags
Property features AI
Finance
- Financial info: Property contains multiple rental units (investor/multifamily): two 2-bed units and one 3-bed unit
Exterior
- Parking: Other parking
- Utilities: Cable service not available
- Home design: 2-story building; Resale property
- Exterior features: Lot size is less than a quarter acre
Interior
- Bedrooms: Two 2-bedroom units; One 3-bedroom unit
- Bathrooms: Each unit has 1 full bathroom
- Interior features: Less than quarter acre lot
- Laundry & utility: Shared or in-building laundry room
Neighborhood map
What this means for you Summary
Snapshot
- This is a 2 × 4-bed/1.5-bath units multifamily listed at $620k.
Deal economics
- At list price, monthly cash flow is $94 ($1k/yr) — positive. Per door: $47/mo.
- The deal already cash-flows at list — no discount required.
- To meet the 1% rule (rent ≥ 1% of price), the offer needs to be $499k (19.5% below list).
- Recommended offer: $499k (19.5% below list) — sets the bar for 1% rule.
- Cap rate 6.5% vs local median 1.9% in Miami — top-decile yield for the area; either an underpriced asset or a hidden risk that comps aren't pricing in. Stress-test before assuming the spread holds.
Location & tenants
- Location reads 78/100 on livability (#177 in FL, #2,724 nationally) — a middle-class / working-renter tenant base. Strengths: amenities A+, commute A+, health & safety A+; Watch: employment C-, crime F, cost of living F.
- Miami-Dade (suburban): math 45% / reading 54% proficiency, ranked #40 of 73 in FL (top 55%) — families likely to look elsewhere, expect single-tenant / working-renter base with shorter leases; 64% free/reduced lunch — lower-income household profile, screen leases tightly.
- Market conditions: Rents soft (-0.4%/yr); 265 active listings in the ZIP; lower-income renter base — watch delinquency; 10,051 units permitted in Miami-Dade County in 2024 (7,758 in 5+ unit buildings).
- At $4,994/mo this rent would consume 151% of the median local household income ($40k/yr) (locally 5748% of renters already pay >50% of income on rent) — very limited rent-growth headroom before tenants either downsize or default.
Forward outlook
- Local home prices are declining (-3.0%/yr); year-one equity from $4k of loan paydown is wiped out by about $19k of value loss. Plan a longer hold.
- Miami-Dade County population projected at +28% by 2050 — long-run rental-demand tailwind backs the buy-and-hold thesis.
Negotiation context
- It's been on market 104 days — a 9% lower offer ($564k) is reasonable based on typical stale-listing flexibility.
- 3 sale attempts since 4y ago with the ask held roughly flat each time — persistent listings suggest the price (not the market) is what's stuck; bring a comps-based counter.
- Current owner paid $200k; list at $620k implies a 210% gain — meaningful room to come down on a strong offer.
Risks & watch-outs
- Watch-outs: built in 1926 — expect roof / HVAC / electrical / plumbing capex.
- Climate carrying-cost: severe wind risk, 99% chance of damaging wind over 30y; extreme-heat days projected 7→29/yr by 2055 (HVAC capex compounding) — expect insurance premiums to compound above CPI over the hold.
Questions for the listing agent
- It's been on market 104 days. Have you received any prior offers? Is the seller open to a 19% concession, seller financing, or rate buy-down credit?
- Can we see the unit-by-unit rent roll, current vacancy, and any below-market leases? What's the average tenancy length?
- What capital expenditures (roof, boiler, parking lot, exteriors) have been made in the last 5 years, and what's planned in the next 2?
- Built in 1926 — when were the roof, HVAC, electrical panel, plumbing, and water heater last replaced?
- Why hasn't it sold? Are there any deal-killer items the seller is aware of (foundation, flood, title, zoning, code violations)?
- Is there a deadline driving the sale (1031 exchange, divorce, estate, relocation)? That informs how much negotiation room exists.
- Schools are B-rated — typically a magnet for longer-tenancy family renters. What's the average tenant stay here, and is there a school-zone premium baked into asking?
- Crime grade is F in this area — have there been break-ins, vandalism, or insurance claims at this property in the last 3 years? What carrier currently insures it and at what premium?
- The area grade is low — what's the realistic commute time and amenity access for the typical tenant pool here? Any planned neighborhood developments (good or bad) we should know about?
- What's the average days-on-market for RENTAL listings here right now (not sales)? A rising rental-DOM trend means longer vacancies and softer asking-rent achievability than the comps imply.
- What's the recent tenant-quality profile in this submarket — average credit score on applications, eviction rate, late-payment / NSF rate, and stable-employment percentage? A property-management company in the area should have these aggregated.
- How much new apartment / multifamily construction is in the pipeline within 1–3 miles? Heavy new supply (>2% of stock underway) typically softens rents 12–24 months out; light construction supports rent growth.
Investment metrics
- 1% rule
- 0.81% ✗
- Cap rate
- 6.47%
- Cash-on-cash
- 0.65%
- DSCR
- 1.03
- GRM
- 10.3
CMA / ARV
- ARV (on-the-fly)
- $702,792
- Comps found
- 2
Show comp detail 2 sales within ~0.75 mi
| Address | Dist | Beds/Ba | Sqft | Sold | Price | $/sf | Match |
|---|---|---|---|---|---|---|---|
| 1846-1848 NW 43rd St | 0.65mi | 4/2.0 | 1,512 (-2%) | 4mo | $455,000 | $301 | 63 |
| 1946 NW 49th St | 0.55mi | 4/3.0 | 1,520 (-2%) | 18mo | $690,000 | $454 | 52 |
Match score weights: distance 35% · size 25% · config 20% · recency 20%. Top-matched comps best support the ARV.
Projected returns pro-forma
-3.0% appreciation · 0.0% rent growth · sell at horizon
- IRR
- -18.4%
- Equity multiple
- 0.37×
- Total profit
- $-109,332
- Equity at exit
- $92,444
- IRR
- -17.3%
- Equity multiple
- 0.17×
- Total profit
- $-144,863
- Equity at exit
- $53,606
Cash invested: $173,600 (down + closing). Projections, not guarantees.
Landlord ↔ Tenant lean methodology
- Overall (STATE)
- 87 Strongly Landlord-Friendly
- State Florida
- 87 Strongly Landlord-Friendly · R+3
- County
- — inherits STATE
- City
- — inherits STATE
ZIP-level market 33142
- Home prices YoY
- -15.1%
- Rents YoY
- -0.4%
- Active inventory
- 265
- Price-to-rent
- 20.7×
Monthly cashflow live
- Estimated rent
- $4,994 medium interval (Pro) →
- Mortgage (P&I)
- −$3,251
- Tax from tax record
- −$342 /mo · $4,104/yr
- Insurance
- −$258
- HOA
- −$0
- Vacancy / Maint / Mgmt
- −$1,049
- Net cashflow
- $94
Break-even live
2-unit breakdown (identical units grouped — click to expand)
| Units | Beds | Baths | Est. rent |
|---|---|---|---|
| 2× units | 4 | 1.5 | $4,994 |
| #1 | 4 | 1.5 | $2,497 |
| #2 | 4 | 1.5 | $2,497 |
| Total (2 units) | $4,994 | ||
UW: 25.0% down · 7.5% · 30yr · 1.5% tax · 5.0% vac · 8.0% maint · 8.0% mgmt
Financing live
Cash to close
- Down payment
- $155,000
- Closing costs
- $18,600
- Reserves months
- —
- Total cash needed
- —
Loan-product check · same deal, 3 products live
Conventional
25% down · 7.5% · 30yr
- Down + closing
- —
- Monthly P&I
- —
- Monthly cashflow
- —
- DSCR
- —
- Eligible?
- —
Personal DTI + credit; lowest rate.
DSCR
20% down · 8.5% · 30yr
- Down + closing
- —
- Monthly P&I
- —
- Monthly cashflow
- —
- DSCR
- —
- Eligible?
- —
No personal income docs; deal must DSCR.
Hard money
10% down · 12.0% · 12mo
- Down + closing
- —
- Monthly P&I
- —
- Monthly cashflow
- —
- DSCR
- —
- Eligible?
- —
Short-term bridge; refi at stabilization.
Listing history 23 events
-
2026-06-18days on market $620,000 Active 104 DOM
-
2026-06-17days on market $620,000 Active 103 DOM
-
2026-06-16days on market $620,000 Active 102 DOM
-
2026-06-15days on market $620,000 Active 101 DOM
-
2026-06-13days on market $620,000 Active 99 DOM
-
2026-06-09days on market $620,000 Active 95 DOM
-
2026-06-08days on market $620,000 Active 94 DOM
-
2026-06-07days on market $620,000 Active 93 DOM
-
2026-06-04days on market $620,000 Active 90 DOM
-
2026-06-03days on market $620,000 Active 89 DOM
-
2026-06-02days on market $620,000 Active 88 DOM
-
2026-06-01days on market $620,000 Active 87 DOM
-
2026-05-31days on market $620,000 Active 86 DOM
-
2026-03-06$620,000 Active
-
2024-12-31historical
-
2024-03-13$595,000 Active
-
2022-06-27historical
-
2022-04-04price $475,000
-
2022-01-28$460,000 Active
-
2005-09-28soldstatus $200,000
-
2000-11-21soldstatus $79,000
-
1988-11-01soldstatus $15,200
-
1981-07-01soldstatus $22,500
ⓘ Source: listings_history table (triggers on properties + properties_extension) + one-shot
backfill from property_details.listing_events for pre-trigger history.
Tax reassessment forecast FL · Resets to sale price
- Current annual tax
- $4,104 · $342/mo
- Projected year-2 tax
- $5,146 · $429/mo
- Expected delta
- +$1,042/yr (+$87/mo · 25.4%)
ⓘ Screening estimate from a state-policy table — verify with the county assessor before closing.
Climate risk First Street
- Flood 4/10 Moderate FEMA zone X (unshaded) · 22% chance over 30 yrs
- Wildfire 1/10 Low
- Heat 10/10 Extreme 7 d/yr ≥103°F today · 29 d/yr by 30 yrs out
- Wind 10/10 Extreme 99% chance of damaging wind over 30 yrs
- Air quality 2/10 Low 1 unhealthy d/yr today · 1 by 30 yrs out
Nearby sold comps map
Loading sold comps map…
Walkable amenities ~0.75 mi
Loading nearby amenities…
Taxation est. · year 1
- Rental income
- $59,928
- − Mortgage interest
- −$34,730
- − Property taxes
- −$4,104
- − Insurance
- −$3,100
- − Repairs & maintenance
- −$4,794
- − Management
- −$4,794
- − Depreciation
- −$18,036
- Taxable loss
- −$9,630
- Est. tax savings @ 24.0%
- +$2,311
- After-tax cash flow
- $3,434/yr
For passive investors: Depreciation is non-cash, so a rental often shows a tax loss while cash-flowing — sheltering income. Rental losses are passive: they offset passive income freely, and up to $25,000/yr can offset ordinary (W-2) income if you actively participate and your MAGI is under $100k (phasing out to $0 by $150k); unused losses carry forward. On sale, claimed depreciation is recaptured at up to 25%, and gains may owe capital-gains tax (a 1031 exchange can defer both). Figures are a year-1 estimate at your 24.0% rate — not tax advice; consult a CPA.
Schools (NCES district)
- District
- Miami-Dade
- NCES district ID
- 1200390
- Math proficiency
- 45% ▼ -16.00%
- Reading proficiency
- 54% ▼ -5.00%
- Median HH income
- $43,928
- Composite
- 41.76/100
- National rank
- #3397
- State rank
- #40 of 73 in FL
Livability — Miami
- Score
- 78/100
- State rank
- #177
- US rank
- #2724
Category grades
Schools grade is shown separately in the Schools card above.
Census & demographics
- Census place
- Miami, FL
- County
- Miami-Dade County · 2,697,751 people
- City population
- 827,308
- Metro
- Miami-Fort Lauderdale-Pompano Beach, FL
- Population (ZIP)
- 58,908
- Household income
- $39,608
- Rent vs Own
- Severe rent burden
- 5748.0
Population outlook (Miami-Dade County) Hauer SSP2
- Today (2025)
- 3,126,439 people
- By 2030
- 3,325,765 · +6.4%
- By 2040
- 3,697,561 · +18.3%
- By 2050
- 4,012,134 · +28.3%
- By 2075
- 4,605,612 · +47.3%
- By 2100
- 4,866,598 · +55.7%
Race, ethnicity, and origin ACS 2023
- Neighborhood character
- Predominantly Hispanic (68%)
- Race & ethnicity
- Hispanic / Latino 68% Two or more races 36% Black 28% White 3%
- Hispanic origin (detail)
- Mexican 2% Puerto Rican 3% Cuban 24% Dominican 7%
- Common ancestry
- Hispanic 2%
- Foreign-born
- 51% · Canada, Jamaica, Dominican Republic
- Languages at home
- 34% English-only · Spanish 64% French/Haitian/Cajun 1%
Political lean MEDSL · Miami-Dade
- 2024 margin
- R (+11.4) · D 43.9% · R 55.4%
- 2008→2024 swing
- -27.6pp toward R · 2008: 16.1pp · 2024: -11.4pp
- All cycles
- 2024: R+11.4 2020: D+7.3 2016: D+29.6 2012: D+23.7 2008: D+16.1
Not yet ingested
- Civics
- —
Market trends
- HPI YoY
- ▼ -102.31%
- Current HPI
- 574.9225
- Rent YoY
- ▼ -0.41%
- Metro
- Miami-Fort Lauderdale-Pompano Beach, FL
- State GDP YoY
- ▲ 3.28%
- F500 in state
- 36
Industry mix (Fortune 500 HQ in FL)
| Industry | F500 HQs | Revenue |
|---|---|---|
| Industrial Technology | 2 | $29B |
|
||
| Insurance | 2 | $17B |
|
||
| Retail | 1 | $60B |
|
||
| Technology Distribution | 1 | $58B |
|
||
| Homebuilding | 1 | $35B |
|
||
| Technology Manufacturing | 1 | $35B |
|
||
Price history
+2655.6% since first listed10 events — show timeline
- 2026-03-06 Listed $620,000 MARMLS
- 2024-12-31 Listing Removed — MARMLS
- 2024-03-13 Listed $595,000 MARMLS
- 2022-06-27 Listing Removed — MARMLS
- 2022-04-04 Price Changed $475,000 MARMLS
- 2022-01-28 Listed $460,000 MARMLS
- 2005-09-28 Sold (Public Records) $200,000 Public Records
- 2000-11-21 Sold (Public Records) $79,000 Public Records
- 1988-11-01 Sold (Public Records) $15,200 Public Records
- 1981-07-01 Sold (Public Records) $22,500 Public Records
Property tax history
+6.4%/yrLatest (2025): $4,104 · +9.1% YoY. Source: county tax records.
Cash-flow waterfall
monthlySold comps — $/sqft
last 12 mo · ≤1 miLoading sold comps…