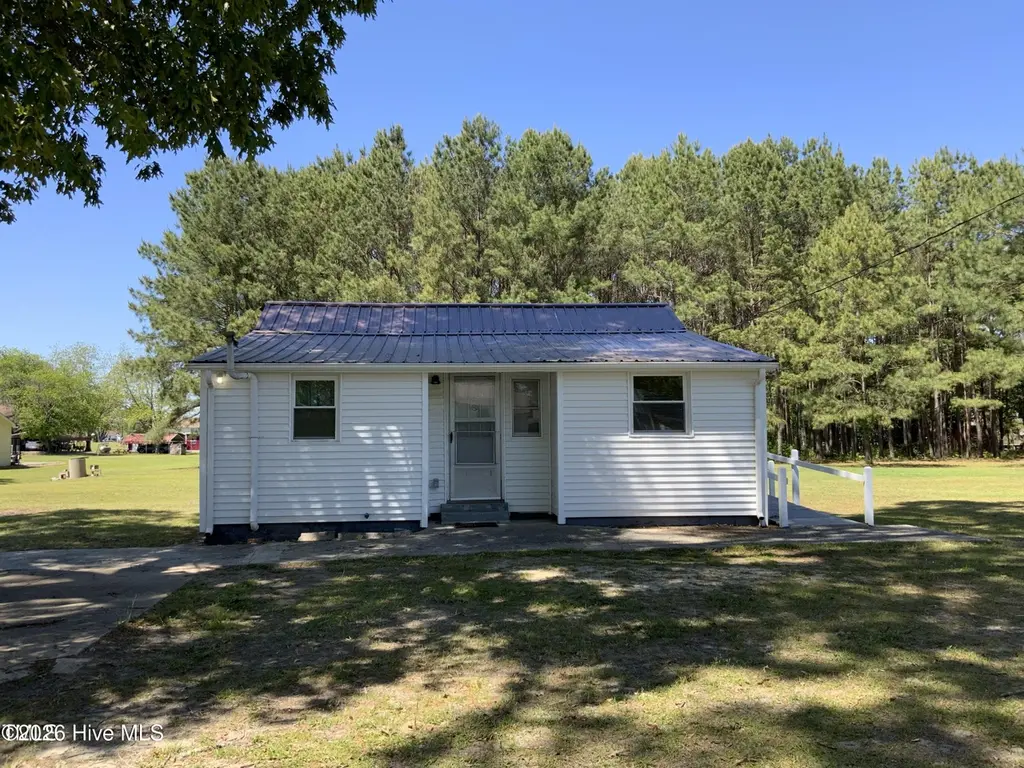
109 Revelle Park Ln · Murfreesboro, NC
Flood risk 1/10 · Minimal
- FEMA flood zone
- X (unshaded)
- Chance of flooding over 30 yrs
- 0.0%
- Est. flood insurance / yr
- $507 – $1,088
Fire risk 2/10 · Minimal
- Est. fire insurance / yr
- $906 – $1,684
Heat risk 8/10 · Major
- Hot days now (above 106°F)
- 7 days/yr
- Hot days in 30 yrs
- 17 days/yr
Wind risk 7/10 · Major
- Chance of severe wind over 30 yrs
- 78.0%
Air-quality risk 1/10 · Minimal
- Unhealthy air days now
- 0 days/yr
- Unhealthy air days in 30 yrs
- 0 days/yr
Risk factors via First Street. Map © Google.
Why this score? — see what drove the B grade
The composite is a weighted blend of 9 inputs, each scored 0–100. Each bar is that input's sub-score; the figure is the points it added to the 100-point composite (weight × sub-score).
- Cash flow +29.8/30.0
- DSCR +10.0/10.0
- ARV discount +7.5/15.0
- Appreciation +7.5/10.0
- 1% rule +7.1/10.0
- Livability +3.4/5.0
- Rent growth +2.5/5.0
- Condition / age +2.5/5.0
- Schools +1.6/10.0
$67,000
🖨 Deal sheet (PDF) 📄 Offer letter ✓ Due diligence
Listing remarks
Why rent when you can buy? Or, would you like to build your investment portfolio? This home was remodeled April 2025, complete with updated wiring, new plumbing, all new windows, remote control ceiling fans, fire and carbon monoxide sensors, exterior security lights, and a new refrigerator. A nice kitchen stove and stackable washer and dryer complete your appliance package. There's also a ramp making the home wheelchair accessible.
Key facts
- Metal roof installed
- Hvac system updated
- 7,841 sq ft lot
Tags
Property features AI
Finance
- Other: Zoned R-6; Lot dimensions: 132' x 59' x 133' x 66'
- Financial info: Financial details not provided
- HOA & community: HOA information not provided
Exterior
- Parking: No garage
- Security: Security information not provided
- Utilities: Public water; Public sewer / Sewer connected; Water connected
- Home design: Single-family residence; One story (entry level: 1); Property type: Residential
- Construction: Vinyl siding and frame construction; Metal roof; Crawl space foundation; Built information not provided
- Exterior features: No listed exterior features; No patio or porch; No fencing; Level, cleared lot; Has a view
Interior
- Kitchen: Electric range; Electric water heater
- Bedrooms: Bedrooms information not provided
- Flooring: Flooring information not provided
- Bathrooms: 1 full bathroom
- Heating & cooling: Heating: Electric, Forced Air, Heat Pump; No central air cooling
- Interior features: Eat-in kitchen; Total of 4 rooms
- Laundry & utility: Washer hookup
Neighborhood map
What this means for you Summary
Snapshot
- This is a 1-bed/1.0-bath single-family listed at $67k.
Deal economics
- At list price, monthly cash flow is $245 ($3k/yr) — positive.
- The deal already cash-flows at list — no discount required.
- Meets the 1% rule at list price ($813 rent vs $67k).
Location & tenants
- Location reads 67/100 on livability (#236 in NC) — a middle-class / working-renter tenant base. Strengths: cost of living A+, health & safety A+, housing A-; Watch: employment D+, crime F, amenities F.
- Hertford County Schools (town): math 14% / reading 26% proficiency, ranked #171 of 178 in NC (top 96%) — low school quality limits family demand, transient renter base, plan for 1-2y turnover; 74% free/reduced lunch — lower-income household profile, screen leases tightly.
- Zoned schools: Riverview Elementary (math 8% / reading 22%, grade F, #1,325 of 1,410 statewide, top 94%, 344 students, 99% FRL); Hertford County Middle (math 6% / reading 26%, grade F, #455 of 475 statewide, top 96%, 536 students, 99% FRL); Hertford Co Early College (math 74% / reading 74%, grade B+, #92 of 535 statewide, top 18%, 172 students, 98% FRL) — zoned schools average 99% FRL vs 74% district-wide (25 pts higher); higher-poverty schools than district average — tighter screening recommended.
- Zoned-school proficiency averages 35% at this address vs 20% district-wide (+15 pts) — the actual schools serving this property are materially stronger than the Hertford County Schools average implies; a family-tenant draw the district grade alone would hide.
- Market conditions: 35 active listings in the ZIP; 5 units permitted in Hertford County in 2024 (0 in 5+ unit buildings).
Forward outlook
- In year one you build about $4k of equity ($463 loan paydown + $3k appreciation (4.9% local appreciation)).
- Hertford County population projected at -15% by 2050 — secular population decline; favor cash flow + early exit over multi-decade hold.
- At projected returns (4.9% appreciation + 3.0% rent growth), your $19k cash investment doubles in ~3 years — after that, you're playing with house money.
- By year 9, paydown + projected appreciation supports a ~$33k cash-out refi (75% LTV) — recoverable capital for the next deal without selling this one.
Negotiation context
- Only 10 days on market — expect competitive offers; lowballing is unlikely to land.
- 2 sale attempts with the ask held roughly flat each time — persistent listings suggest the price (not the market) is what's stuck; bring a comps-based counter.
- Current owner paid $23k; list at $67k implies a 191% gain — meaningful room to come down on a strong offer.
Risks & watch-outs
- Watch-outs: built in 1951 — expect roof / HVAC / electrical / plumbing capex.
- Climate carrying-cost: major wind risk, 78% chance of damaging wind over 30y; extreme-heat days projected 7→17/yr by 2055 (HVAC capex compounding) — expect insurance premiums to compound above CPI over the hold.
Questions for the listing agent
- Built in 1951 — when were the roof, HVAC, electrical panel, plumbing, and water heater last replaced?
- Is there a deadline driving the sale (1031 exchange, divorce, estate, relocation)? That informs how much negotiation room exists.
- Schools are F-rated, which usually means shorter tenancies and higher turnover. Who's the typical renter profile here, and what's been the actual vacancy rate?
- Crime grade is F in this area — have there been break-ins, vandalism, or insurance claims at this property in the last 3 years? What carrier currently insures it and at what premium?
- What's the average days-on-market for RENTAL listings here right now (not sales)? A rising rental-DOM trend means longer vacancies and softer asking-rent achievability than the comps imply.
- What's the recent tenant-quality profile in this submarket — average credit score on applications, eviction rate, late-payment / NSF rate, and stable-employment percentage? A property-management company in the area should have these aggregated.
- How much new for-sale + rental construction is in the pipeline within 1–3 miles? Heavy new supply typically softens prices + rents 12–24 months out; constrained supply supports both.
Investment metrics
- 1% rule
- 1.21% ✓
- Cap rate
- 10.69%
- Cash-on-cash
- 15.69%
- DSCR
- 1.70
- GRM
- 6.9
CMA / ARV
No comps found within radius.
Projected returns pro-forma
4.93% appreciation · 3.0% rent growth · sell at horizon
- IRR
- 26.3%
- Equity multiple
- 2.64×
- Total profit
- $30,762
- Equity at exit
- $37,679
- IRR
- 25.3%
- Equity multiple
- 5.24×
- Total profit
- $79,579
- Equity at exit
- $64,790
Cash invested: $18,760 (down + closing). Projections, not guarantees.
Landlord ↔ Tenant lean methodology
- Overall (STATE)
- 85 Strongly Landlord-Friendly
- State North Carolina
- 85 Strongly Landlord-Friendly · R+3
- County
- — inherits STATE
- City
- — inherits STATE
ZIP-level market 27855
- Home prices YoY
- 3.1%
- Active inventory
- 35
- Price-to-rent
- 6.9×
Monthly cashflow live
- Estimated rent
- $813 medium interval (Pro) →
- Mortgage (P&I)
- −$351
- Tax from tax record
- −$18 /mo · $215/yr
- Insurance
- −$28
- HOA
- −$0
- Vacancy / Maint / Mgmt
- −$171
- Net cashflow
- $245
Break-even live
Sensitivity live
| Price | -10% $283 | -5% $264 | +0% $245 | +5% $226 | +10% $207 |
|---|---|---|---|---|---|
| Rent | -10% $181 | -5% $213 | +0% $245 | +5% $277 | +10% $309 |
| Rate | -1.0pp $279 | -0.5pp $262 | base $245 | +0.5pp $228 | +1.0pp $210 |
UW: 25.0% down · 7.5% · 30yr · 1.5% tax · 5.0% vac · 8.0% maint · 8.0% mgmt
Financing live
Cash to close
- Down payment
- $16,750
- Closing costs
- $2,010
- Reserves months
- —
- Total cash needed
- —
Loan-product check · same deal, 3 products live
Conventional
25% down · 7.5% · 30yr
- Down + closing
- —
- Monthly P&I
- —
- Monthly cashflow
- —
- DSCR
- —
- Eligible?
- —
Personal DTI + credit; lowest rate.
DSCR
20% down · 8.5% · 30yr
- Down + closing
- —
- Monthly P&I
- —
- Monthly cashflow
- —
- DSCR
- —
- Eligible?
- —
No personal income docs; deal must DSCR.
Hard money
10% down · 12.0% · 12mo
- Down + closing
- —
- Monthly P&I
- —
- Monthly cashflow
- —
- DSCR
- —
- Eligible?
- —
Short-term bridge; refi at stabilization.
Listing history 10 events
-
2026-06-21days on market $67,000 Active 10 DOM
-
2026-06-21days on market $67,000 Active 9 DOM
-
2026-06-18days on market $67,000 Active 7 DOM
-
2026-06-17days on market $67,000 Active 6 DOM
-
2026-06-16days on market $67,000 Active 5 DOM
-
2026-06-15days on market $67,000 Active 4 DOM
-
2026-06-13remarks 435-char remark
-
2026-06-13days on market $67,000 Active 2 DOM
-
2026-06-12remarks 272-char remark
-
2026-06-12$67,000 Active 1 DOM
ⓘ Source: listings_history table (triggers on properties + properties_extension) + one-shot
backfill from property_details.listing_events for pre-trigger history.
Tax reassessment forecast NC · Resets to sale price
- Current annual tax
- $215 · $18/mo
- Projected year-2 tax
- $549 · $46/mo
- Expected delta
- +$334/yr (+$28/mo · 155.5%)
ⓘ Screening estimate from a state-policy table — verify with the county assessor before closing.
Climate risk First Street
- Flood 1/10 Low FEMA zone X (unshaded) · 0% chance over 30 yrs
- Wildfire 2/10 Low
- Heat 8/10 Severe 7 d/yr ≥106°F today · 17 d/yr by 30 yrs out
- Wind 7/10 Severe 78% chance of damaging wind over 30 yrs
- Air quality 1/10 Low 0 unhealthy d/yr today · 0 by 30 yrs out
Nearby sold comps map
Loading sold comps map…
Walkable amenities ~0.75 mi
Loading nearby amenities…
Taxation est. · year 1
- Rental income
- $9,759
- − Mortgage interest
- −$3,753
- − Property taxes
- −$215
- − Insurance
- −$335
- − Repairs & maintenance
- −$781
- − Management
- −$781
- − Depreciation
- −$1,949
- Taxable income
- $1,945
- Est. tax owed @ 24.0%
- −$467
- After-tax cash flow
- $2,476/yr
For passive investors: Depreciation is non-cash, so a rental often shows a tax loss while cash-flowing — sheltering income. Rental losses are passive: they offset passive income freely, and up to $25,000/yr can offset ordinary (W-2) income if you actively participate and your MAGI is under $100k (phasing out to $0 by $150k); unused losses carry forward. On sale, claimed depreciation is recaptured at up to 25%, and gains may owe capital-gains tax (a 1031 exchange can defer both). Figures are a year-1 estimate at your 24.0% rate — not tax advice; consult a CPA.
Schools (NCES district)
- District
- Hertford County Schools
- NCES district ID
- 3702160
- Math proficiency
- 14% ▼ -3.00%
- Reading proficiency
- 26% ▼ -1.00%
- Median HH income
- $33,467
- Composite
- 16.29/100
- National rank
- #9213
- State rank
- #171 of 178 in NC
Livability — Murfreesboro
- Score
- 67/100
- State rank
- #236
- US rank
- #10779
Category grades
Schools grade is shown separately in the Schools card above.
Census & demographics
- Population (ZIP)
- 5,635
Population outlook (Hertford County) Hauer SSP2
- Today (2025)
- 23,401 people
- By 2030
- 22,708 · -3.0%
- By 2040
- 21,227 · -9.3%
- By 2050
- 19,942 · -14.8%
- By 2075
- 17,844 · -23.7%
- By 2100
- 15,148 · -35.3%
Race, ethnicity, and origin ACS 2023
- Neighborhood character
- Diverse neighborhood (Simpson 0.57)
- Race & ethnicity
- Black 58% White 29% Hispanic / Latino 10% Native American 3% Two or more races 2%
- Hispanic origin (detail)
- Mexican 9%
- Common ancestry
- Hispanic 1% Slovak 1% Italian 1%
- Foreign-born
- 5% · Canada
- Languages at home
- 94% English-only · Spanish 5% Other Asian/Pacific 1%
Political lean MEDSL · Hertford
- 2024 margin
- Strong D (+26.8) · D 63.0% · R 36.3%
- 2008→2024 swing
- -14.8pp toward R · 2008: 41.5pp · 2024: 26.8pp
- All cycles
- 2024: D+26.8 2020: D+34.0 2016: D+37.7 2012: D+44.3 2008: D+41.5
Not yet ingested
- Civics
- —
Market trends
- HPI YoY
- ▲ 4.93%
- Current HPI
- 162.9458
- Rent YoY
- —
- Metro
- —
- State GDP YoY
- ▲ 3.28%
- F500 in state
- 26
Industry mix (Fortune 500 HQ in NC)
| Industry | F500 HQs | Revenue |
|---|---|---|
| Financial Services | 2 | $213B |
|
||
| Retail | 2 | $95B |
|
||
| Industrial Conglomerate | 1 | $38B |
|
||
| Metals / Steel | 1 | $35B |
|
||
| Utilities | 1 | $30B |
|
||
| Industrial Machinery | 1 | $19B |
|
||
Price history
+191.3% since first listed7 events — show timeline
- 2026-06-12 Listed $67,000 Hive MLS
- 2026-04-13 Listing Removed — TMLS
- 2025-11-27 Price Changed $115,000 TMLS
- 2025-08-12 Price Changed $165,000 TMLS
- 2025-06-25 Price Changed $184,999 TMLS
- 2025-05-03 Listed $210,000 TMLS
- 2021-05-25 Sold (Public Records) $23,000 Public Records
Property tax history
-3.8%/yrLatest (2025): $215 · -54.8% YoY. Source: county tax records.
Cash-flow waterfall
monthlySold comps — $/sqft
last 12 mo · ≤1 miLoading sold comps…