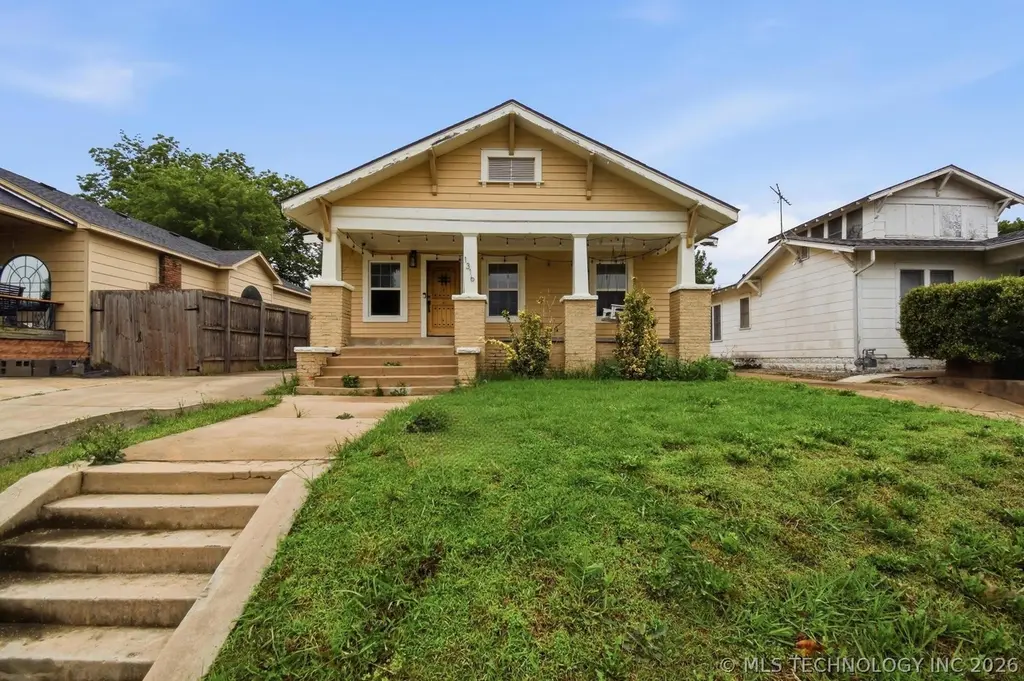
1316 N Main St · Tulsa, OK
Flood risk 1/10 · Minimal
- FEMA flood zone
- X (unshaded)
- Chance of flooding over 30 yrs
- 0.0%
- Est. flood insurance / yr
- $473 – $860
Fire risk 5/10 · Moderate
- Est. fire insurance / yr
- $2,463 – $4,575
Heat risk 6/10 · Moderate
- Hot days now (above 110°F)
- 7 days/yr
- Hot days in 30 yrs
- 18 days/yr
Wind risk 2/10 · Minimal
- Chance of severe wind over 30 yrs
- 4.0%
Air-quality risk 2/10 · Minimal
- Unhealthy air days now
- 2 days/yr
- Unhealthy air days in 30 yrs
- 2 days/yr
Risk factors via First Street. Map © Google.
Why this score? — see what drove the D grade
The composite is a weighted blend of 9 inputs, each scored 0–100. Each bar is that input's sub-score; the figure is the points it added to the 100-point composite (weight × sub-score).
- Cash flow +14.0/30.0
- ARV discount +6.5/15.0
- DSCR +4.2/10.0
- 1% rule +3.9/10.0
- Livability +3.8/5.0
- Rent growth +3.4/5.0
- Appreciation +2.7/10.0
- Condition / age +2.5/5.0
- Schools +0.8/10.0
$220,000
🖨 Deal sheet (PDF) 📄 Offer letter ✓ Due diligence
Listing remarks MLS
Fully renovated craftsman style home located near The Historic Brady District. Close to downtown & Emerson Elementary, perfect for families & 1st time buyers alike. New interior paint, granite counters, SS appliances, & unique mudroom all add to this open concept home. New landscaping, fire pit area, & deck for backyard enjoyment. Stop by the bookstore & coffee shop located in the neighborhood as you enjoy your evening walks in this mature, friendly community. This home is move-in ready & one of a kind!
Key facts
- 6,987 sq ft lot
- Built 1930
- Listed 81 days
Property features AI
Finance
- Other: Green energy-efficient doors, insulation, and windows; Gutters noted as a community feature
- HOA & community: Sidewalks
Exterior
- Security: Owned security system; Storm shelter; Smoke detector(s)
- Utilities: Public water; Public sewer; Electricity available; Cable available
- Home design: Single-story home; Faces east; Basement (partial)
- Construction: Built by owner (year source); Brick, HardiPlank type, and wood frame construction; Asphalt/fiberglass roof; Basement foundation
- Exterior features: Rain gutters; Covered patio and porch; Porch; Full fencing; Storm shelter; Smoke detectors
Interior
- Kitchen: Eat-in kitchen with pantry; Granite counters; Plumbed for ice maker; Oven; Range/Stove; Electric oven/range connection
- Bedrooms: Master bedroom with private bath (first floor); Bedroom with Pullman bath (first floor); Bedroom with Pullman bath (first floor)
- Flooring: Carpet; Tile; Wood
- Bathrooms: Two full bathrooms; Master bath with bathtub and double sink; Hall full bath
- Heating & cooling: Central heating (electric); Central air; Programmable thermostat
- Interior features: Attic; Granite counters; High ceilings; High-speed internet; Cable TV; Wired for data; Electric oven/range connection; Programmable thermostat; Vinyl insulated windows; Insulated doors; Decorative fireplace
- Laundry & utility: Washer hookup; Electric dryer hookup; Washer; Dryer; Electric water heater
Neighborhood map
What this means for you Summary
Snapshot
- This is a 3-bed/1.0-bath single-family listed at $220k.
Deal economics
- At list price, monthly cash flow is $28 ($332/yr) — positive.
- The deal already cash-flows at list — no discount required.
- To meet the 1% rule (rent ≥ 1% of price), the offer needs to be $195k (11.2% below list).
- Recommended offer: $195k (11.2% below list) — sets the bar for 1% rule.
- Cap rate 6.4% vs local median 3.8% in Tulsa — top-decile yield for the area; either an underpriced asset or a hidden risk that comps aren't pricing in. Stress-test before assuming the spread holds.
Location & tenants
- Location reads 75/100 on livability (#13 in OK, #4,058 nationally) — a middle-class / working-renter tenant base. Strengths: amenities A+, commute A+, cost of living A+; Watch: crime F, employment D-.
- Tulsa (urban): math 7% / reading 12% proficiency, ranked #250 of 270 in OK (top 93%) — low school quality limits family demand, transient renter base, plan for 1-2y turnover; 76% free/reduced lunch — lower-income household profile, screen leases tightly.
- Zoned schools: Project Accept Traice Es (math 10% / reading 10%, grade F, #695 of 845 statewide, top 84%, 558 students, 0% FRL); Monroe Demonstration Ms (math 0% / reading 2%, grade F, #344 of 345 statewide, top 100%, 688 students, 0% FRL); Booker T. Washington Hs (math 41% / reading 61%, grade D+, #2 of 447 statewide, top 0%, 1,280 students, 0% FRL) — zoned schools average 0% FRL vs 76% district-wide (76 pts lower); this property's tenant base skews higher-income than the district average.
- Market conditions: Rents rising (+3.5%/yr); 137 active listings in the ZIP; 16 comparable units currently listed for rent nearby; rentals at typical pace (median 18d on market — plan ~3-4 weeks tenant-placement turnaround); lower-income renter base — watch delinquency; 2,818 units permitted in Tulsa County in 2024 (518 in 5+ unit buildings).
- At $1,954/mo this rent would consume 58% of the median local household income ($41k/yr) (locally 1055% of renters already pay >50% of income on rent) — very limited rent-growth headroom before tenants either downsize or default.
Forward outlook
- Local home prices are declining (-3.0%/yr); year-one equity from $2k of loan paydown is wiped out by about $7k of value loss. Plan a longer hold.
- Tulsa County population projected at +30% by 2050 — long-run rental-demand tailwind backs the buy-and-hold thesis.
Negotiation context
- It's been on market 81 days — a 6% lower offer ($207k) is reasonable based on typical stale-listing flexibility.
- 4 sale attempts since 9y ago; this cycle's ask is 5% above the opening price — seller raised mid-cycle; expect resistance to lowballs.
Risks & watch-outs
- Watch-outs: built in 1930 — expect roof / HVAC / electrical / plumbing capex.
- Climate carrying-cost: moderate wildfire risk; extreme-heat days projected 7→18/yr by 2055 (HVAC capex compounding) — expect insurance premiums to compound above CPI over the hold.
Questions for the listing agent
- It's been on market 81 days. Have you received any prior offers? Is the seller open to a 11% concession, seller financing, or rate buy-down credit?
- Built in 1930 — when were the roof, HVAC, electrical panel, plumbing, and water heater last replaced?
- Why hasn't it sold? Are there any deal-killer items the seller is aware of (foundation, flood, title, zoning, code violations)?
- Is there a deadline driving the sale (1031 exchange, divorce, estate, relocation)? That informs how much negotiation room exists.
- Schools are F-rated, which usually means shorter tenancies and higher turnover. Who's the typical renter profile here, and what's been the actual vacancy rate?
- Crime grade is F in this area — have there been break-ins, vandalism, or insurance claims at this property in the last 3 years? What carrier currently insures it and at what premium?
- The area grade is low — what's the realistic commute time and amenity access for the typical tenant pool here? Any planned neighborhood developments (good or bad) we should know about?
- What's the average days-on-market for RENTAL listings here right now (not sales)? A rising rental-DOM trend means longer vacancies and softer asking-rent achievability than the comps imply.
- What's the recent tenant-quality profile in this submarket — average credit score on applications, eviction rate, late-payment / NSF rate, and stable-employment percentage? A property-management company in the area should have these aggregated.
- How much new for-sale + rental construction is in the pipeline within 1–3 miles? Heavy new supply typically softens prices + rents 12–24 months out; constrained supply supports both.
Investment metrics
- 1% rule
- 0.89% ✗
- Cap rate
- 6.44%
- Cash-on-cash
- 0.54%
- DSCR
- 1.02
- GRM
- 9.4
CMA / ARV
- ARV (on-the-fly)
- $215,311
- Comps found
- 12
Show comp detail 12 sales within ~0.75 mi
| Address | Dist | Beds/Ba | Sqft | Sold | Price | $/sf | Match |
|---|---|---|---|---|---|---|---|
| 1332 N Denver Ave | 0.15mi | 3/2.0 | 1,472 (-5%) | 6mo | $245,500 | $167 | 76 |
| 1017 W Newton St | 0.39mi | 3/1.0 | 1,508 (-3%) | 9mo | $53,000 | $35 | 70 |
| 1131 N Boston Ave | 0.28mi | 3/2.0 | 1,693 (+9%) | 8mo | $306,000 | $181 | 60 |
| 522 E Newton Pl | 0.51mi | 3/2.0 | 1,507 (-3%) | 9mo | $210,000 | $139 | 60 |
| 1104 N Boston Ave E | 0.34mi | 3/2.0 | 1,402 (-10%) | 6mo | $305,000 | $218 | 59 |
| 1101 N Main St | 0.34mi | 3/2.0 | 1,402 (-10%) | 8mo | $303,000 | $216 | 58 |
| 1107 N Main St | 0.33mi | 3/2.0 | 1,402 (-10%) | 10mo | $291,746 | $208 | 57 |
| 923 N Denver Ave | 0.43mi | 3/1.0 | 1,344 (-13%) | 2mo | $96,500 | $72 | 56 |
| 1204 W Marshall St | 0.51mi | 3/2.0 | 1,700 (+10%) | 6mo | $224,900 | $132 | 51 |
| 1903 N Cheyenne Ave | 0.60mi | 3/1.0 | 1,752 (+13%) | 3mo | $135,000 | $77 | 47 |
| 430 E Seminole Pl | 0.65mi | 3/2.0 | 1,654 (+7%) | 9mo | $210,000 | $127 | 47 |
| 1912 N Main St N | 0.62mi | 3/1.0 | 1,772 (+14%) | 5mo | $60,000 | $34 | 43 |
Match score weights: distance 35% · size 25% · config 20% · recency 20%. Top-matched comps best support the ARV.
Projected returns pro-forma
-3.0% appreciation · 3.54% rent growth · sell at horizon
- IRR
- -14.8%
- Equity multiple
- 0.47×
- Total profit
- $-32,791
- Equity at exit
- $32,803
- IRR
- -5.3%
- Equity multiple
- 0.65×
- Total profit
- $-21,744
- Equity at exit
- $19,022
Cash invested: $61,600 (down + closing). Projections, not guarantees.
Landlord ↔ Tenant lean methodology
- Overall (STATE)
- 83 Strongly Landlord-Friendly
- State Oklahoma
- 83 Strongly Landlord-Friendly · R+20
- County
- — inherits STATE
- City
- — inherits STATE
ZIP-level market 74106
- Home prices YoY
- -2.5%
- Rents YoY
- 3.5%
- Active inventory
- 137
- Price-to-rent
- 9.4×
Monthly cashflow live
- Estimated rent
- $1,954 high interval (Pro) →
- Mortgage (P&I)
- −$1,154
- Tax from tax record
- −$271 /mo · $3,250/yr
- Insurance
- −$92
- HOA
- −$0
- Vacancy / Maint / Mgmt
- −$410
- Net cashflow
- $28
Break-even live
Sensitivity live
| Price | -10% $152 | -5% $90 | +0% $28 | +5% $-35 | +10% $-97 |
|---|---|---|---|---|---|
| Rent | -10% $-127 | -5% $-49 | +0% $28 | +5% $105 | +10% $182 |
| Rate | -1.0pp $138 | -0.5pp $84 | base $28 | +0.5pp $-29 | +1.0pp $-87 |
UW: 25.0% down · 7.5% · 30yr · 1.5% tax · 5.0% vac · 8.0% maint · 8.0% mgmt
Financing live
Cash to close
- Down payment
- $55,000
- Closing costs
- $6,600
- Reserves months
- —
- Total cash needed
- —
Loan-product check · same deal, 3 products live
Conventional
25% down · 7.5% · 30yr
- Down + closing
- —
- Monthly P&I
- —
- Monthly cashflow
- —
- DSCR
- —
- Eligible?
- —
Personal DTI + credit; lowest rate.
DSCR
20% down · 8.5% · 30yr
- Down + closing
- —
- Monthly P&I
- —
- Monthly cashflow
- —
- DSCR
- —
- Eligible?
- —
No personal income docs; deal must DSCR.
Hard money
10% down · 12.0% · 12mo
- Down + closing
- —
- Monthly P&I
- —
- Monthly cashflow
- —
- DSCR
- —
- Eligible?
- —
Short-term bridge; refi at stabilization.
Rent comps 16 comps
| Address | Beds | Baths | Sqft | Rent | $/sqft | DOM | Units | Dist |
|---|---|---|---|---|---|---|---|---|
| 1152 N Boston Pl Tulsa, OK | 4.0 | 2.0 | 1756 | $2,550 | $1.45 | 25d | 1 | 0.26mi |
| 205 E Marshall St Tulsa, OK | 3.0 | 2.0 | 1452 | $1,725 | $1.19 | 25d | 1 | 0.26mi |
| 1127 N Boston Ave Tulsa, OK | 4.0 | 2.0 | 1745 | $2,275 | $1.30 | 25d | 1 | 0.30mi |
| 313 E Woodrow Pl Tulsa, OK | 4.0 | 2.0 | 1747 | $1,640 | $0.94 | 23d | 1 | 0.91mi |
| 424 N Boulder Ave Tulsa, OK | 1.0–3.0 | 1.0–2.5 | 1220 | $3,699 | $3.03 | 3d | 62 | 0.95mi |
| 1008 E King Pl Tulsa, OK | 3.0 | 1.0 | 1284 | $1,295 | $1.01 | 4d | 1 | 1.07mi |
| 245 E Young Pl Tulsa, OK | 3.0 | 2.0 | 1528 | $1,450 | $0.95 | 18d | 1 | 1.08mi |
| 230 E Zion St Tulsa, OK | 4.0 | 2.0 | 1857 | $1,650 | $0.89 | 25d | 1 | 1.10mi |
| 420 E Archer St Tulsa, OK | 1.0–2.0 | 1.0–2.5 | 1159 | $3,646 | $3.15 | 3d | 30 | 1.16mi |
| 505 E 2nd St S Tulsa, OK | 2.0 | 2.0 | 1087 | $2,180 | $2.01 | 4d | 1 | 1.30mi |
| 310 E 1st St Tulsa, OK | 1.0–2.0 | 1.0–2.0 | 1226 | $2,870 | $2.34 | 4d | 4 | 1.31mi |
| 310 E 1st St Tulsa, OK | 1.0–2.0 | 1.0–2.0 | 1110 | $2,870 | $2.58 | 21d | 5 | 1.31mi |
| 415 E 2nd St S Tulsa, OK | 1.0–2.0 | 1.0–2.0 | 807 | $2,180 | $2.70 | 3d | 28 | 1.33mi |
| 1025 N Quincy Ave Unit A Tulsa, OK | 3.0 | 2.0 | 1303 | $1,450 | $1.11 | 25d | 1 | 1.39mi |
| 211 S Greenwood Ave Tulsa, OK | 1.0–2.0 | 1.0–2.0 | 933 | $2,344 | $2.51 | 4d | 3 | 1.40mi |
| 1005 N Quincy Ave Unit A Tulsa, OK | 3.0 | 2.0 | 1303 | $1,450 | $1.11 | 4d | 1 | 1.41mi |
Listing history 31 events
-
2026-06-22days on market $220,000 Active 81 DOM
-
2026-06-18days on market $220,000 Active 78 DOM
-
2026-06-17days on market $220,000 Active 77 DOM
-
2026-06-16days on market $220,000 Active 76 DOM
-
2026-06-15days on market $220,000 Active 75 DOM
-
2026-06-13days on market $220,000 Active 73 DOM
-
2026-06-10days on market $220,000 Active 70 DOM
-
2026-06-09days on market $220,000 Active 69 DOM
-
2026-06-08days on market $220,000 Active 68 DOM
-
2026-06-07days on market $220,000 Active 67 DOM
-
2026-06-05days on market $220,000 Active 64 DOM
-
2026-06-03days on market $220,000 Active 63 DOM
-
2026-06-02days on market $220,000 Active 62 DOM
-
2026-06-01days on market $220,000 Active 61 DOM
-
2026-05-31days on market $220,000 Active 60 DOM
-
2026-04-01price $220,000
-
2026-04-01$210,000 Active
-
2021-03-17soldstatus $200,000
-
2021-03-16soldstatus $200,000 Closed 542-char remark
Show marketing remark (542 chars)
Fully renovated craftsman style home located near The Historic Brady District. Close to downtown & Emerson Elementary, perfect for families & 1st time buyers alike. New interior paint, granite counters, SS appliances, & unique mudroom all add to this open concept home. New landscaping, fire pit area, & deck for backyard enjoyment. Stop by the bookstore & coffee shop located in the neighborhood as you enjoy your evening walks in this mature, friendly community. This home is move-in ready & one of a kind!
-
2021-02-13status Pending 542-char remark
Show marketing remark (542 chars)
Fully renovated craftsman style home located near The Historic Brady District. Close to downtown & Emerson Elementary, perfect for families & 1st time buyers alike. New interior paint, granite counters, SS appliances, & unique mudroom all add to this open concept home. New landscaping, fire pit area, & deck for backyard enjoyment. Stop by the bookstore & coffee shop located in the neighborhood as you enjoy your evening walks in this mature, friendly community. This home is move-in ready & one of a kind!
-
2021-02-12$189,900 Active 542-char remark
Show marketing remark (542 chars)
Fully renovated craftsman style home located near The Historic Brady District. Close to downtown & Emerson Elementary, perfect for families & 1st time buyers alike. New interior paint, granite counters, SS appliances, & unique mudroom all add to this open concept home. New landscaping, fire pit area, & deck for backyard enjoyment. Stop by the bookstore & coffee shop located in the neighborhood as you enjoy your evening walks in this mature, friendly community. This home is move-in ready & one of a kind!
-
2019-12-06soldstatus $164,900 Closed 390-char remark
Show marketing remark (390 chars)
Fully-renovated, cheery bungalow in Brady Arts! Wood floors in living with built-ins and large windows. Two full, updated baths. Large kitchen with granite peninsula, stainless appliances, separate dining. Open plan with large hallways and functional layout. Expansive covered porch, and fully fenced backyard. Move-in-ready! Downtown living, with access to arts, dining, and entertainment!
-
2019-12-06soldstatus $165,000
Show marketing remark (390 chars)
Fully-renovated, cheery bungalow in Brady Arts! Wood floors in living with built-ins and large windows. Two full, updated baths. Large kitchen with granite peninsula, stainless appliances, separate dining. Open plan with large hallways and functional layout. Expansive covered porch, and fully fenced backyard. Move-in-ready! Downtown living, with access to arts, dining, and entertainment!
-
2019-11-15status Pending 390-char remark
Show marketing remark (390 chars)
Fully-renovated, cheery bungalow in Brady Arts! Wood floors in living with built-ins and large windows. Two full, updated baths. Large kitchen with granite peninsula, stainless appliances, separate dining. Open plan with large hallways and functional layout. Expansive covered porch, and fully fenced backyard. Move-in-ready! Downtown living, with access to arts, dining, and entertainment!
-
2019-10-24price $164,900 390-char remark
Show marketing remark (390 chars)
Fully-renovated, cheery bungalow in Brady Arts! Wood floors in living with built-ins and large windows. Two full, updated baths. Large kitchen with granite peninsula, stainless appliances, separate dining. Open plan with large hallways and functional layout. Expansive covered porch, and fully fenced backyard. Move-in-ready! Downtown living, with access to arts, dining, and entertainment!
-
2019-10-07price $167,500 390-char remark
Show marketing remark (390 chars)
Fully-renovated, cheery bungalow in Brady Arts! Wood floors in living with built-ins and large windows. Two full, updated baths. Large kitchen with granite peninsula, stainless appliances, separate dining. Open plan with large hallways and functional layout. Expansive covered porch, and fully fenced backyard. Move-in-ready! Downtown living, with access to arts, dining, and entertainment!
-
2019-09-11$169,900 Active 390-char remark
Show marketing remark (390 chars)
Fully-renovated, cheery bungalow in Brady Arts! Wood floors in living with built-ins and large windows. Two full, updated baths. Large kitchen with granite peninsula, stainless appliances, separate dining. Open plan with large hallways and functional layout. Expansive covered porch, and fully fenced backyard. Move-in-ready! Downtown living, with access to arts, dining, and entertainment!
-
2017-08-01soldstatus $135,000
-
2017-07-31soldstatus $134,900 Closed
-
2017-06-22status Pending
-
2017-05-12$139,900 Active
ⓘ Source: listings_history table (triggers on properties + properties_extension) + one-shot
backfill from property_details.listing_events for pre-trigger history.
Tax reassessment forecast OK · Resets to sale price
- Current annual tax
- $3,250 · $271/mo
- Projected year-2 tax
- $3,250 · $271/mo
- Expected delta
- $0/yr ($0/mo · 0.0%)
ⓘ Screening estimate from a state-policy table — verify with the county assessor before closing.
Climate risk First Street
- Flood 1/10 Low FEMA zone X (unshaded) · 0% chance over 30 yrs
- Wildfire 5/10 Major
- Heat 6/10 Major 7 d/yr ≥110°F today · 18 d/yr by 30 yrs out
- Wind 2/10 Low 4% chance of damaging wind over 30 yrs
- Air quality 2/10 Low 2 unhealthy d/yr today · 2 by 30 yrs out
Nearby sold comps map
Loading sold comps map…
Walkable amenities ~0.75 mi
Loading nearby amenities…
Taxation est. · year 1
- Rental income
- $23,452
- − Mortgage interest
- −$12,323
- − Property taxes
- −$3,250
- − Insurance
- −$1,100
- − Repairs & maintenance
- −$1,876
- − Management
- −$1,876
- − Depreciation
- −$6,400
- Taxable loss
- −$3,374
- Est. tax savings @ 24.0%
- +$810
- After-tax cash flow
- $1,142/yr
For passive investors: Depreciation is non-cash, so a rental often shows a tax loss while cash-flowing — sheltering income. Rental losses are passive: they offset passive income freely, and up to $25,000/yr can offset ordinary (W-2) income if you actively participate and your MAGI is under $100k (phasing out to $0 by $150k); unused losses carry forward. On sale, claimed depreciation is recaptured at up to 25%, and gains may owe capital-gains tax (a 1031 exchange can defer both). Figures are a year-1 estimate at your 24.0% rate — not tax advice; consult a CPA.
Schools (NCES district)
- District
- Tulsa
- NCES district ID
- 4030240
- Math proficiency
- 7% ▼ -9.00%
- Reading proficiency
- 12% ▼ -7.00%
- Median HH income
- $37,895
- Composite
- 8.04/100
- National rank
- #9919
- State rank
- #250 of 270 in OK
Livability — Tulsa
- Score
- 75/100
- State rank
- #13
- US rank
- #4058
Category grades
Schools grade is shown separately in the Schools card above.
Census & demographics
- Census place
- Tulsa, OK
- County
- Tulsa County · 640,811 people
- City population
- 389,418
- Metro
- Tulsa, OK
- Population (ZIP)
- 15,655
- Household income
- $40,776
- Rent vs Own
- Severe rent burden
- 1055.0
Population outlook (Tulsa County) Hauer SSP2
- Today (2025)
- 723,846 people
- By 2030
- 766,033 · +5.8%
- By 2040
- 851,386 · +17.6%
- By 2050
- 938,389 · +29.6%
- By 2075
- 1,166,011 · +61.1%
- By 2100
- 1,350,277 · +86.5%
Race, ethnicity, and origin ACS 2023
- Neighborhood character
- Diverse neighborhood (Simpson 0.65)
- Race & ethnicity
- Black 55% White 17% Hispanic / Latino 14% Two or more races 13% Native American 4%
- Hispanic origin (detail)
- Mexican 11%
- Common ancestry
- Romanian 1% Serbian 1% Lithuanian 1%
- Foreign-born
- 5% · Canada
- Languages at home
- 87% English-only · Spanish 10% German/W. Germanic 1%
Political lean MEDSL · Tulsa
- 2024 margin
- R (+15.2) · D 41.3% · R 56.5% · Other 2.2%
- 2008→2024 swing
- +9.2pp toward D · 2008: -24.5pp · 2024: -15.2pp
- All cycles
- 2024: R+15.2 2020: R+15.6 2016: R+22.9 2012: R+27.4 2008: R+24.5
Not yet ingested
- Civics
- —
Market trends
- HPI YoY
- ▼ -4.58%
- Current HPI
- 179.5268
- Rent YoY
- ▲ 3.54%
- Metro
- Tulsa, OK
- State GDP YoY
- ▲ 1.55%
- F500 in state
- 6
Industry mix (Fortune 500 HQ in OK)
| Industry | F500 HQs | Revenue |
|---|---|---|
| Energy | 3 | $48B |
|
||
Price history
+57.3% since first listed16 events — show timeline
- 2026-04-01 Price Changed $220,000 MLS Technology, Inc.
- 2026-04-01 Listed $210,000 MLS Technology, Inc.
- 2021-03-17 Sold (Public Records) $200,000 Public Records
- 2021-03-16 Sold (MLS) $200,000 MLS Technology, Inc.
- 2021-02-13 Pending — MLS Technology, Inc.
- 2021-02-12 Listed $189,900 MLS Technology, Inc.
- 2019-12-06 Sold (Public Records) $165,000 Public Records
- 2019-12-06 Sold (MLS) $164,900 MLS Technology, Inc.
- 2019-11-15 Pending — MLS Technology, Inc.
- 2019-10-24 Price Changed $164,900 MLS Technology, Inc.
- 2019-10-07 Price Changed $167,500 MLS Technology, Inc.
- 2019-09-11 Listed $169,900 MLS Technology, Inc.
- 2017-08-01 Sold (Public Records) $135,000 Public Records
- 2017-07-31 Sold (MLS) $134,900 MLS Technology, Inc.
- 2017-06-22 Pending — MLS Technology, Inc.
- 2017-05-12 Listed $139,900 MLS Technology, Inc.
Property tax history
+39.5%/yrLatest (2025): $3,250 · +8.6% YoY. Source: county tax records.
Cash-flow waterfall
monthlySold comps — $/sqft
last 12 mo · ≤1 miLoading sold comps…