5527 E Creek Rd · Strykersville, NY
Flood risk 1/10 · Minimal
- FEMA flood zone
- X (unshaded)
- Chance of flooding over 30 yrs
- 0.0%
- Est. flood insurance / yr
- $507 – $1,088
Fire risk 3/10 · Minor
- Est. fire insurance / yr
- $691 – $1,283
Heat risk 2/10 · Minimal
- Hot days now (above 90°F)
- 7 days/yr
- Hot days in 30 yrs
- 17 days/yr
Wind risk 1/10 · Minimal
- Chance of severe wind over 30 yrs
- —
Air-quality risk 2/10 · Minimal
- Unhealthy air days now
- 0 days/yr
- Unhealthy air days in 30 yrs
- 1 days/yr
Risk factors via First Street. Map © Google.
Why this score? — see what drove the C- grade
The composite is a weighted blend of 9 inputs, each scored 0–100. Each bar is that input's sub-score; the figure is the points it added to the 100-point composite (weight × sub-score).
- ARV discount +15.0/15.0
- Cash flow +12.5/30.0
- Schools +5.5/10.0
- DSCR +3.7/10.0
- Livability +3.2/5.0
- 1% rule +2.9/10.0
- Rent growth +2.5/5.0
- Condition / age +2.5/5.0
- Appreciation +2.3/10.0
$220,000
🖨 Deal sheet (PDF) 📄 Offer letter ✓ Due diligence
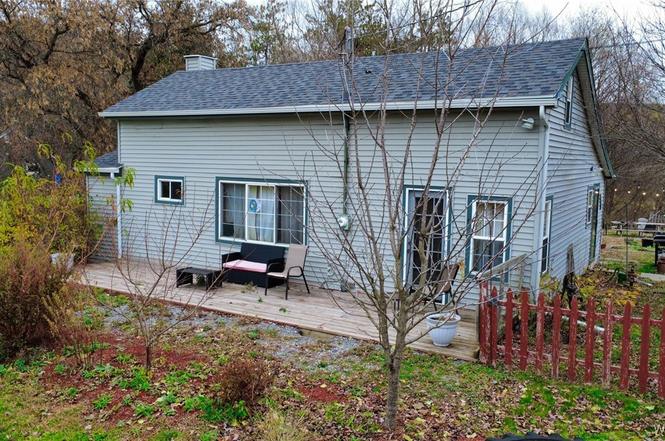
Listing remarks
Welcome to this cozy 3-bedroom, 1-bath home set on 1.5 peaceful acres of countryside charm located in the Iroquois school district. Inside, you’ll find a spacious kitchen with generous cabinet space and a large window that fills the room with natural light and offers views of the backyard. The living spaces are comfortable and inviting, ideal for relaxing or gathering with family and friends. Upstairs, a loft-style bedroom adds character and flexibility, perfect for a guest room, office, or creative space. Outside, the property offers plenty of room to enjoy the outdoors, with raised garden beds, and open space for entertaining or exploring. The detached barn-style garage provides add
Key facts
- Loft-style bedroom
- Spacious kitchen
- Raised garden beds
Tags
Neighborhood map
What this means for you Summary
Snapshot
- This is a 3-bed/1.0-bath single-family listed at $220k.
Deal economics
- At list price, monthly cash flow is $-31 ($-368/yr) — negative.
- To cash-flow at today's rent, offer at most $215k (2.5% below list).
- To meet the 1% rule (rent ≥ 1% of price), the offer needs to be $173k (21.4% below list).
- Recommended offer: $173k (21.4% below list) — sets the bar for 1% rule.
Location & tenants
- Location reads 64/100 on livability (#758 in NY) — a middle-class / working-renter tenant base. Strengths: housing A+, cost of living A-, employment B+; Watch: crime F, amenities F, commute F.
- Iroquois Central School District (rural): math 57% / reading 68% proficiency, ranked #178 of 590 in NY (top 30%) — acceptable for families but not a draw, mixed tenant base, ~2y average lease; only 10% free/reduced lunch — higher-income household profile.
- Zoned schools: Wales Primary School (math 37% / reading 64%, grade C-, #1,051 of 2,108 statewide, top 50%, 224 students, 20% FRL); Iroquois Middle School (math 42% / reading 62%, grade C+, #241 of 729 statewide, top 35%, 450 students, 21% FRL); Iroquois Senior High School (math 98% / reading 98%, grade A+, #19 of 1,100 statewide, top 4%, 663 students, 20% FRL).
- Market conditions: 9 active listings in the ZIP; 1,244 units permitted in Erie County in 2024 (563 in 5+ unit buildings).
Forward outlook
- Local home prices are declining (-3.0%/yr); year-one equity from $2k of loan paydown is wiped out by about $7k of value loss. Plan a longer hold.
Negotiation context
- It's been on market 134 days — a 12% lower offer ($194k) is reasonable based on typical stale-listing flexibility.
- Current owner paid $130k; list at $220k implies a 69% gain — meaningful room to come down on a strong offer.
Risks & watch-outs
- Watch-outs: built in 1865 — expect roof / HVAC / electrical / plumbing capex.
Questions for the listing agent
- What do current leases actually rent for vs. the listed asking? Can we see a recent rent roll and the last 12 months of T-12 income?
- It's been on market 134 days. Have you received any prior offers? Is the seller open to a 21% concession, seller financing, or rate buy-down credit?
- Built in 1865 — when were the roof, HVAC, electrical panel, plumbing, and water heater last replaced?
- Why hasn't it sold? Are there any deal-killer items the seller is aware of (foundation, flood, title, zoning, code violations)?
- Is there a deadline driving the sale (1031 exchange, divorce, estate, relocation)? That informs how much negotiation room exists.
- Crime grade is F in this area — have there been break-ins, vandalism, or insurance claims at this property in the last 3 years? What carrier currently insures it and at what premium?
- What's the average days-on-market for RENTAL listings here right now (not sales)? A rising rental-DOM trend means longer vacancies and softer asking-rent achievability than the comps imply.
- What's the recent tenant-quality profile in this submarket — average credit score on applications, eviction rate, late-payment / NSF rate, and stable-employment percentage? A property-management company in the area should have these aggregated.
- How much new for-sale + rental construction is in the pipeline within 1–3 miles? Heavy new supply typically softens prices + rents 12–24 months out; constrained supply supports both.
Investment metrics
- 1% rule
- 0.79% ✗
- Cap rate
- 6.13%
- Cash-on-cash
- -0.60%
- DSCR
- 0.97
- GRM
- 10.6
CMA / ARV
- ARV (on-the-fly)
- $364,442
- Comps found
- 2
Show comp detail 2 sales within ~0.75 mi
| Address | Dist | Beds/Ba | Sqft | Sold | Price | $/sf | Match |
|---|---|---|---|---|---|---|---|
| 5527 E Creek Rd | 0.00mi | 3/1.0 | 1,391 (0%) | 0mo | $205,000 | $147 | 100 |
| 5363 E Creek Rd | 0.48mi | 3/3.0 | 1,524 (+10%) | 22mo | $400,000 | $262 | 35 |
Match score weights: distance 35% · size 25% · config 20% · recency 20%. Top-matched comps best support the ARV.
Projected returns pro-forma
-3.0% appreciation · 3.0% rent growth · sell at horizon
- IRR
- -17.3%
- Equity multiple
- 0.39×
- Total profit
- $-37,655
- Equity at exit
- $32,803
- IRR
- -9.4%
- Equity multiple
- 0.42×
- Total profit
- $-35,511
- Equity at exit
- $19,022
Cash invested: $61,600 (down + closing). Projections, not guarantees.
Landlord ↔ Tenant lean methodology
- Overall (STATE)
- 15 Strongly Tenant-Friendly
- State New York
- 15 Strongly Tenant-Friendly · D+10
- County
- — inherits STATE
- City
- — inherits STATE
ZIP-level market 14139
- Home prices YoY
- -1.7%
- Active inventory
- 9
- Price-to-rent
- 10.6×
Monthly cashflow live
- Estimated rent
- $1,729 medium interval (Pro) →
- Mortgage (P&I)
- −$1,154
- Tax from tax record
- −$151 /mo · $1,810/yr
- Insurance
- −$92
- HOA
- −$0
- Vacancy / Maint / Mgmt
- −$363
- Net cashflow
- $-31
Break-even live
Sensitivity live
| Price | -10% $94 | -5% $32 | +0% $-31 | +5% $-93 | +10% $-155 |
|---|---|---|---|---|---|
| Rent | -10% $-167 | -5% $-99 | +0% $-31 | +5% $38 | +10% $106 |
| Rate | -1.0pp $80 | -0.5pp $25 | base $-31 | +0.5pp $-88 | +1.0pp $-146 |
UW: 25.0% down · 7.5% · 30yr · 1.5% tax · 5.0% vac · 8.0% maint · 8.0% mgmt
Financing live
Cash to close
- Down payment
- $55,000
- Closing costs
- $6,600
- Reserves months
- —
- Total cash needed
- —
Loan-product check · same deal, 3 products live
Conventional
25% down · 7.5% · 30yr
- Down + closing
- —
- Monthly P&I
- —
- Monthly cashflow
- —
- DSCR
- —
- Eligible?
- —
Personal DTI + credit; lowest rate.
DSCR
20% down · 8.5% · 30yr
- Down + closing
- —
- Monthly P&I
- —
- Monthly cashflow
- —
- DSCR
- —
- Eligible?
- —
No personal income docs; deal must DSCR.
Hard money
10% down · 12.0% · 12mo
- Down + closing
- —
- Monthly P&I
- —
- Monthly cashflow
- —
- DSCR
- —
- Eligible?
- —
Short-term bridge; refi at stabilization.
Listing history 6 events
-
2026-03-26status Pending
-
2026-03-18historical Active Under Contract
-
2026-03-12price $220,000
-
2025-11-12$250,000 Active
-
2015-06-10soldstatus $130,000
-
1998-09-30soldstatus $58,500
ⓘ Source: listings_history table (triggers on properties + properties_extension) + one-shot
backfill from property_details.listing_events for pre-trigger history.
Tax reassessment forecast NY · Partial reset (capped growth)
- Current annual tax
- $1,810 · $151/mo
- Projected year-2 tax
- $2,764 · $230/mo
- Expected delta
- +$954/yr (+$79/mo · 52.7%)
ⓘ Screening estimate from a state-policy table — verify with the county assessor before closing.
Climate risk First Street
- Flood 1/10 Low FEMA zone X (unshaded) · 0% chance over 30 yrs
- Wildfire 3/10 Moderate
- Heat 2/10 Low 7 d/yr ≥90°F today · 17 d/yr by 30 yrs out
- Wind 1/10 Low
- Air quality 2/10 Low 0 unhealthy d/yr today · 1 by 30 yrs out
Nearby sold comps map
Loading sold comps map…
Walkable amenities ~0.75 mi
Loading nearby amenities…
Taxation est. · year 1
- Rental income
- $20,742
- − Mortgage interest
- −$12,323
- − Property taxes
- −$1,810
- − Insurance
- −$1,100
- − Repairs & maintenance
- −$1,659
- − Management
- −$1,659
- − Depreciation
- −$6,400
- Taxable loss
- −$4,210
- Est. tax savings @ 24.0%
- +$1,010
- After-tax cash flow
- $642/yr
For passive investors: Depreciation is non-cash, so a rental often shows a tax loss while cash-flowing — sheltering income. Rental losses are passive: they offset passive income freely, and up to $25,000/yr can offset ordinary (W-2) income if you actively participate and your MAGI is under $100k (phasing out to $0 by $150k); unused losses carry forward. On sale, claimed depreciation is recaptured at up to 25%, and gains may owe capital-gains tax (a 1031 exchange can defer both). Figures are a year-1 estimate at your 24.0% rate — not tax advice; consult a CPA.
Schools (NCES district)
- District
- Iroquois Central School District
- NCES district ID
- 3615360
- Math proficiency
- 57% ▼ -17.00%
- Reading proficiency
- 68% ▲ 8.00%
- Median HH income
- $74,111
- Composite
- 55.41/100
- National rank
- #1251
- State rank
- #178 of 590 in NY
Livability — Strykersville
- Score
- 64/100
- State rank
- #758
- US rank
- #14534
Category grades
Schools grade is shown separately in the Schools card above.
Census & demographics
- Population (ZIP)
- 2,093
Population outlook (Erie County) Hauer SSP2
- Today (2025)
- 933,037 people
- By 2030
- 935,181 · +0.2%
- By 2040
- 928,531 · -0.5%
- By 2050
- 905,725 · -2.9%
- By 2075
- 834,037 · -10.6%
- By 2100
- 708,033 · -24.1%
Race, ethnicity, and origin ACS 2023
- Neighborhood character
- Predominantly White (96%)
- Race & ethnicity
- White 96% Two or more races 3% Black 1%
- Common ancestry
- Romanian 23% Slovak 3% Iranian 2%
- Foreign-born
- 0% · Canada
Political lean MEDSL · Erie
- 2024 margin
- Lean D (+9.7) · D 54.8% · R 45.2%
- 2008→2024 swing
- -7.9pp toward R · 2008: 17.5pp · 2024: 9.7pp
- All cycles
- 2024: D+9.7 2020: D+14.7 2016: D+4.8 2012: D+15.6 2008: D+17.5
Not yet ingested
- Civics
- —
Market trends
- HPI YoY
- ▼ -5.41%
- Current HPI
- 320.5542
- Rent YoY
- —
- Metro
- —
- State GDP YoY
- ▲ 2.60%
- F500 in state
- 92
Industry mix (Fortune 500 HQ in NY)
| Industry | F500 HQs | Revenue |
|---|---|---|
| Financial Services | 10 | $950B |
|
||
| Consumer Goods | 9 | $162B |
|
||
| Insurance | 4 | $225B |
|
||
| Telecommunications | 2 | $144B |
|
||
| Pharmaceuticals | 2 | $112B |
|
||
| Media / Entertainment | 2 | $69B |
|
||
Price history
+276.1% since first listed6 events — show timeline
- 2026-03-26 Pending — WNYREIS
- 2026-03-18 Contingent — WNYREIS
- 2026-03-12 Price Changed $220,000 WNYREIS
- 2025-11-12 Listed $250,000 WNYREIS
- 2015-06-10 Sold (Public Records) $130,000 Public Records
- 1998-09-30 Sold (Public Records) $58,500 Public Records
Property tax history
+0.4%/yrLatest (2025): $1,810 · -0.3% YoY. Source: county tax records.
Cash-flow waterfall
monthlySold comps — $/sqft
last 12 mo · ≤1 miLoading sold comps…