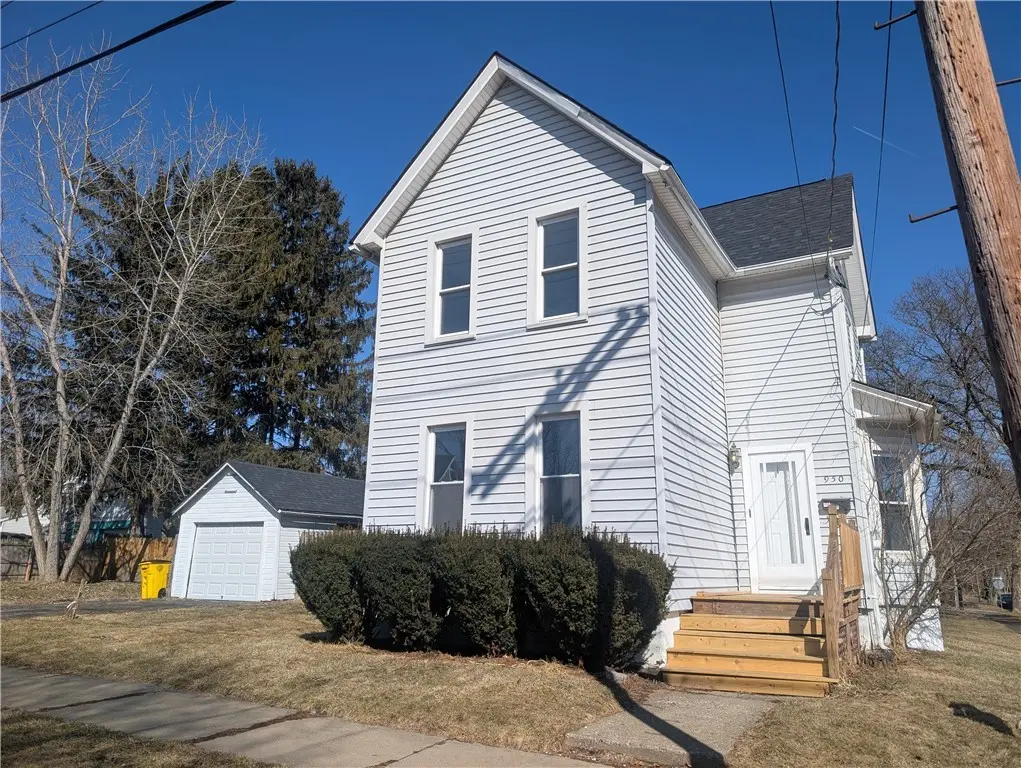
950 N Main St · Elmira, NY
Flood risk 1/10 · Minimal
- FEMA flood zone
- X
- Chance of flooding over 30 yrs
- 0.0%
- Est. flood insurance / yr
- $473 – $860
Fire risk 3/10 · Minor
- Est. fire insurance / yr
- $691 – $1,283
Heat risk 3/10 · Minor
- Hot days now (above 97°F)
- 7 days/yr
- Hot days in 30 yrs
- 16 days/yr
Wind risk 1/10 · Minimal
- Chance of severe wind over 30 yrs
- 1.0%
Air-quality risk 1/10 · Minimal
- Unhealthy air days now
- 0 days/yr
- Unhealthy air days in 30 yrs
- 0 days/yr
Risk factors via First Street. Map © Google.
Why this score? — see what drove the D grade
The composite is a weighted blend of 9 inputs, each scored 0–100. Each bar is that input's sub-score; the figure is the points it added to the 100-point composite (weight × sub-score).
- Cash flow +13.3/30.0
- Appreciation +10.0/10.0
- 1% rule +5.4/10.0
- DSCR +4.0/10.0
- Livability +3.1/5.0
- Rent growth +2.5/5.0
- Condition / age +2.5/5.0
- Schools +2.4/10.0
- ARV discount +0.0/15.0
$129,500
🖨 Deal sheet (PDF) 📄 Offer letter ✓ Due diligence
Listing remarks MLS
4 Bedroom home that needs TLC.
Key facts
- Brand new sump pumps
- Newer roof
- Central location
Tags
Property features AI
Exterior
- Parking: Detached garage (1 car)
- Utilities: Public water (connected); Sewer connected
- Home design: 2-story existing residence; Resale property
- Construction: Vinyl siding; Poured foundation
- Exterior features: Blacktop driveway; Rectangular lot with approximate dimensions 113 x 49; Main thoroughfare road frontage
Interior
- Kitchen: Refrigerator
- Flooring: Carpet; Vinyl; Varied flooring
- Bathrooms: One full bathroom; One half bathroom; One main-level bathroom
- Heating & cooling: Gas forced-air heating
- Interior features: Separate/formal dining room; Full basement
- Laundry & utility: Main-level laundry
Neighborhood map
What this means for you Summary
Snapshot
- This is a 4-bed/1.5-bath single-family listed at $130k.
Deal economics
- At list price, monthly cash flow is $1 ($11/yr) — positive.
- The deal already cash-flows at list — no discount required.
- Meets the 1% rule at list price ($1k rent vs $130k).
- Cap rate 6.3% vs local median 10.1% in Elmira — below-typical yield; the buyer is paying a premium for something (appreciation thesis, condition, location) that the cap rate doesn't capture.
Location & tenants
- Location reads 62/100 on livability (#832 in NY) — a middle-class / working-renter tenant base. Strengths: cost of living A+, housing A+, health & safety A+; Watch: crime F, amenities F, commute F.
- Elmira City School District (urban): math 23% / reading 35% proficiency, ranked #580 of 590 in NY (top 98%) — low school quality limits family demand, transient renter base, plan for 1-2y turnover.
- Zoned schools: Ernie Davis Academy (math 5% / reading 31%, grade F, #691 of 729 statewide, top 95%, 802 students, 66% FRL).
- Market conditions: 81 active listings in the ZIP; 4 comparable units currently listed for rent nearby; rentals lingering (median 46d on market — plan ~5-8 weeks vacancy on turnover, expect pricing pressure); 100% of comp listings sitting > 30 days — soft ceiling on asking rent; 91 units permitted in Chemung County in 2024 (63 in 5+ unit buildings).
Forward outlook
- In year one you build about $14k of equity ($895 loan paydown + $13k appreciation (10.0% local appreciation)).
- Chemung County population projected at -17% by 2050 — secular population decline; favor cash flow + early exit over multi-decade hold.
- At projected returns (10.0% appreciation + 3.0% rent growth), your $36k cash investment doubles in ~3 years — after that, you're playing with house money.
- By year 3, paydown + projected appreciation supports a ~$35k cash-out refi (75% LTV) — recoverable capital for the next deal without selling this one.
Negotiation context
- Only 7 days on market — expect competitive offers; lowballing is unlikely to land.
- 7 sale attempts since 26y ago with the ask held roughly flat each time — persistent listings suggest the price (not the market) is what's stuck; bring a comps-based counter.
- Current owner paid $37k; list at $130k implies a 250% gain — meaningful room to come down on a strong offer.
Risks & watch-outs
- Watch-outs: property tax is 3.1% of price; built in 1920 — expect roof / HVAC / electrical / plumbing capex.
Questions for the listing agent
- Built in 1920 — when were the roof, HVAC, electrical panel, plumbing, and water heater last replaced?
- Property tax is high relative to price — has the assessment been appealed recently, and will the sale trigger a re-assessment?
- Is there a deadline driving the sale (1031 exchange, divorce, estate, relocation)? That informs how much negotiation room exists.
- Schools are F-rated, which usually means shorter tenancies and higher turnover. Who's the typical renter profile here, and what's been the actual vacancy rate?
- Crime grade is F in this area — have there been break-ins, vandalism, or insurance claims at this property in the last 3 years? What carrier currently insures it and at what premium?
- The area grade is low — what's the realistic commute time and amenity access for the typical tenant pool here? Any planned neighborhood developments (good or bad) we should know about?
- What's the average days-on-market for RENTAL listings here right now (not sales)? A rising rental-DOM trend means longer vacancies and softer asking-rent achievability than the comps imply.
- What's the recent tenant-quality profile in this submarket — average credit score on applications, eviction rate, late-payment / NSF rate, and stable-employment percentage? A property-management company in the area should have these aggregated.
- How much new for-sale + rental construction is in the pipeline within 1–3 miles? Heavy new supply typically softens prices + rents 12–24 months out; constrained supply supports both.
Investment metrics
- 1% rule
- 1.04% ✓
- Cap rate
- 6.30%
- Cash-on-cash
- 0.03%
- DSCR
- 1.00
- GRM
- 8.0
CMA / ARV
- ARV (median comp)
- $100,979
- List price
- $129,500
- Delta
- 31.71%
- Verdict
- OVERPRICED
- Comps
- 20 within 1.0 mi
Show comp detail 12 sales within ~0.75 mi
| Address | Dist | Beds/Ba | Sqft | Sold | Price | $/sf | Match |
|---|---|---|---|---|---|---|---|
| 950 N Main St | 0.00mi | 4/1.5 | 1,644 (0%) | 7mo | $37,000 | $23 | 94 |
| 918 Magee St | 0.05mi | 4/1.0 | 1,812 (+10%) | 1mo | $112,000 | $62 | 78 |
| 862 Magee St | 0.17mi | 3/1.0 (-1) | 1,440 (-12%) | 1mo | $64,900 | $45 | 64 |
| 455 Roe Ave | 0.46mi | 4/2.0 | 1,764 (+7%) | 6mo | $105,000 | $60 | 59 |
| 1201 Magee St | 0.54mi | 3/2.0 (-1) | 1,686 (+3%) | 8mo | $176,000 | $104 | 57 |
| 511 Davis St | 0.65mi | 3/1.0 (-1) | 1,592 (-3%) | 1mo | $63,000 | $40 | 57 |
| 625 Roe Ave | 0.73mi | 3/1.5 (-1) | 1,687 (+3%) | 4mo | $230,000 | $136 | 54 |
| 460 W 3rd St | 0.74mi | 3/1.5 (-1) | 1,716 (+4%) | 0mo | $40,000 | $23 | 53 |
| 924 Davis St | 0.33mi | 3/1.0 (-1) | 1,882 (+14%) | 2mo | $135,000 | $72 | 52 |
| 1153 College Ave | 0.45mi | 3/1.0 (-1) | 1,480 (-10%) | 5mo | $105,000 | $71 | 51 |
| 660 Walnut St | 0.63mi | 4/1.5 | 1,400 (-15%) | 1mo | $150,000 | $107 | 45 |
| 921 Grove St | 0.66mi | 3/1.0 (-1) | 1,414 (-14%) | 6mo | $134,000 | $95 | 34 |
Match score weights: distance 35% · size 25% · config 20% · recency 20%. Top-matched comps best support the ARV.
Projected returns pro-forma
10.0% appreciation · 3.0% rent growth · sell at horizon
- IRR
- 24.3%
- Equity multiple
- 2.95×
- Total profit
- $70,712
- Equity at exit
- $116,664
- IRR
- 21.6%
- Equity multiple
- 6.75×
- Total profit
- $208,444
- Equity at exit
- $251,590
Cash invested: $36,260 (down + closing). Projections, not guarantees.
Landlord ↔ Tenant lean methodology
- Overall (STATE)
- 15 Strongly Tenant-Friendly
- State New York
- 15 Strongly Tenant-Friendly · D+10
- County
- — inherits STATE
- City
- — inherits STATE
ZIP-level market 14901
- Home prices YoY
- 15.9%
- Active inventory
- 81
- Price-to-rent
- 8.0×
Monthly cashflow live
- Estimated rent
- $1,353 medium interval (Pro) →
- Mortgage (P&I)
- −$679
- Tax from tax record
- −$335 /mo · $4,015/yr
- Insurance
- −$54
- HOA
- −$0
- Vacancy / Maint / Mgmt
- −$284
- Net cashflow
- $1
Break-even live
Sensitivity live
| Price | -10% $74 | -5% $38 | +0% $1 | +5% $-36 | +10% $-72 |
|---|---|---|---|---|---|
| Rent | -10% $-106 | -5% $-53 | +0% $1 | +5% $54 | +10% $108 |
| Rate | -1.0pp $66 | -0.5pp $34 | base $1 | +0.5pp $-33 | +1.0pp $-67 |
UW: 25.0% down · 7.5% · 30yr · 1.5% tax · 5.0% vac · 8.0% maint · 8.0% mgmt
Financing live
Cash to close
- Down payment
- $32,375
- Closing costs
- $3,885
- Reserves months
- —
- Total cash needed
- —
Loan-product check · same deal, 3 products live
Conventional
25% down · 7.5% · 30yr
- Down + closing
- —
- Monthly P&I
- —
- Monthly cashflow
- —
- DSCR
- —
- Eligible?
- —
Personal DTI + credit; lowest rate.
DSCR
20% down · 8.5% · 30yr
- Down + closing
- —
- Monthly P&I
- —
- Monthly cashflow
- —
- DSCR
- —
- Eligible?
- —
No personal income docs; deal must DSCR.
Hard money
10% down · 12.0% · 12mo
- Down + closing
- —
- Monthly P&I
- —
- Monthly cashflow
- —
- DSCR
- —
- Eligible?
- —
Short-term bridge; refi at stabilization.
Rent comps 4 comps
| Address | Beds | Baths | Sqft | Rent | $/sqft | DOM | Units | Dist |
|---|---|---|---|---|---|---|---|---|
| 355 W Clinton St Unit 1 Elmira, NY | 3.0 | 1.5 | 1650 | $1,400 | $0.85 | 45d | 1 | 0.59mi |
| 106 W 2nd St Unit A Elmira, NY | 3.0 | 1.0 | 1395 | $1,400 | $1.00 | 45d | 1 | 0.69mi |
| 514 W 1st St Unit A Elmira, NY | 4.0 | 1.0 | 1416 | $1,275 | $0.90 | 45d | 1 | 0.94mi |
| 363 W Water St #2 Elmira, NY | 3.0 | 1.0 | 1084 | $1,250 | $1.15 | 45d | 1 | 1.01mi |
Listing history 24 events
-
2026-06-22days on market $129,500 Active 7 DOM
-
2026-06-21days on market $129,500 Active 6 DOM
-
2026-06-19days on market $129,500 Active 4 DOM
-
2026-06-18days on market $129,500 Active 3 DOM
-
2026-06-17days on market $129,500 Active 2 DOM
-
2026-06-16pricedays on market $129,500 Active 1 DOM
-
2026-05-31days on market $133,000 Active 171 DOM
-
2026-05-30days on market $133,000 Active 170 DOM
-
2026-03-28price $133,000 1143-char remark
-
2026-03-04price $138,500 1143-char remark
-
2026-01-13price $142,000 1143-char remark
-
2026-01-01price $148,500 1143-char remark
-
2025-12-11$155,000 Active 1143-char remark
-
2025-11-11soldstatus $37,000 Closed 30-char remark
Show marketing remark (30 chars)
4 Bedroom home that needs TLC.
-
2025-11-11$37,000 Active 30-char remark
Show marketing remark (30 chars)
4 Bedroom home that needs TLC.
-
2023-02-08historical
-
2022-08-09$122,500
-
2014-03-04soldstatus $19,500
-
2013-12-31$16,000
-
2011-10-01historical
-
2010-11-12$62,500
-
2001-06-29soldstatus $55,900
-
2001-06-28soldstatus $55,900
-
2000-05-11$55,900
ⓘ Source: listings_history table (triggers on properties + properties_extension) + one-shot
backfill from property_details.listing_events for pre-trigger history.
Tax reassessment forecast NY · Partial reset (capped growth)
- Current annual tax
- $4,015 · $335/mo
- Projected year-2 tax
- $4,015 · $335/mo
- Expected delta
- $0/yr ($0/mo · 0.0%)
ⓘ Screening estimate from a state-policy table — verify with the county assessor before closing.
Climate risk First Street
- Flood 1/10 Low FEMA zone X · 0% chance over 30 yrs
- Wildfire 3/10 Moderate
- Heat 3/10 Moderate 7 d/yr ≥97°F today · 16 d/yr by 30 yrs out
- Wind 1/10 Low 100% chance of damaging wind over 30 yrs
- Air quality 1/10 Low 0 unhealthy d/yr today · 0 by 30 yrs out
Nearby sold comps map
Loading sold comps map…
Walkable amenities ~0.75 mi
Loading nearby amenities…
Taxation est. · year 1
- Rental income
- $16,231
- − Mortgage interest
- −$7,254
- − Property taxes
- −$4,015
- − Insurance
- −$648
- − Repairs & maintenance
- −$1,299
- − Management
- −$1,299
- − Depreciation
- −$3,767
- Taxable loss
- −$2,050
- Est. tax savings @ 24.0%
- +$492
- After-tax cash flow
- $503/yr
For passive investors: Depreciation is non-cash, so a rental often shows a tax loss while cash-flowing — sheltering income. Rental losses are passive: they offset passive income freely, and up to $25,000/yr can offset ordinary (W-2) income if you actively participate and your MAGI is under $100k (phasing out to $0 by $150k); unused losses carry forward. On sale, claimed depreciation is recaptured at up to 25%, and gains may owe capital-gains tax (a 1031 exchange can defer both). Figures are a year-1 estimate at your 24.0% rate — not tax advice; consult a CPA.
Schools (NCES district)
- District
- Elmira City School District
- NCES district ID
- 3610560
- Math proficiency
- 23% ▼ -7.00%
- Reading proficiency
- 35% ▲ 7.00%
- Median HH income
- $40,180
- Composite
- 24.39/100
- National rank
- #7688
- State rank
- #580 of 590 in NY
Livability — Elmira
- Score
- 62/100
- State rank
- #832
- US rank
- #16139
Category grades
Schools grade is shown separately in the Schools card above.
Census & demographics
- Census place
- Elmira, NY
- City population
- 14,276
- Population (ZIP)
- 14,430
Population outlook (Chemung County) Hauer SSP2
- Today (2025)
- 82,931 people
- By 2030
- 80,356 · -3.1%
- By 2040
- 74,745 · -9.9%
- By 2050
- 69,012 · -16.8%
- By 2075
- 55,689 · -32.8%
- By 2100
- 41,428 · -50.0%
Race, ethnicity, and origin ACS 2023
- Neighborhood character
- Predominantly White (70%)
- Race & ethnicity
- White 70% Black 15% Two or more races 7% Hispanic / Latino 7% Asian 1%
- Hispanic origin (detail)
- Mexican 1% Puerto Rican 3%
- Common ancestry
- Romanian 4% Slovak 3% Iranian 2%
- Foreign-born
- 4% · Canada, China
- Languages at home
- 93% English-only · Spanish 3% Russian/Polish/Slavic 1% Chinese 1%
Political lean MEDSL · Chemung
- 2024 margin
- R (+16.8) · D 41.6% · R 58.4%
- 2008→2024 swing
- -15.6pp toward R · 2008: -1.2pp · 2024: -16.8pp
- All cycles
- 2024: R+16.8 2020: R+13.4 2016: R+20.0 2012: R+2.9 2008: R+1.2
Not yet ingested
- Civics
- —
Market trends
- HPI YoY
- ▲ 32.34%
- Current HPI
- 236.2674
- Rent YoY
- —
- Metro
- —
- State GDP YoY
- ▲ 2.60%
- F500 in state
- 92
Industry mix (Fortune 500 HQ in NY)
| Industry | F500 HQs | Revenue |
|---|---|---|
| Financial Services | 10 | $950B |
|
||
| Consumer Goods | 9 | $162B |
|
||
| Insurance | 4 | $225B |
|
||
| Telecommunications | 2 | $144B |
|
||
| Pharmaceuticals | 2 | $112B |
|
||
| Media / Entertainment | 2 | $69B |
|
||
Price history
+131.7% since first listed18 events — show timeline
- 2026-06-15 Listed $129,500 UNYREIS
- 2026-05-31 Listing Removed — UNYREIS
- 2026-03-28 Price Changed $133,000 UNYREIS
- 2026-03-04 Price Changed $138,500 UNYREIS
- 2026-01-13 Price Changed $142,000 UNYREIS
- 2026-01-01 Price Changed $148,500 UNYREIS
- 2025-12-11 Listed $155,000 UNYREIS
- 2025-11-11 Listed $37,000 UNYREIS
- 2025-11-11 Sold (MLS) $37,000 UNYREIS
- 2023-02-08 Listing Removed — UNYREIS
- 2022-08-09 Listed $122,500 UNYREIS
- 2014-03-04 Sold (MLS) $19,500 UNYREIS
- 2013-12-31 Listed $16,000 UNYREIS
- 2011-10-01 Listing Removed — UNYREIS
- 2010-11-12 Listed $62,500 UNYREIS
- 2001-06-29 Sold (Public Records) $55,900 Public Records
- 2001-06-28 Sold (MLS) $55,900 UNYREIS
- 2000-05-11 Listed $55,900 UNYREIS
Property tax history
+10.9%/yrLatest (2025): $4,015 · -7.6% YoY. Source: county tax records.
Cash-flow waterfall
monthlySold comps — $/sqft
last 12 mo · ≤1 miLoading sold comps…