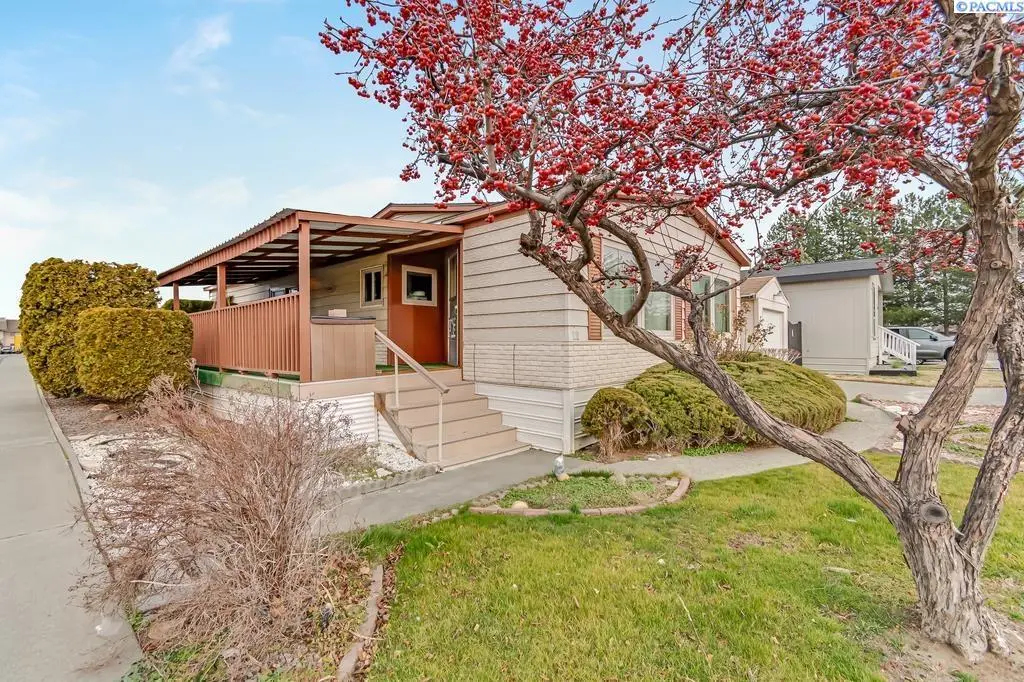
2105 N Steptoe St Space 11 St #11 · Kennewick, WA
Flood risk 1/10 · Minimal
- FEMA flood zone
- X
- Chance of flooding over 30 yrs
- 0.0%
- Est. flood insurance / yr
- $473 – $860
Fire risk 1/10 · Minimal
- Est. fire insurance / yr
- $604 – $1,122
Heat risk 5/10 · Moderate
- Hot days now (above 98°F)
- 7 days/yr
- Hot days in 30 yrs
- 15 days/yr
Wind risk 1/10 · Minimal
- Chance of severe wind over 30 yrs
- —
Air-quality risk 8/10 · Major
- Unhealthy air days now
- 14 days/yr
- Unhealthy air days in 30 yrs
- 15 days/yr
Risk factors via First Street. Map © Google.
Why this score? — see what drove the B grade
The composite is a weighted blend of 9 inputs, each scored 0–100. Each bar is that input's sub-score; the figure is the points it added to the 100-point composite (weight × sub-score).
- Cash flow +30.0/30.0
- 1% rule +10.0/10.0
- DSCR +10.0/10.0
- ARV discount +7.5/15.0
- Schools +5.3/10.0
- Livability +3.9/5.0
- Rent growth +3.3/5.0
- Condition / age +2.5/5.0
- Appreciation +0.0/10.0
$102,000
🖨 Deal sheet 📄 Offer letter ✓ Due diligence
Listing remarks MLS
OPEN HOUSE SUNDAY (5/17/2026) FROM 12-1 PM. MLS# 290755 Imagine relaxing on this quality covered deck, enjoying the sunset view over Badger Mountain. Everything about this meticulously maintained home makes it ready for you to move in and begin enjoying a relaxing lifestyle. You'll appreciate the spacious living room with abundant windows and plenty of natural light. The kitchen offers a view from the sink and there are plenty of cabinets for storage. Display your dishes in the dining room's built-in china cabinet, which also includes an office desk space and a sliding glass door to access the covered deck. The primary suite has a soaking tub, separate shower and mirrored wardrobe closet. The second bedroom has access to an additional full bathroom, which is also available for guest use off the laundry area. The corner lot is extra large and includes partial fencing, additional parking, a storage shed and single-car garage with a storage area inside. Make an appointment to see this home today!
Key facts
- Covered deck
- Soaking tub
- Sunset view
Tags
Neighborhood map
What this means for you Summary
Snapshot
- This is a 2-bed/2.0-bath manufactured listed at $102k.
Deal economics
- At list price, monthly cash flow is $580 ($7k/yr) — positive.
- The deal already cash-flows at list — no discount required.
- Meets the 1% rule at list price ($2k rent vs $102k).
- Recommended offer: $96k (6.0% below list) — sets the bar for market timing.
- Cap rate 13.1% vs local median 3.3% in Kennewick — top-decile yield for the area; either an underpriced asset or a hidden risk that comps aren't pricing in. Stress-test before assuming the spread holds.
Location & tenants
- Location reads 78/100 on livability (#131 in WA, #2,599 nationally) — a middle-class / working-renter tenant base. Strengths: commute A+, housing A+, health & safety A; Watch: schools D+, amenities D+, crime F.
- Richland School District (urban): math 52% / reading 64% proficiency, ranked #61 of 291 in WA (top 21%) — acceptable for families but not a draw, mixed tenant base, ~2y average lease.
- Market conditions: Rents rising (+3.4%/yr); 286 active listings in the ZIP; 11 comparable units currently listed for rent nearby; rentals leasing fast (median 14d on market — plan ~1-2 weeks tenant-placement turnaround); 1,532 units permitted in Benton County in 2024 (389 in 5+ unit buildings).
- This rent runs 31% of the median local income ($63k/yr) — at the standard rent-burdened threshold; future hikes will face affordability resistance.
Forward outlook
- Local home prices are declining (-3.0%/yr); year-one equity from $705 of loan paydown is wiped out by about $3k of value loss. Plan a longer hold.
- Benton County population projected at +32% by 2050 — long-run rental-demand tailwind backs the buy-and-hold thesis.
- At projected returns (-3.0% appreciation + 3.4% rent growth), your $29k cash investment doubles in ~5 years — after that, you're playing with house money.
Negotiation context
- It's been on market 87 days — a 6% lower offer ($96k) is reasonable based on typical stale-listing flexibility.
Risks & watch-outs
- Climate carrying-cost: extreme-heat days projected 7→15/yr by 2055 (HVAC capex compounding) — expect insurance premiums to compound above CPI over the hold.
Questions for the listing agent
- It's been on market 87 days. Have you received any prior offers? Is the seller open to a 6% concession, seller financing, or rate buy-down credit?
- Built in 1979 — when were the roof, HVAC, electrical panel, plumbing, and water heater last replaced?
- Why hasn't it sold? Are there any deal-killer items the seller is aware of (foundation, flood, title, zoning, code violations)?
- Is there a deadline driving the sale (1031 exchange, divorce, estate, relocation)? That informs how much negotiation room exists.
- Schools are D-rated, which usually means shorter tenancies and higher turnover. Who's the typical renter profile here, and what's been the actual vacancy rate?
- Crime grade is F in this area — have there been break-ins, vandalism, or insurance claims at this property in the last 3 years? What carrier currently insures it and at what premium?
- What's the average days-on-market for RENTAL listings here right now (not sales)? A rising rental-DOM trend means longer vacancies and softer asking-rent achievability than the comps imply.
- What's the recent tenant-quality profile in this submarket — average credit score on applications, eviction rate, late-payment / NSF rate, and stable-employment percentage? A property-management company in the area should have these aggregated.
- How much new for-sale + rental construction is in the pipeline within 1–3 miles? Heavy new supply typically softens prices + rents 12–24 months out; constrained supply supports both.
Investment metrics
- 1% rule
- 1.60% ✓
- Cap rate
- 13.12%
- Cash-on-cash
- 24.39%
- DSCR
- 2.09
- GRM
- 5.2
CMA / ARV
- ARV (median comp)
- $268,702
- List price
- $102,000
- Delta
- -62.04%
- Verdict
- UNDERPRICED
- Comps
- 20 within 1.0 mi
Show comp detail 12 sales within ~0.75 mi
| Address | Dist | Beds/Ba | Sqft | Sold | Price | $/sf | Match |
|---|---|---|---|---|---|---|---|
| 2105 N Steptoe St #119 | 0.15mi | 3/2.0 (+1) | 1,230 (-1%) | 5mo | $155,000 | $126 | 82 |
| 2114 N Texas St | 0.18mi | 3/2.0 (+1) | 1,288 (+3%) | 10mo | $310,000 | $241 | 73 |
| 2109 N Nevada St | 0.32mi | 3/2.0 (+1) | 1,296 (+4%) | 2mo | $280,000 | $216 | 72 |
| 2105 N Steptoe St #129 | 0.17mi | 3/2.0 (+1) | 1,296 (+4%) | 14mo | $50,000 | $39 | 69 |
| 8911 W Arrowhead Ave | 0.18mi | 3/2.0 (+1) | 1,288 (+3%) | 16mo | $345,000 | $268 | 68 |
| 9130 W Arrowhead Ave | 0.15mi | 3/2.0 (+1) | 1,296 (+4%) | 17mo | $294,500 | $227 | 68 |
| 452 Cliffrose Pl | 0.42mi | 3/2.0 (+1) | 1,296 (+4%) | 2mo | $360,000 | $278 | 67 |
| 9138 W Yellowstone Ave | 0.19mi | 3/2.0 (+1) | 1,344 (+8%) | 11mo | $314,900 | $234 | 64 |
| 9171 W Yellowstone Ave | 0.23mi | 3/2.0 (+1) | 1,404 (+12%) | 3mo | $309,500 | $220 | 61 |
| 2157 N Vermont Loop | 0.28mi | 3/2.0 (+1) | 1,152 (-8%) | 14mo | $261,000 | $227 | 57 |
| 9115 W Arrowhead Ave | 0.17mi | 3/2.0 (+1) | 1,080 (-14%) | 15mo | $1,595 | $1 | 52 |
| 8433 W Canyon Ave | 0.46mi | 3/2.0 (+1) | 1,100 (-12%) | 4mo | $295,000 | $268 | 50 |
Match score weights: distance 35% · size 25% · config 20% · recency 20%. Top-matched comps best support the ARV.
Projected returns pro-forma
-3.0% appreciation · 3.39% rent growth · sell at horizon
- IRR
- 18.2%
- Equity multiple
- 1.74×
- Total profit
- $21,102
- Equity at exit
- $15,209
- IRR
- 26.9%
- Equity multiple
- 3.41×
- Total profit
- $68,725
- Equity at exit
- $8,819
Cash invested: $28,560 (down + closing). Projections, not guarantees.
Landlord ↔ Tenant lean methodology
- Overall (STATE)
- 28 Tenant-Leaning
- State Washington
- 28 Tenant-Leaning · D+8
- County
- — inherits STATE
- City
- — inherits STATE
ZIP-level market 99336
- Rents YoY
- 3.4%
- Active inventory
- 286
- Price-to-rent
- 5.2×
Monthly cashflow live
- Estimated rent
- $1,627 high interval (Pro) →
- Mortgage (P&I)
- −$535
- Tax est. 1.5%
- −$128 /mo · $1,530/yr
- Insurance
- −$42
- HOA
- −$0
- Vacancy / Maint / Mgmt
- −$342
- Net cashflow
- $580
Break-even live
UW: 25.0% down · 7.5% · 30yr · 1.5% tax · 5.0% vac · 8.0% maint · 8.0% mgmt
Financing live
Cash to close
- Down payment
- $25,500
- Closing costs
- $3,060
- Reserves months
- —
- Total cash needed
- —
Loan-product check · same deal, 3 products live
Conventional
25% down · 7.5% · 30yr
- Down + closing
- —
- Monthly P&I
- —
- Monthly cashflow
- —
- DSCR
- —
- Eligible?
- —
Personal DTI + credit; lowest rate.
DSCR
20% down · 8.5% · 30yr
- Down + closing
- —
- Monthly P&I
- —
- Monthly cashflow
- —
- DSCR
- —
- Eligible?
- —
No personal income docs; deal must DSCR.
Hard money
10% down · 12.0% · 12mo
- Down + closing
- —
- Monthly P&I
- —
- Monthly cashflow
- —
- DSCR
- —
- Eligible?
- —
Short-term bridge; refi at stabilization.
Rent comps 11 comps
| Address | Beds | Baths | Sqft | Rent | $/sqft | DOM | Units | Dist |
|---|---|---|---|---|---|---|---|---|
| 785 Canyon St Unit 207 Richland, WA | 2.0 | 2.0 | 1100 | $1,500 | $1.36 | 43d | 1 | 0.14mi |
| 785 Canyon St Unit 106 Richland, WA | 2.0 | 2.0 | 1100 | $1,600 | $1.45 | 43d | 1 | 0.15mi |
| 1950 Bellerive Dr Richland, WA | 2.0 | 1.0 | 710 | $1,058 | $1.49 | 13d | 5 | 0.50mi |
| 1148 Columbia Park Trl Richland, WA | 2.0 | 2.0 | 1375 | $2,075 | $1.51 | 21d | 1 | 0.58mi |
| 250 Gage Blvd Richland, WA | 1.0–3.0 | 1.0–2.0 | 1012 | $1,728 | $1.71 | 13d | 10 | 0.65mi |
| 303 Gage Blvd Richland, WA | 2.0 | 2.0 | 1034 | $1,625 | $1.57 | 13d | 1 | 0.76mi |
| 1529 Columbia Park Trl Richland, WA | 1.0–2.0 | 1.0–2.0 | 992 | $1,870 | $1.89 | 13d | 6 | 0.86mi |
| 1506 Cimarron Ave Richland, WA | 3.0 | 2.0 | 1500 | $2,095 | $1.40 | 43d | 1 | 0.88mi |
| 725 N Center Pkwy Kennewick, WA | 1.0–3.0 | 1.0–2.0 | 1086 | $1,906 | $1.75 | 13d | 9 | 0.93mi |
| 8831 W Entiat Ave Kennewick, WA | 3.0 | 2.0 | 1232 | $1,995 | $1.62 | 43d | 1 | 1.20mi |
| 1775 Columbia Park Trl Richland, WA | 2.0 | 1.0 | 943 | $1,602 | $1.70 | 13d | 3 | 1.20mi |
Listing history 3 events
-
2026-04-20price $102,000 1008-char remark
Show marketing remark (1008 chars)
OPEN HOUSE SUNDAY (5/17/2026) FROM 12-1 PM. MLS# 290755 Imagine relaxing on this quality covered deck, enjoying the sunset view over Badger Mountain. Everything about this meticulously maintained home makes it ready for you to move in and begin enjoying a relaxing lifestyle. You'll appreciate the spacious living room with abundant windows and plenty of natural light. The kitchen offers a view from the sink and there are plenty of cabinets for storage. Display your dishes in the dining room's built-in china cabinet, which also includes an office desk space and a sliding glass door to access the covered deck. The primary suite has a soaking tub, separate shower and mirrored wardrobe closet. The second bedroom has access to an additional full bathroom, which is also available for guest use off the laundry area. The corner lot is extra large and includes partial fencing, additional parking, a storage shed and single-car garage with a storage area inside. Make an appointment to see this home today!
-
2026-03-13price $110,000 1008-char remark
Show marketing remark (1008 chars)
OPEN HOUSE SUNDAY (5/17/2026) FROM 12-1 PM. MLS# 290755 Imagine relaxing on this quality covered deck, enjoying the sunset view over Badger Mountain. Everything about this meticulously maintained home makes it ready for you to move in and begin enjoying a relaxing lifestyle. You'll appreciate the spacious living room with abundant windows and plenty of natural light. The kitchen offers a view from the sink and there are plenty of cabinets for storage. Display your dishes in the dining room's built-in china cabinet, which also includes an office desk space and a sliding glass door to access the covered deck. The primary suite has a soaking tub, separate shower and mirrored wardrobe closet. The second bedroom has access to an additional full bathroom, which is also available for guest use off the laundry area. The corner lot is extra large and includes partial fencing, additional parking, a storage shed and single-car garage with a storage area inside. Make an appointment to see this home today!
-
2026-02-25$115,000 Active 1008-char remark
Show marketing remark (1008 chars)
OPEN HOUSE SUNDAY (5/17/2026) FROM 12-1 PM. MLS# 290755 Imagine relaxing on this quality covered deck, enjoying the sunset view over Badger Mountain. Everything about this meticulously maintained home makes it ready for you to move in and begin enjoying a relaxing lifestyle. You'll appreciate the spacious living room with abundant windows and plenty of natural light. The kitchen offers a view from the sink and there are plenty of cabinets for storage. Display your dishes in the dining room's built-in china cabinet, which also includes an office desk space and a sliding glass door to access the covered deck. The primary suite has a soaking tub, separate shower and mirrored wardrobe closet. The second bedroom has access to an additional full bathroom, which is also available for guest use off the laundry area. The corner lot is extra large and includes partial fencing, additional parking, a storage shed and single-car garage with a storage area inside. Make an appointment to see this home today!
ⓘ Source: listings_history table (triggers on properties + properties_extension) + one-shot
backfill from property_details.listing_events for pre-trigger history.
Climate risk First Street
- Flood 1/10 Low FEMA zone X · 0% chance over 30 yrs
- Wildfire 1/10 Low
- Heat 5/10 Major 7 d/yr ≥98°F today · 15 d/yr by 30 yrs out
- Wind 1/10 Low
- Air quality 8/10 Severe 14 unhealthy d/yr today · 15 by 30 yrs out
Nearby sold comps map
Loading sold comps map…
Walkable amenities ~0.75 mi
Loading nearby amenities…
Taxation est. · year 1
- Rental income
- $19,523
- − Mortgage interest
- −$5,714
- − Property taxes
- −$1,530
- − Insurance
- −$510
- − Repairs & maintenance
- −$1,562
- − Management
- −$1,562
- − Depreciation
- −$2,967
- Taxable income
- $5,679
- Est. tax owed @ 24.0%
- −$1,363
- After-tax cash flow
- $5,602/yr
For passive investors: Depreciation is non-cash, so a rental often shows a tax loss while cash-flowing — sheltering income. Rental losses are passive: they offset passive income freely, and up to $25,000/yr can offset ordinary (W-2) income if you actively participate and your MAGI is under $100k (phasing out to $0 by $150k); unused losses carry forward. On sale, claimed depreciation is recaptured at up to 25%, and gains may owe capital-gains tax (a 1031 exchange can defer both). Figures are a year-1 estimate at your 24.0% rate — not tax advice; consult a CPA.
Schools (NCES district)
- District
- Richland School District
- NCES district ID
- 5307320
- Math proficiency
- 52% ▬ 0.00%
- Reading proficiency
- 64% ▼ -1.00%
- Median HH income
- $70,475
- Composite
- 53.04/100
- National rank
- #3244
- State rank
- #61 of 291 in WA
Livability — Kennewick
- Score
- 78/100
- State rank
- #131
- US rank
- #2599
Category grades
Schools grade is shown separately in the Schools card above.
Census & demographics
- Census place
- Kennewick, WA
- County
- Benton County · 186,895 people
- City population
- 104,655
- Metro
- Kennewick-Richland, WA
- Population (ZIP)
- 50,735
- Household income
- $62,527
- Rent vs Own
- Severe rent burden
- 2605.0
Population outlook (Benton County) Hauer SSP2
- Today (2025)
- 219,421 people
- By 2030
- 233,813 · +6.6%
- By 2040
- 262,134 · +19.5%
- By 2050
- 290,100 · +32.2%
- By 2075
- 363,525 · +65.7%
- By 2100
- 418,667 · +90.8%
Race, ethnicity, and origin ACS 2023
- Neighborhood character
- Diverse neighborhood (Simpson 0.56)
- Race & ethnicity
- White 55% Hispanic / Latino 37% Two or more races 15% Black 3% Asian 2% Native American 1%
- Hispanic origin (detail)
- Mexican 31% Cuban 2%
- Common ancestry
- Portuguese 4% Slovak 3% Romanian 1%
- Foreign-born
- 16% · Canada, Jamaica
- Languages at home
- 68% English-only · Spanish 29% Arabic 1%
Political lean MEDSL · Benton
- 2024 margin
- Strong R (+21.9) · D 37.7% · R 59.6% · Other 2.7%
- 2008→2024 swing
- +4.2pp toward D · 2008: -26.1pp · 2024: -21.9pp
- All cycles
- 2024: R+21.9 2020: R+21.0 2016: R+26.6 2012: R+27.0 2008: R+26.1
Not yet ingested
- Civics
- —
Market trends
- HPI YoY
- ▼ -408.26%
- Current HPI
- 256.1143
- Rent YoY
- ▲ 3.39%
- Metro
- Kennewick-Richland, WA
- State GDP YoY
- ▲ 4.65%
- F500 in state
- 22
Industry mix (Fortune 500 HQ in WA)
| Industry | F500 HQs | Revenue |
|---|---|---|
| Retail | 2 | $269B |
|
||
| Technology / Retail | 1 | $638B |
|
||
| Technology | 1 | $245B |
|
||
| Telecommunications | 1 | $38B |
|
||
| Food / Beverage | 1 | $36B |
|
||
| Automotive / Trucks | 1 | $34B |
|
||
Price history
-11.3% since first listed3 events — show timeline
- 2026-04-20 Price Changed $102,000 PACMLS
- 2026-03-13 Price Changed $110,000 PACMLS
- 2026-02-25 Listed $115,000 PACMLS
Property tax history
-38.0%/yrLatest (2020): $14 · +4.4% YoY. Source: county tax records.
Cash-flow waterfall
monthlySold comps — $/sqft
last 12 mo · ≤1 miLoading sold comps…