 Duplex
3330 Liberty Dr · Rockford, IL
Flood risk 6/10 · Moderate
- FEMA flood zone
- AE
- Chance of flooding over 30 yrs
- 0.71%
- Est. flood insurance / yr
- $2,026 – $9,024
Fire risk 1/10 · Minimal
- Est. fire insurance / yr
- $804 – $1,492
Heat risk 2/10 · Minimal
- Hot days now (above 102°F)
- 7 days/yr
- Hot days in 30 yrs
- 15 days/yr
Wind risk 2/10 · Minimal
- Chance of severe wind over 30 yrs
- —
Air-quality risk 2/10 · Minimal
- Unhealthy air days now
- 1 days/yr
- Unhealthy air days in 30 yrs
- 2 days/yr
Risk factors via First Street. Map © Google.
Why this score? — see what drove the B- grade
The composite is a weighted blend of 9 inputs, each scored 0–100. Each bar is that input's sub-score; the figure is the points it added to the 100-point composite (weight × sub-score).
- Cash flow +30.0/30.0
- 1% rule +10.0/10.0
- DSCR +10.0/10.0
- ARV discount +7.5/15.0
- Livability +3.1/5.0
- Rent growth +2.5/5.0
- Condition / age +2.0/5.0
- Schools +1.2/10.0
- Appreciation +0.0/10.0
$150,000
🖨 Deal sheet 📄 Offer letter ✓ Due diligence
Multi-family units
County records classify this as Multi-Family (2-4 Unit). Listing-text estimate: 2 units. confirmed
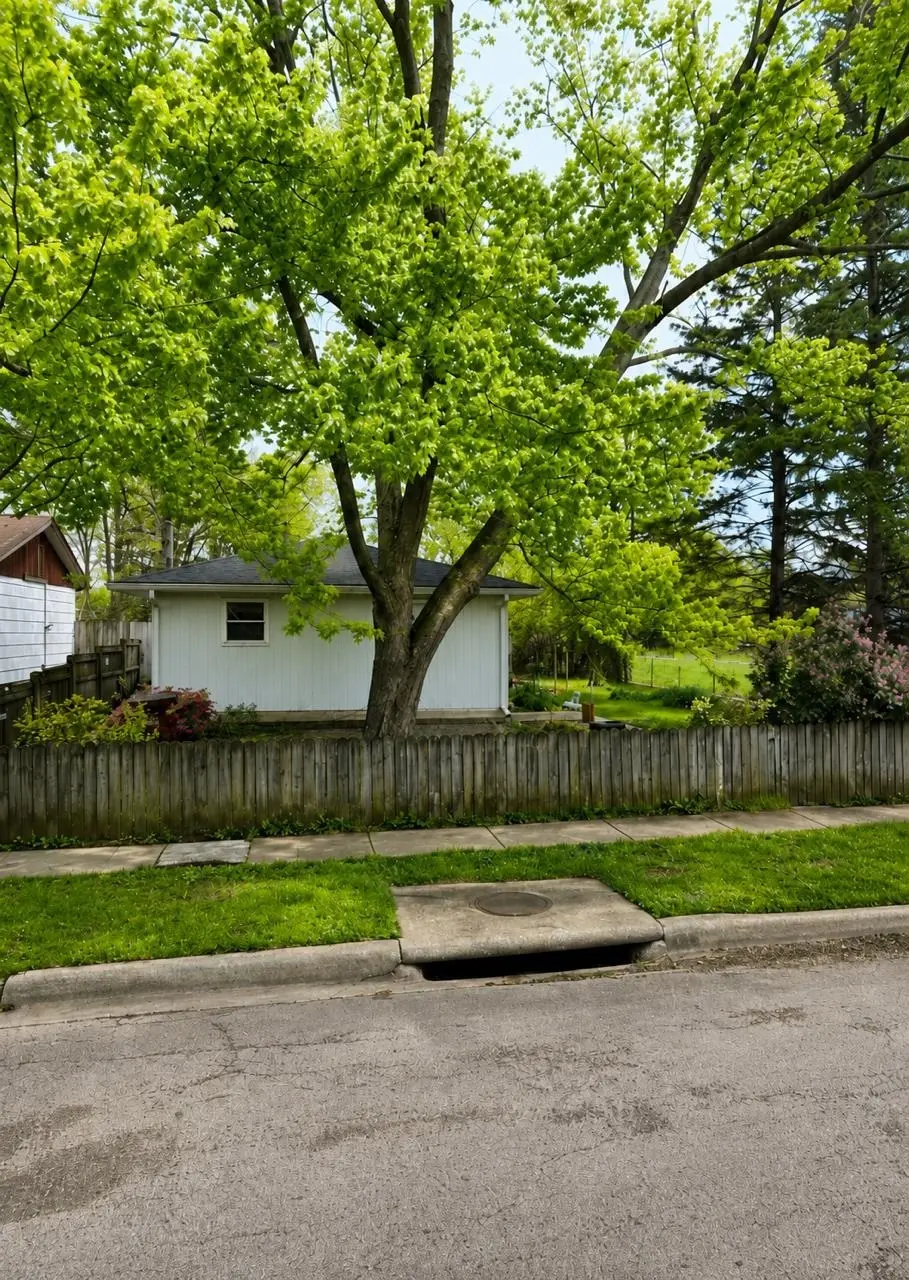
Listing remarks
Well maintained ranch style duplex! Each side is two beds and one bath with a large living room and a large eat in kitchen. Private parking in the back part of the building.
Key facts
- 2 parking spots
- Built 1968
Neighborhood map
What this means for you Summary
Snapshot
- This is a 2 × 2-bed/1.0-bath units multifamily listed at $150k. Condition is rated fair.
Deal economics
- At list price, monthly cash flow is $409 ($5k/yr) — positive. Per door: $205/mo.
- The deal already cash-flows at list — no discount required.
- Meets the 1% rule at list price ($2k rent vs $150k).
- Cap rate 13.3% vs local median 6.1% in Rockford — top-decile yield for the area; either an underpriced asset or a hidden risk that comps aren't pricing in. Stress-test before assuming the spread holds.
Location & tenants
- Location reads 62/100 on livability (#876 in IL) — a middle-class / working-renter tenant base. Strengths: cost of living A+, housing A+, health & safety A+; Watch: schools F, crime F, amenities F.
- Rockford SD 205 (urban): math 12% / reading 16% proficiency, ranked #533 of 620 in IL (top 86%) — low school quality limits family demand, transient renter base, plan for 1-2y turnover; 73% free/reduced lunch — lower-income household profile, screen leases tightly.
- Market conditions: 76 active listings in the ZIP; 25 comparable units currently listed for rent nearby; rentals at typical pace (median 21d on market — plan ~3-4 weeks tenant-placement turnaround); 285 units permitted in Winnebago County in 2024 (0 in 5+ unit buildings).
- At $2,413/mo this rent would consume 63% of the median local household income ($46k/yr) (locally 1170% of renters already pay >50% of income on rent) — very limited rent-growth headroom before tenants either downsize or default.
Forward outlook
- Local home prices are declining (-3.0%/yr); year-one equity from $1k of loan paydown is wiped out by about $4k of value loss. Plan a longer hold.
- Winnebago County population projected at -20% by 2050 — secular population decline; favor cash flow + early exit over multi-decade hold.
- At projected returns (-3.0% appreciation + 3.0% rent growth), your $42k cash investment doubles in ~10 years — after that, you're playing with house money.
Negotiation context
- Only 0 days on market — expect competitive offers; lowballing is unlikely to land.
Risks & watch-outs
- Watch-outs: flood insurance adds $460/mo.
- Climate carrying-cost: in FEMA flood zone AE (mandatory federal flood insurance) — expect insurance premiums to compound above CPI over the hold.
Questions for the listing agent
- Can we see the unit-by-unit rent roll, current vacancy, and any below-market leases? What's the average tenancy length?
- What capital expenditures (roof, boiler, parking lot, exteriors) have been made in the last 5 years, and what's planned in the next 2?
- Have any recent inspections been done? Can we get a copy of the seller's disclosures and any deferred-maintenance estimates?
- Built in 1968 — when were the roof, HVAC, electrical panel, plumbing, and water heater last replaced?
- What's the actual annual flood-insurance premium (NFIP or private), and is the property in a SFHA with mandatory coverage?
- Is there a deadline driving the sale (1031 exchange, divorce, estate, relocation)? That informs how much negotiation room exists.
- Schools are F-rated, which usually means shorter tenancies and higher turnover. Who's the typical renter profile here, and what's been the actual vacancy rate?
- Crime grade is F in this area — have there been break-ins, vandalism, or insurance claims at this property in the last 3 years? What carrier currently insures it and at what premium?
- What's the average days-on-market for RENTAL listings here right now (not sales)? A rising rental-DOM trend means longer vacancies and softer asking-rent achievability than the comps imply.
- What's the recent tenant-quality profile in this submarket — average credit score on applications, eviction rate, late-payment / NSF rate, and stable-employment percentage? A property-management company in the area should have these aggregated.
- How much new apartment / multifamily construction is in the pipeline within 1–3 miles? Heavy new supply (>2% of stock underway) typically softens rents 12–24 months out; light construction supports rent growth.
Investment metrics
- 1% rule
- 1.61% ✓
- Cap rate
- 13.25%
- Cash-on-cash
- 24.85%
- DSCR
- 2.11
- GRM
- 5.2
CMA / ARV
No comps found within radius.
Show comp detail 12 sales within ~0.75 mi
| Address | Dist | Beds/Ba | Sqft | Sold | Price | $/sf | Match |
|---|---|---|---|---|---|---|---|
| 3326 Montrose Ave | 0.13mi | 4/2.0 | — | 4mo | $110,000 | — | 78 |
| 3229 Liberty Dr | 0.12mi | 4/2.0 | — | 12mo | $163,000 | — | 72 |
| 1015 Furman St | 0.33mi | 4/2.0 | — | 1mo | $116,000 | — | 71 |
| 1423-1425 Arthur Ave | 0.38mi | 4/2.0 | — | 2mo | $105,000 | — | 68 |
| 2006 Richmond St | 0.20mi | 5/2.0 (+1) | — | 10mo | $175,000 | — | 64 |
| 1103 Irving Ave | 0.33mi | 4/2.0 | — | 10mo | $135,000 | — | 64 |
| 2003 Elmwood St | 0.40mi | 4/2.0 | — | 9mo | $151,000 | — | 62 |
| 3107 Garfield Dr | 0.46mi | 3/2.0 (-1) | 450 | 4mo | $130,000 | $289 | 58 |
| 3025 Parkside Ave | 0.30mi | 3/2.0 (-1) | — | 13mo | $138,000 | — | 58 |
| 1212 Blaisdell St | 0.69mi | 4/2.0 | — | 4mo | $164,000 | — | 52 |
| 819 Albert Ave | 0.65mi | 4/2.0 | — | 8mo | $87,500 | — | 50 |
| 1230 Auburn Ct | 0.72mi | 4/4.0 | — | 12mo | $154,900 | — | 36 |
Match score weights: distance 35% · size 25% · config 20% · recency 20%. Top-matched comps best support the ARV.
Projected returns pro-forma
-3.0% appreciation · 3.0% rent growth · sell at horizon
- IRR
- 1.3%
- Equity multiple
- 1.05×
- Total profit
- $2,077
- Equity at exit
- $22,365
- IRR
- 11.1%
- Equity multiple
- 1.87×
- Total profit
- $36,669
- Equity at exit
- $12,969
Cash invested: $42,000 (down + closing). Projections, not guarantees.
Landlord ↔ Tenant lean methodology
- Overall (STATE)
- 43 Moderately Tenant-Leaning
- State Illinois
- 43 Moderately Tenant-Leaning · D+7
- County
- — inherits STATE
- City
- — inherits STATE
ZIP-level market 61101
- Home prices YoY
- -25.4%
- Active inventory
- 76
- Price-to-rent
- 10.4×
Monthly cashflow live
- Estimated rent
- $2,413 high interval (Pro) →
- Mortgage (P&I)
- −$787
- Tax est. 1.5%
- −$188 /mo · $2,250/yr
- Insurance
- −$62
- Flood insurance flood zone
- −$460 /mo · $5,525/yr
- HOA
- −$0
- Vacancy / Maint / Mgmt
- −$507
- Net cashflow
- $409
Break-even live
2-unit breakdown (identical units grouped — click to expand)
| Units | Beds | Baths | Est. rent |
|---|---|---|---|
| 2× units | 2 | 1 | $2,412 |
| #1 | 2 | 1 | $1,206 |
| #2 | 2 | 1 | $1,206 |
| Total (2 units) | $2,413 | ||
UW: 25.0% down · 7.5% · 30yr · 1.5% tax · 5.0% vac · 8.0% maint · 8.0% mgmt
Financing live
Cash to close
- Down payment
- $37,500
- Closing costs
- $4,500
- Reserves months
- —
- Total cash needed
- —
Loan-product check · same deal, 3 products live
Conventional
25% down · 7.5% · 30yr
- Down + closing
- —
- Monthly P&I
- —
- Monthly cashflow
- —
- DSCR
- —
- Eligible?
- —
Personal DTI + credit; lowest rate.
DSCR
20% down · 8.5% · 30yr
- Down + closing
- —
- Monthly P&I
- —
- Monthly cashflow
- —
- DSCR
- —
- Eligible?
- —
No personal income docs; deal must DSCR.
Hard money
10% down · 12.0% · 12mo
- Down + closing
- —
- Monthly P&I
- —
- Monthly cashflow
- —
- DSCR
- —
- Eligible?
- —
Short-term bridge; refi at stabilization.
Rent comps 25 comps
| Address | Beds | Baths | Sqft | Rent | $/sqft | DOM | Units | Dist |
|---|---|---|---|---|---|---|---|---|
| 3133 Liberty Dr Rockford, IL | 3.0 | 1.5 | — | $1,675 | — | 21d | 1 | 0.24mi |
| 2330 Kilburn Ave Rockford, IL | 2.0–3.0 | 1.0–2.0 | 950 | $1,199 | $1.26 | 13d | 1 | 0.35mi |
| 1146 Fairview Ave Rockford, IL | 4.0 | 1.5 | 1344 | $1,250 | $0.93 | 21d | 1 | 0.63mi |
| 1510 School St Unit 1 Rockford, IL | 3.0 | 1.5 | 1400 | $1,200 | $0.86 | 43d | 1 | 0.79mi |
| 418 Orchard Park Rockford, IL | 3.0 | 1.0 | 1232 | $1,500 | $1.22 | 13d | 1 | 0.84mi |
| 2011 School St Rockford, IL | 3.0 | 1.0 | 950 | $1,500 | $1.58 | 43d | 1 | 0.88mi |
| 326 N Independence Ave Rockford, IL | 3.0 | 1.0 | — | $1,550 | — | 13d | 1 | 0.91mi |
| 2511 Ashland Ave Rockford, IL | 4.0 | 2.0 | 2504 | $2,900 | $1.16 | 21d | 1 | 0.95mi |
| 303 Forest Ave Rockford, IL | 4.0 | 1.0 | 1568 | $1,800 | $1.15 | 43d | 1 | 0.96mi |
| 210 Irving Ave Rockford, IL | 5.0 | 1.0 | 1202 | $1,850 | $1.54 | 43d | 1 | 1.01mi |
| 207 N Central Ave Rockford, IL | 4.0 | 1.5 | 1296 | $1,500 | $1.16 | 13d | 1 | 1.03mi |
| 2222 Andrews St Rockford, IL | 4.0 | 1.0 | 1400 | $1,600 | $1.14 | 13d | 1 | 1.05mi |
| 901 N Horace Ave Rockford, IL | 3.0 | 2.0 | 1400 | $1,700 | $1.21 | 13d | 1 | 1.05mi |
| 718 Locust St Rockford, IL | 3.0 | 1.0 | — | $1,550 | — | 13d | 1 | 1.18mi |
| 728 N Winnebago St Rockford, IL | 4.0 | 1.0 | 1250 | $1,600 | $1.28 | 13d | 1 | 1.19mi |
| 2019 Overdene Ave Rockford, IL | 3.0 | 1.0 | 875 | $1,400 | $1.60 | 13d | 1 | 1.30mi |
| 2019 Overdene Ave Rockford, IL | 3.0 | 1.0 | 875 | $1,500 | $1.71 | 43d | 1 | 1.30mi |
| 2916 School St Rockford, IL | 3.0 | 1.5 | 1578 | $2,400 | $1.52 | 43d | 1 | 1.31mi |
| 3016 School St Rockford, IL | 4.0 | 1.0 | 1090 | $1,400 | $1.28 | 43d | 1 | 1.36mi |
| 1823 Overdene Ave Rockford, IL | 3.0 | 1.0 | 875 | $1,500 | $1.71 | 21d | 1 | 1.40mi |
| 1823 Overdene Ave Rockford, IL | 3.0 | 1.0 | 875 | $1,400 | $1.60 | 13d | 1 | 1.40mi |
| 1803 Sauber Ave Rockford, IL | 3.0 | 1.0 | — | $1,400 | — | 21d | 1 | 1.41mi |
| 2535 Halsted Rd Rockford, IL | 3.0 | 1.0–1.5 | 850 | $1,399 | $1.65 | 13d | 1 | 1.41mi |
| 2315 Green St Rockford, IL | 3.0 | 1.0 | 1290 | $1,600 | $1.24 | 43d | 1 | 1.45mi |
| 3007 Huffman Blvd Rockford, IL | 3.0 | 1.5 | 1296 | $1,450 | $1.12 | 43d | 1 | 1.47mi |
Listing history 2 events
-
2026-06-10remarks 174-char remark
-
2026-06-10$150,000 Pending
ⓘ Source: listings_history table (triggers on properties + properties_extension) + one-shot
backfill from property_details.listing_events for pre-trigger history.
Climate risk First Street
- Flood 6/10 Major FEMA zone AE · 71% chance over 30 yrs
- Wildfire 1/10 Low
- Heat 2/10 Low 7 d/yr ≥102°F today · 15 d/yr by 30 yrs out
- Wind 2/10 Low
- Air quality 2/10 Low 1 unhealthy d/yr today · 2 by 30 yrs out
Nearby sold comps map
Loading sold comps map…
Walkable amenities ~0.75 mi
Loading nearby amenities…
Taxation est. · year 1
- Rental income
- $28,956
- − Mortgage interest
- −$8,402
- − Property taxes
- −$2,250
- − Insurance
- −$6,275
- − Repairs & maintenance
- −$2,316
- − Management
- −$2,316
- − Depreciation
- −$4,364
- Taxable income
- $3,032
- Est. tax owed @ 24.0%
- −$728
- After-tax cash flow
- $4,183/yr
For passive investors: Depreciation is non-cash, so a rental often shows a tax loss while cash-flowing — sheltering income. Rental losses are passive: they offset passive income freely, and up to $25,000/yr can offset ordinary (W-2) income if you actively participate and your MAGI is under $100k (phasing out to $0 by $150k); unused losses carry forward. On sale, claimed depreciation is recaptured at up to 25%, and gains may owe capital-gains tax (a 1031 exchange can defer both). Figures are a year-1 estimate at your 24.0% rate — not tax advice; consult a CPA.
Condition & rehab AI · 1 photo
A well-maintained ranch-style duplex with average exterior and interior conditions. Simple cosmetic upgrades can significantly enhance its value.
Value-add opportunities
- Both Paint exterior walls — Enhances curb appeal and can increase both resale and rental value.
- Both Upgrade landscaping — Improves curb appeal and can attract more renters or buyers.
- Both Replace windows — Can improve energy efficiency and increase both resale and rental value.
- Both Update HVAC system — Can improve comfort and energy efficiency, increasing both resale and rental value.
Renovation cost estimate screening
Value-add ROI direction
- Both Paint exterior walls — Enhances curb appeal and can increase both resale and rental value. ↑
- Both Upgrade landscaping — Improves curb appeal and can attract more renters or buyers. ↑
- Both Replace windows — Can improve energy efficiency and increase both resale and rental value. ↑
- Both Update HVAC system — Can improve comfort and energy efficiency, increasing both resale and rental value. ↑
ⓘ Cost ranges are severity-bucket heuristics (US national rule-of-thumb). Get contractor quotes + a written scope before underwriting a rehab budget.
Schools (NCES district)
- District
- Rockford SD 205
- NCES district ID
- 1734510
- Math proficiency
- 12% ▼ -2.00%
- Reading proficiency
- 16% ▼ -3.00%
- Median HH income
- $42,533
- Composite
- 12.21/100
- National rank
- #9649
- State rank
- #533 of 620 in IL
Livability — Rockford
- Score
- 62/100
- State rank
- #876
- US rank
- #17035
Category grades
Schools grade is shown separately in the Schools card above.
Census & demographics
- Census place
- Rockford, IL
- County
- Winnebago County · 147,297 people
- City population
- 147,297
- Metro
- Rockford, IL
- Population (ZIP)
- 19,318
- Household income
- $46,163
- Rent vs Own
- Severe rent burden
- 1170.0
Population outlook (Winnebago County) Hauer SSP2
- Today (2025)
- 271,080 people
- By 2030
- 260,684 · -3.8%
- By 2040
- 238,405 · -12.1%
- By 2050
- 216,129 · -20.3%
- By 2075
- 172,882 · -36.2%
- By 2100
- 135,336 · -50.1%
Race, ethnicity, and origin ACS 2023
- Neighborhood character
- Diverse neighborhood (Simpson 0.66)
- Race & ethnicity
- White 44% Black 34% Hispanic / Latino 16% Two or more races 8% Asian 1%
- Hispanic origin (detail)
- Mexican 14% Puerto Rican 1%
- Common ancestry
- Romanian 3% Italian 2% Portuguese 2%
- Foreign-born
- 9% · Canada
- Languages at home
- 84% English-only · Spanish 13% Other Indo-European 1% Russian/Polish/Slavic 1%
Political lean MEDSL · Winnebago
- 2024 margin
- Toss-up / Even · D 49.5% · R 49.0% · Other 1.5%
- 2008→2024 swing
- -12.2pp toward R · 2008: 12.8pp · 2024: 0.6pp
- All cycles
- 2024: D+0.6 2020: D+2.5 2016: R+1.2 2012: D+5.7 2008: D+12.8
Not yet ingested
- Civics
- —
Market trends
- HPI YoY
- ▼ -69.58%
- Current HPI
- 204.8946
- Rent YoY
- —
- Metro
- Rockford, IL
- State GDP YoY
- ▲ 1.59%
- F500 in state
- 60
Industry mix (Fortune 500 HQ in IL)
| Industry | F500 HQs | Revenue |
|---|---|---|
| Insurance | 4 | $201B |
|
||
| Consumer Goods | 4 | $87B |
|
||
| Industrial Machinery | 3 | $64B |
|
||
| Healthcare | 2 | $55B |
|
||
| Retail / Pharmacy | 1 | $148B |
|
||
| Agriculture / Food | 1 | $86B |
|
||
Price history
2 events — show timeline
- 2026-06-09 Delisted — NWIAR
- 2026-06-09 Listed $150,000 NWIAR
Cash-flow waterfall
monthlySold comps — $/sqft
last 12 mo · ≤1 miLoading sold comps…