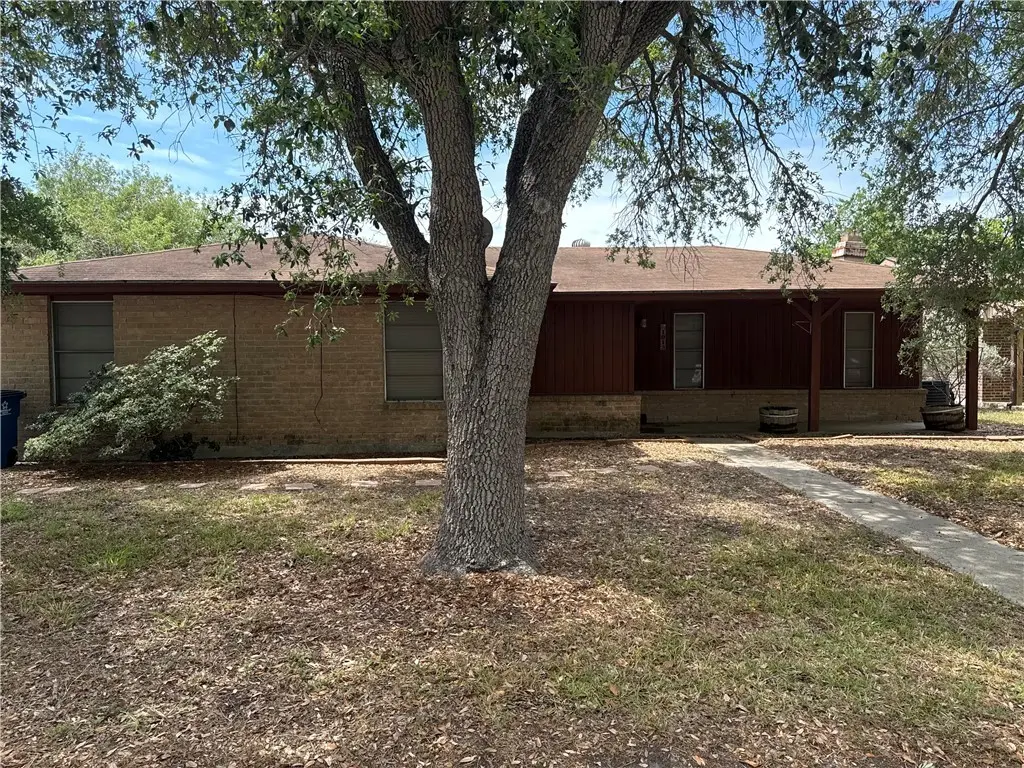
1913 Dolphin Dr · Portland, TX
Flood risk 1/10 · Minimal
- FEMA flood zone
- X (unshaded)
- Chance of flooding over 30 yrs
- 0.0%
- Est. flood insurance / yr
- $507 – $1,088
Fire risk 1/10 · Minimal
- Est. fire insurance / yr
- $1,222 – $2,270
Heat risk 10/10 · Severe
- Hot days now (above 106°F)
- 7 days/yr
- Hot days in 30 yrs
- 27 days/yr
Wind risk 9/10 · Severe
- Chance of severe wind over 30 yrs
- 99.0%
Air-quality risk 1/10 · Minimal
- Unhealthy air days now
- 0 days/yr
- Unhealthy air days in 30 yrs
- 0 days/yr
Risk factors via First Street. Map © Google.
Why this score? — see what drove the C- grade
The composite is a weighted blend of 9 inputs, each scored 0–100. Each bar is that input's sub-score; the figure is the points it added to the 100-point composite (weight × sub-score).
- Cash flow +16.2/30.0
- ARV discount +15.0/15.0
- 1% rule +5.9/10.0
- DSCR +5.0/10.0
- Livability +4.0/5.0
- Schools +3.7/10.0
- Condition / age +2.5/5.0
- Rent growth +2.0/5.0
- Appreciation +0.0/10.0
$190,000
🖨 Deal sheet 📄 Offer letter ✓ Due diligence
Listing remarks
Selling AS IS !! Looking for Investors, Flippers, or a Buyer wanting take on a project and make it their own.
Key facts
- 7,000 sq ft lot
- 2 garage spots
- Built 1977
Property features AI
Exterior
- Parking: 2-car garage; Front entry and rear/side/off-street parking
- Utilities: Public water; Public sewer
- Home design: Single-story home
- Construction: Brick and wood siding construction; Shingle roof; Slab foundation; Built on a 0.16-acre lot
- Exterior features: Storage; Chain link and wood fencing
Interior
- Bathrooms: 2 full bathrooms; 1 half bathroom
- Heating & cooling: Central heating (electric); Central air conditioning
- Interior features: Other interior features
Neighborhood map
What this means for you Summary
Snapshot
- This is a 3-bed/2.5-bath single-family listed at $190k.
Deal economics
- At list price, monthly cash flow is $101 ($1k/yr) — positive.
- The deal already cash-flows at list — no discount required.
- Meets the 1% rule at list price ($2k rent vs $190k).
- Recommended offer: $184k (3.0% below list) — sets the bar for market timing.
- Cap rate 6.9% vs local median 4.2% in Portland — top-decile yield for the area; either an underpriced asset or a hidden risk that comps aren't pricing in. Stress-test before assuming the spread holds.
Location & tenants
- Location reads 80/100 on livability (#36 in TX, #1,740 nationally) — a professional / high-income tenant draw. Strengths: employment A+, cost of living A+, housing A+; Watch: amenities F, commute F.
- Gregory-Portland ISD (suburban): math 41% / reading 42% proficiency, ranked #314 of 826 in TX (top 38%) — families likely to look elsewhere, expect single-tenant / working-renter base with shorter leases.
- Market conditions: Rents soft (-1.8%/yr); 302 active listings in the ZIP; 14 comparable units currently listed for rent nearby; rentals leasing fast (median 14d on market — plan ~1-2 weeks tenant-placement turnaround); solid renter incomes; 344 units permitted in San Patricio County in 2024 (0 in 5+ unit buildings).
Forward outlook
- Local home prices are declining (-3.0%/yr); year-one equity from $1k of loan paydown is wiped out by about $6k of value loss. Plan a longer hold.
- San Patricio County population projected at +27% by 2050 — long-run rental-demand tailwind backs the buy-and-hold thesis.
Negotiation context
- It's been on market 56 days — a 3% lower offer ($184k) is reasonable based on typical stale-listing flexibility.
Risks & watch-outs
- Watch-outs: property tax is 2.9% of price.
- Climate carrying-cost: severe wind risk, 99% chance of damaging wind over 30y; extreme-heat days projected 7→27/yr by 2055 (HVAC capex compounding) — expect insurance premiums to compound above CPI over the hold.
Questions for the listing agent
- It's been on market 56 days. Have you received any prior offers? Is the seller open to a 3% concession, seller financing, or rate buy-down credit?
- Built in 1977 — when were the roof, HVAC, electrical panel, plumbing, and water heater last replaced?
- Property tax is high relative to price — has the assessment been appealed recently, and will the sale trigger a re-assessment?
- Is there a deadline driving the sale (1031 exchange, divorce, estate, relocation)? That informs how much negotiation room exists.
- What's the average days-on-market for RENTAL listings here right now (not sales)? A rising rental-DOM trend means longer vacancies and softer asking-rent achievability than the comps imply.
- What's the recent tenant-quality profile in this submarket — average credit score on applications, eviction rate, late-payment / NSF rate, and stable-employment percentage? A property-management company in the area should have these aggregated.
- How much new for-sale + rental construction is in the pipeline within 1–3 miles? Heavy new supply typically softens prices + rents 12–24 months out; constrained supply supports both.
Investment metrics
- 1% rule
- 1.09% ✓
- Cap rate
- 6.93%
- Cash-on-cash
- 2.28%
- DSCR
- 1.10
- GRM
- 7.6
CMA / ARV
- ARV (median comp)
- $247,904
- List price
- $190,000
- Delta
- -23.36%
- Verdict
- UNDERPRICED
- Comps
- 20 within 1.0 mi
Show comp detail 12 sales within ~0.75 mi
| Address | Dist | Beds/Ba | Sqft | Sold | Price | $/sf | Match |
|---|---|---|---|---|---|---|---|
| 2020 Oak Ridge Dr | 0.25mi | 3/2.0 | 1,852 (+2%) | 2mo | $250,000 | $135 | 82 |
| 2204 Live Oak | 0.22mi | 3/2.0 | 1,894 (+4%) | 1mo | $319,000 | $168 | 79 |
| 2218 Memorial Pkwy | 0.35mi | 3/2.0 | 1,865 (+3%) | 1mo | $260,000 | $139 | 76 |
| 2331 Willow Dr | 0.49mi | 3/2.0 | 1,812 (-0%) | 1mo | $219,500 | $121 | 74 |
| 1812 White Ibis Dr | 0.49mi | 3/2.0 | 1,817 (+0%) | 2mo | $379,900 | $209 | 73 |
| 1816 Clapper Rail Dr | 0.45mi | 3/2.0 | 1,896 (+4%) | 1mo | $399,900 | $211 | 69 |
| 2018 Chesapeake Bay Dr | 0.40mi | 3/2.0 | 1,940 (+7%) | 1mo | $314,000 | $162 | 67 |
| 2417 Oak Brook Dr | 0.66mi | 4/2.0 (+1) | 1,823 (+0%) | 1mo | $314,000 | $172 | 61 |
| 2207 Tallow Dr | 0.73mi | 4/2.0 (+1) | 1,853 (+2%) | 2mo | $329,900 | $178 | 54 |
| 2103 Fury | 0.60mi | 3/2.0 | 1,595 (-12%) | 2mo | $319,990 | $201 | 48 |
| 2145 Medusa Dr | 0.57mi | 4/3.0 (+1) | 2,024 (+12%) | 1mo | $308,999 | $153 | 46 |
| 2131 Artemis Dr | 0.74mi | 3/2.0 | 1,634 (-10%) | 1mo | $271,999 | $166 | 46 |
Match score weights: distance 35% · size 25% · config 20% · recency 20%. Top-matched comps best support the ARV.
Projected returns pro-forma
-3.0% appreciation · 0.0% rent growth · sell at horizon
- IRR
- -16.6%
- Equity multiple
- 0.43×
- Total profit
- $-30,266
- Equity at exit
- $28,330
- IRR
- -16.3%
- Equity multiple
- 0.23×
- Total profit
- $-40,860
- Equity at exit
- $16,428
Cash invested: $53,200 (down + closing). Projections, not guarantees.
Landlord ↔ Tenant lean methodology
- Overall (STATE)
- 87 Strongly Landlord-Friendly
- State Texas
- 87 Strongly Landlord-Friendly · R+5
- County
- — inherits STATE
- City
- — inherits STATE
ZIP-level market 78374
- Rents YoY
- -1.8%
- Active inventory
- 302
- Price-to-rent
- 7.6×
Monthly cashflow live
- Estimated rent
- $2,072 high interval (Pro) →
- Mortgage (P&I)
- −$996
- Tax from tax record
- −$460 /mo · $5,521/yr
- Insurance
- −$79
- HOA
- −$0
- Vacancy / Maint / Mgmt
- −$435
- Net cashflow
- $101
Break-even live
UW: 25.0% down · 7.5% · 30yr · 1.5% tax · 5.0% vac · 8.0% maint · 8.0% mgmt
Financing live
Cash to close
- Down payment
- $47,500
- Closing costs
- $5,700
- Reserves months
- —
- Total cash needed
- —
Loan-product check · same deal, 3 products live
Conventional
25% down · 7.5% · 30yr
- Down + closing
- —
- Monthly P&I
- —
- Monthly cashflow
- —
- DSCR
- —
- Eligible?
- —
Personal DTI + credit; lowest rate.
DSCR
20% down · 8.5% · 30yr
- Down + closing
- —
- Monthly P&I
- —
- Monthly cashflow
- —
- DSCR
- —
- Eligible?
- —
No personal income docs; deal must DSCR.
Hard money
10% down · 12.0% · 12mo
- Down + closing
- —
- Monthly P&I
- —
- Monthly cashflow
- —
- DSCR
- —
- Eligible?
- —
Short-term bridge; refi at stabilization.
Rent comps 14 comps
| Address | Beds | Baths | Sqft | Rent | $/sqft | DOM | Units | Dist |
|---|---|---|---|---|---|---|---|---|
| 1801 Atascosa Dr Portland, TX | 3.0 | 2.0 | 1594 | $1,600 | $1.00 | 13d | 1 | 0.26mi |
| 2201 Timberline Dr Unit Na Portland, TX | 4.0 | 2.0 | 1484 | $2,200 | $1.48 | 13d | 1 | 0.57mi |
| 2012 Cottonwood Dr Portland, TX | 4.0 | 2.0 | 1619 | $2,350 | $1.45 | 21d | 1 | 0.59mi |
| 2112 Westwood Dr Portland, TX | 4.0 | 3.5 | 1863 | $2,350 | $1.26 | 13d | 1 | 0.67mi |
| 1825 Billy G Webb Portland, TX | 1.0–3.0 | 1.0–2.0 | 1009 | $1,983 | $1.97 | 13d | 32 | 0.73mi |
| 1203 Athena Dr Portland, TX | 3.0 | 2.0 | 1535 | $2,400 | $1.56 | 13d | 1 | 0.89mi |
| 1601 Moore Ave Portland, TX | 2.0–3.0 | 2.0–2.5 | 1295 | $1,899 | $1.47 | 13d | 18 | 0.93mi |
| 1461 Moore Ave Portland, TX | 2.0 | 2.5 | 1313 | $1,750 | $1.33 | 13d | 1 | 1.03mi |
| 101 Terlingua Dr Portland, TX | 3.0 | 2.0 | 1367 | $1,995 | $1.46 | 13d | 1 | 1.09mi |
| 1506 Briar St Portland, TX | 3.0 | 2.0 | 1803 | $2,300 | $1.28 | 43d | 1 | 1.11mi |
| 544 Olympic Portland, TX | 1.0–3.0 | 1.0–2.5 | 1079 | $2,825 | $2.62 | 13d | 8 | 1.16mi |
| 1012 Memorial Pkwy Portland, TX | 3.0 | 2.0 | 1409 | $1,850 | $1.31 | 43d | 1 | 1.18mi |
| 207 Blanco Dr Portland, TX | 4.0 | 2.0 | 1701 | $2,550 | $1.50 | 43d | 1 | 1.29mi |
| 217 Palmer Dr Portland, TX | 3.0 | 2.0 | 1904 | $2,175 | $1.14 | 13d | 1 | 1.47mi |
Listing history 18 events
-
2026-06-18days on market $190,000 Active 56 DOM
-
2026-06-17days on market $190,000 Active 55 DOM
-
2026-06-16days on market $190,000 Active 54 DOM
-
2026-06-15days on market $190,000 Active 53 DOM
-
2026-06-14days on market $190,000 Active 51 DOM
-
2026-06-13days on market $190,000 Active 50 DOM
-
2026-06-10days on market $190,000 Active 48 DOM
-
2026-06-09days on market $190,000 Active 47 DOM
-
2026-06-08days on market $190,000 Active 46 DOM
-
2026-06-07days on market $190,000 Active 45 DOM
-
2026-06-03days on market $190,000 Active 41 DOM
-
2026-06-02days on market $190,000 Active 40 DOM
-
2026-06-01days on market $190,000 Active 39 DOM
-
2026-05-31days on market $190,000 Active 38 DOM
-
2026-05-30days on market $190,000 Active 37 DOM
-
2026-04-23$190,000 Active 111-char remark
-
2025-10-22soldstatus
-
2008-05-07soldstatus
ⓘ Source: listings_history table (triggers on properties + properties_extension) + one-shot
backfill from property_details.listing_events for pre-trigger history.
Tax reassessment forecast TX · Resets to sale price
- Current annual tax
- $5,521 · $460/mo
- Projected year-2 tax
- $5,521 · $460/mo
- Expected delta
- $0/yr ($0/mo · 0.0%)
ⓘ Screening estimate from a state-policy table — verify with the county assessor before closing.
Climate risk First Street
- Flood 1/10 Low FEMA zone X (unshaded) · 0% chance over 30 yrs
- Wildfire 1/10 Low
- Heat 10/10 Extreme 7 d/yr ≥106°F today · 27 d/yr by 30 yrs out
- Wind 9/10 Extreme 99% chance of damaging wind over 30 yrs
- Air quality 1/10 Low 0 unhealthy d/yr today · 0 by 30 yrs out
Nearby sold comps map
Loading sold comps map…
Walkable amenities ~0.75 mi
Loading nearby amenities…
Taxation est. · year 1
- Rental income
- $24,858
- − Mortgage interest
- −$10,643
- − Property taxes
- −$5,521
- − Insurance
- −$950
- − Repairs & maintenance
- −$1,989
- − Management
- −$1,989
- − Depreciation
- −$5,527
- Taxable loss
- −$1,760
- Est. tax savings @ 24.0%
- +$422
- After-tax cash flow
- $1,633/yr
For passive investors: Depreciation is non-cash, so a rental often shows a tax loss while cash-flowing — sheltering income. Rental losses are passive: they offset passive income freely, and up to $25,000/yr can offset ordinary (W-2) income if you actively participate and your MAGI is under $100k (phasing out to $0 by $150k); unused losses carry forward. On sale, claimed depreciation is recaptured at up to 25%, and gains may owe capital-gains tax (a 1031 exchange can defer both). Figures are a year-1 estimate at your 24.0% rate — not tax advice; consult a CPA.
Schools (NCES district)
- District
- Gregory-Portland ISD
- NCES district ID
- 4821780
- Math proficiency
- 41% ▼ -15.00%
- Reading proficiency
- 42% ▼ -9.00%
- Median HH income
- $59,135
- Composite
- 36.62/100
- National rank
- #4622
- State rank
- #314 of 826 in TX
Livability — Portland
- Score
- 80/100
- State rank
- #36
- US rank
- #1740
Category grades
Schools grade is shown separately in the Schools card above.
Census & demographics
- Census place
- Portland, TX
- County
- San Patricio County · 31,224 people
- City population
- 20,408
- Metro
- Corpus Christi, TX
- Population (ZIP)
- 20,408
- Household income
- $83,504
- Rent vs Own
- Severe rent burden
- 523.0
Population outlook (San Patricio County) Hauer SSP2
- Today (2025)
- 75,538 people
- By 2030
- 79,575 · +5.3%
- By 2040
- 87,670 · +16.1%
- By 2050
- 96,107 · +27.2%
- By 2075
- 117,984 · +56.2%
- By 2100
- 130,010 · +72.1%
Race, ethnicity, and origin ACS 2023
- Neighborhood character
- Diverse neighborhood (Simpson 0.57)
- Race & ethnicity
- White 51% Hispanic / Latino 41% Two or more races 19% Asian 2% Black 2%
- Hispanic origin (detail)
- Mexican 35% Cuban 2%
- Common ancestry
- Lithuanian 2% Slovak 2% Estonian 1%
- Foreign-born
- 7% · Canada
- Languages at home
- 79% English-only · Spanish 18% Other Indo-European 2% Tagalog/Filipino 0%
Political lean MEDSL · San Patricio
- 2024 margin
- Solid R (+36.4) · D 31.4% · R 67.8%
- 2008→2024 swing
- -19.8pp toward R · 2008: -16.6pp · 2024: -36.4pp
- All cycles
- 2024: R+36.4 2020: R+29.1 2016: R+24.1 2012: R+20.6 2008: R+16.6
Not yet ingested
- Civics
- —
Market trends
- HPI YoY
- ▼ -227.28%
- Current HPI
- 166.5529
- Rent YoY
- ▼ -1.84%
- Metro
- Corpus Christi, TX
- State GDP YoY
- ▲ 3.95%
- F500 in state
- 110
Industry mix (Fortune 500 HQ in TX)
| Industry | F500 HQs | Revenue |
|---|---|---|
| Energy | 16 | $1,198B |
|
||
| Technology | 5 | $198B |
|
||
| Engineering / Construction | 4 | $72B |
|
||
| Energy Services | 3 | $60B |
|
||
| Utilities | 3 | $41B |
|
||
| Healthcare | 2 | $330B |
|
||
Price history
3 events — show timeline
- 2026-04-23 Listed $190,000 CBMLS
- 2025-10-22 Sold (Public Records) — Public Records
- 2008-05-07 Sold (Public Records) — Public Records
Property tax history
+5.2%/yrLatest (2025): $5,521 · +13.1% YoY. Source: county tax records.
Cash-flow waterfall
monthlySold comps — $/sqft
last 12 mo · ≤1 miLoading sold comps…