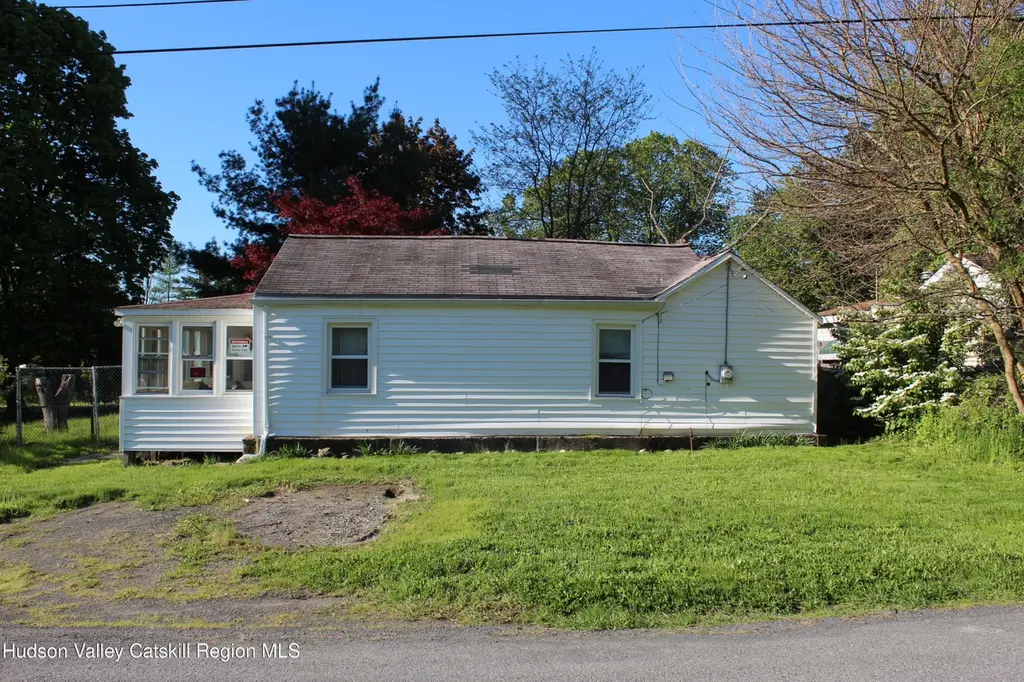
10 Ravish Rd · Stottville, NY
Flood risk 1/10 · Minimal
- FEMA flood zone
- X
- Chance of flooding over 30 yrs
- 0.0%
- Est. flood insurance / yr
- $507 – $1,088
Fire risk 4/10 · Minor
- Est. fire insurance / yr
- $691 – $1,283
Heat risk 4/10 · Minor
- Hot days now (above 98°F)
- 7 days/yr
- Hot days in 30 yrs
- 16 days/yr
Wind risk 3/10 · Minor
- Chance of severe wind over 30 yrs
- 9.0%
Air-quality risk 2/10 · Minimal
- Unhealthy air days now
- 0 days/yr
- Unhealthy air days in 30 yrs
- 1 days/yr
Risk factors via First Street. Map © Google.
Why this score? — see what drove the A grade
The composite is a weighted blend of 9 inputs, each scored 0–100. Each bar is that input's sub-score; the figure is the points it added to the 100-point composite (weight × sub-score).
- Cash flow +30.0/30.0
- ARV discount +15.0/15.0
- 1% rule +10.0/10.0
- DSCR +10.0/10.0
- Appreciation +10.0/10.0
- Rent growth +5.0/5.0
- Schools +3.6/10.0
- Livability +2.9/5.0
- Condition / age +2.5/5.0
$134,900
🖨 Deal sheet 📄 Offer letter ✓ Due diligence
Listing remarks
Great investment or new starter opportunity to buy this house in Greenport. It's walking distance from shopping center, restaurant and bank. Handy man special. . Cash buyer preferred. Not qualified for FHA mortgage. PROPERTY SOLD AS IS!!!
Key facts
- 8,276 sq ft lot
- Built 1970
- Listed 37 days
Tags
Property features AI
Exterior
- Parking: Driveway
- Security: Carbon monoxide detector(s); Smoke detector(s)
- Utilities: Public water; Public sewer; 100 amp electric service with fuses; Natural gas available and connected; Electricity connected; Sewer connected; Water connected; Cable available
- Home design: Single family residence; One story; House
- Construction: Vinyl siding; Slab foundation
- Exterior features: Enclosed patio/porch; Back yard; City lot; Few trees; Paved road; Publicly maintained road; City street frontage; Fenced yard with wire fencing; Asphalt/shingle roof
Interior
- Kitchen: Free-standing refrigerator
- Flooring: Laminate; Linoleum
- Bathrooms: 1 full bathroom
- Heating & cooling: Hot water heating; Natural gas heating; Steam heating; Has heating
- Interior features: Free-standing refrigerator; Laminate flooring; Linoleum flooring
Neighborhood map
What this means for you Summary
Snapshot
- This is a 2-bed/1.0-bath single-family listed at $135k.
Deal economics
- At list price, monthly cash flow is $764 ($9k/yr) — positive.
- The deal already cash-flows at list — no discount required.
- Meets the 1% rule at list price ($2k rent vs $135k).
- Recommended offer: $131k (3.0% below list) — sets the bar for market timing.
Location & tenants
- Location reads 58/100 on livability (#1,070 in NY) — a working-class tenant base; expect higher turnover. Strengths: crime A, housing A-; Watch: employment D+, schools F, amenities F.
- Hudson City School District (town): math 38% / reading 47% proficiency, ranked #494 of 590 in NY (top 84%) — families likely to look elsewhere, expect single-tenant / working-renter base with shorter leases.
- Market conditions: Rents rising fast (+10.9%/yr); 161 active listings in the ZIP; 1 comparable units currently listed for rent nearby; 136 units permitted in Columbia County in 2024 (0 in 5+ unit buildings).
- This rent runs 37% of the median local income ($73k/yr) — at the standard rent-burdened threshold; future hikes will face affordability resistance.
Forward outlook
- In year one you build about $14k of equity ($933 loan paydown + $13k appreciation (10.0% local appreciation)).
- Columbia County population projected at -22% by 2050 — secular population decline; favor cash flow + early exit over multi-decade hold.
- At projected returns (10.0% appreciation + 8.0% rent growth), your $38k cash investment doubles in ~2 years — after that, you're playing with house money.
- By year 3, paydown + projected appreciation supports a ~$37k cash-out refi (75% LTV) — recoverable capital for the next deal without selling this one.
Negotiation context
- It's been on market 38 days — a 3% lower offer ($131k) is reasonable based on typical stale-listing flexibility.
- Current owner paid $66k; list at $135k implies a 106% gain — meaningful room to come down on a strong offer.
Questions for the listing agent
- It's been on market 38 days. Have you received any prior offers? Is the seller open to a 3% concession, seller financing, or rate buy-down credit?
- Built in 1970 — when were the roof, HVAC, electrical panel, plumbing, and water heater last replaced?
- Is there a deadline driving the sale (1031 exchange, divorce, estate, relocation)? That informs how much negotiation room exists.
- Schools are F-rated, which usually means shorter tenancies and higher turnover. Who's the typical renter profile here, and what's been the actual vacancy rate?
- What's the average days-on-market for RENTAL listings here right now (not sales)? A rising rental-DOM trend means longer vacancies and softer asking-rent achievability than the comps imply.
- What's the recent tenant-quality profile in this submarket — average credit score on applications, eviction rate, late-payment / NSF rate, and stable-employment percentage? A property-management company in the area should have these aggregated.
- How much new for-sale + rental construction is in the pipeline within 1–3 miles? Heavy new supply typically softens prices + rents 12–24 months out; constrained supply supports both.
Investment metrics
- 1% rule
- 1.67% ✓
- Cap rate
- 13.09%
- Cash-on-cash
- 24.27%
- DSCR
- 2.08
- GRM
- 5.0
CMA / ARV
- ARV (median comp)
- $178,317
- List price
- $134,900
- Delta
- -24.35%
- Verdict
- UNDERPRICED
- Comps
- 3 within 1.0 mi
Show comp detail 1 sale within ~0.75 mi
| Address | Dist | Beds/Ba | Sqft | Sold | Price | $/sf | Match |
|---|---|---|---|---|---|---|---|
| 6618 - 6620 Bickel Ln | 0.45mi | 2/1.5 | 672 (-7%) | 8mo | $165,000 | $246 | 58 |
Match score weights: distance 35% · size 25% · config 20% · recency 20%. Top-matched comps best support the ARV.
Projected returns pro-forma
10.0% appreciation · 8.0% rent growth · sell at horizon
- IRR
- 45.6%
- Equity multiple
- 4.55×
- Total profit
- $134,123
- Equity at exit
- $121,529
- IRR
- 41.7%
- Equity multiple
- 11.23×
- Total profit
- $386,383
- Equity at exit
- $262,081
Cash invested: $37,772 (down + closing). Projections, not guarantees.
Landlord ↔ Tenant lean methodology
- Overall (STATE)
- 15 Strongly Tenant-Friendly
- State New York
- 15 Strongly Tenant-Friendly · D+10
- County
- — inherits STATE
- City
- — inherits STATE
ZIP-level market 12534
- Home prices YoY
- 5.6%
- Rents YoY
- 10.9%
- Active inventory
- 161
- Price-to-rent
- 5.0×
Monthly cashflow live
- Estimated rent
- $2,254 medium interval (Pro) →
- Mortgage (P&I)
- −$707
- Tax from tax record
- −$253 /mo · $3,034/yr
- Insurance
- −$56
- HOA
- −$0
- Vacancy / Maint / Mgmt
- −$473
- Net cashflow
- $764
Break-even live
UW: 25.0% down · 7.5% · 30yr · 1.5% tax · 5.0% vac · 8.0% maint · 8.0% mgmt
Financing live
Cash to close
- Down payment
- $33,725
- Closing costs
- $4,047
- Reserves months
- —
- Total cash needed
- —
Loan-product check · same deal, 3 products live
Conventional
25% down · 7.5% · 30yr
- Down + closing
- —
- Monthly P&I
- —
- Monthly cashflow
- —
- DSCR
- —
- Eligible?
- —
Personal DTI + credit; lowest rate.
DSCR
20% down · 8.5% · 30yr
- Down + closing
- —
- Monthly P&I
- —
- Monthly cashflow
- —
- DSCR
- —
- Eligible?
- —
No personal income docs; deal must DSCR.
Hard money
10% down · 12.0% · 12mo
- Down + closing
- —
- Monthly P&I
- —
- Monthly cashflow
- —
- DSCR
- —
- Eligible?
- —
Short-term bridge; refi at stabilization.
Rent comps 1 comps
| Address | Beds | Baths | Sqft | Rent | $/sqft | DOM | Units | Dist |
|---|---|---|---|---|---|---|---|---|
| 540 Joslen Blvd Hudson, NY | 1.0–2.0 | 1.0–2.0 | 733 | $2,250 | $3.07 | 21d | 1 | 0.41mi |
Listing history 19 events
-
2026-06-19days on market $134,900 Active 38 DOM
-
2026-06-18price $134,900 Active 37 DOM
-
2026-06-18days on market $139,900 Active 37 DOM
-
2026-06-17days on market $139,900 Active 36 DOM
-
2026-06-16days on market $139,900 Active 35 DOM
-
2026-06-15days on market $139,900 Active 34 DOM
-
2026-06-14days on market $139,900 Active 32 DOM
-
2026-06-12days on market $139,900 Active 31 DOM
-
2026-06-09days on market $139,900 Active 28 DOM
-
2026-06-08days on market $139,900 Active 27 DOM
-
2026-06-07days on market $139,900 Active 26 DOM
-
2026-06-04days on market $139,900 Active 22 DOM
-
2026-06-02days on market $139,900 Active 21 DOM
-
2026-06-01price $139,900 Active 20 DOM
-
2026-06-01days on market $144,900 Active 20 DOM
-
2026-05-31days on market $144,900 Active 19 DOM
-
2026-05-31days on market $144,900 Active 18 DOM
-
2026-05-12$144,900 Active 238-char remark
-
2004-07-26soldstatus $65,500
ⓘ Source: listings_history table (triggers on properties + properties_extension) + one-shot
backfill from property_details.listing_events for pre-trigger history.
Tax reassessment forecast NY · Partial reset (capped growth)
- Current annual tax
- $3,034 · $253/mo
- Projected year-2 tax
- $3,034 · $253/mo
- Expected delta
- $0/yr ($0/mo · 0.0%)
ⓘ Screening estimate from a state-policy table — verify with the county assessor before closing.
Climate risk First Street
- Flood 1/10 Low FEMA zone X · 0% chance over 30 yrs
- Wildfire 4/10 Moderate
- Heat 4/10 Moderate 7 d/yr ≥98°F today · 16 d/yr by 30 yrs out
- Wind 3/10 Moderate 9% chance of damaging wind over 30 yrs
- Air quality 2/10 Low 0 unhealthy d/yr today · 1 by 30 yrs out
Nearby sold comps map
Loading sold comps map…
Walkable amenities ~0.75 mi
Loading nearby amenities…
Taxation est. · year 1
- Rental income
- $27,045
- − Mortgage interest
- −$7,556
- − Property taxes
- −$3,034
- − Insurance
- −$674
- − Repairs & maintenance
- −$2,164
- − Management
- −$2,164
- − Depreciation
- −$3,924
- Taxable income
- $7,528
- Est. tax owed @ 24.0%
- −$1,807
- After-tax cash flow
- $7,361/yr
For passive investors: Depreciation is non-cash, so a rental often shows a tax loss while cash-flowing — sheltering income. Rental losses are passive: they offset passive income freely, and up to $25,000/yr can offset ordinary (W-2) income if you actively participate and your MAGI is under $100k (phasing out to $0 by $150k); unused losses carry forward. On sale, claimed depreciation is recaptured at up to 25%, and gains may owe capital-gains tax (a 1031 exchange can defer both). Figures are a year-1 estimate at your 24.0% rate — not tax advice; consult a CPA.
Schools (NCES district)
- District
- Hudson City School District
- NCES district ID
- 3614940
- Math proficiency
- 38% ▲ 4.00%
- Reading proficiency
- 47% ▲ 7.00%
- Median HH income
- $44,663
- Composite
- 36.03/100
- National rank
- #4779
- State rank
- #494 of 590 in NY
Livability — Stottville
- Score
- 58/100
- State rank
- #1070
- US rank
- #21454
Category grades
Schools grade is shown separately in the Schools card above.
Census & demographics
- Census place
- Stottville, NY
- County
- Columbia County · 17,176 people
- City population
- 17,176
- Metro
- Hudson, NY
- Population (ZIP)
- 17,176
- Household income
- $72,741
- Rent vs Own
- Severe rent burden
- 1083.0
Population outlook (Columbia County) Hauer SSP2
- Today (2025)
- 58,662 people
- By 2030
- 56,557 · -3.6%
- By 2040
- 51,324 · -12.5%
- By 2050
- 45,790 · -21.9%
- By 2075
- 35,232 · -39.9%
- By 2100
- 25,846 · -55.9%
Race, ethnicity, and origin ACS 2023
- Neighborhood character
- Predominantly White (74%)
- Race & ethnicity
- White 74% Two or more races 7% Black 7% Hispanic / Latino 7% Asian 6%
- Hispanic origin (detail)
- Mexican 2% Puerto Rican 1%
- Common ancestry
- Lithuanian 4% Romanian 4% Iranian 3%
- Foreign-born
- 10% · Canada, China
- Languages at home
- 88% English-only · Spanish 5% Other Indo-European 3% Chinese 1%
Political lean MEDSL · Columbia
- 2024 margin
- D (+14.7) · D 57.4% · R 42.6%
- 2008→2024 swing
- +1.3pp toward D · 2008: 13.4pp · 2024: 14.7pp
- All cycles
- 2024: D+14.7 2020: D+16.7 2016: D+1.4 2012: D+11.7 2008: D+13.4
Not yet ingested
- Civics
- —
Market trends
- HPI YoY
- ▲ 25.98%
- Current HPI
- 490.0412
- Rent YoY
- ▲ 10.88%
- Metro
- Hudson, NY
- State GDP YoY
- ▲ 2.60%
- F500 in state
- 92
Industry mix (Fortune 500 HQ in NY)
| Industry | F500 HQs | Revenue |
|---|---|---|
| Financial Services | 10 | $950B |
|
||
| Consumer Goods | 9 | $162B |
|
||
| Insurance | 4 | $225B |
|
||
| Telecommunications | 2 | $144B |
|
||
| Pharmaceuticals | 2 | $112B |
|
||
| Media / Entertainment | 2 | $69B |
|
||
Price history
+113.6% since first listed3 events — show timeline
- 2026-06-01 Price Changed $139,900 HVCRMLS
- 2026-05-12 Listed $144,900 HVCRMLS
- 2004-07-26 Sold (Public Records) $65,500 Public Records
Property tax history
+7.9%/yrLatest (2025): $3,034 · +85.1% YoY. Source: county tax records.
Cash-flow waterfall
monthlySold comps — $/sqft
last 12 mo · ≤1 miLoading sold comps…