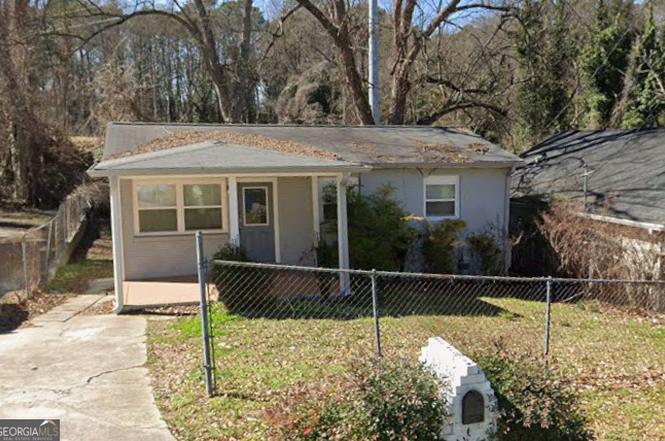
116 Dahlia Ave NW · Atlanta, GA
Flood risk 1/10 · Minimal
- FEMA flood zone
- X (unshaded)
- Chance of flooding over 30 yrs
- 0.0%
- Est. flood insurance / yr
- $473 – $860
Fire risk 1/10 · Minimal
- Est. fire insurance / yr
- $963 – $1,789
Heat risk 5/10 · Moderate
- Hot days now (above 103°F)
- 7 days/yr
- Hot days in 30 yrs
- 18 days/yr
Wind risk 4/10 · Minor
- Chance of severe wind over 30 yrs
- 23.0%
Air-quality risk 4/10 · Minor
- Unhealthy air days now
- 3 days/yr
- Unhealthy air days in 30 yrs
- 5 days/yr
Risk factors via First Street. Map © Google.
Why this score? — see what drove the D- grade
The composite is a weighted blend of 9 inputs, each scored 0–100. Each bar is that input's sub-score; the figure is the points it added to the 100-point composite (weight × sub-score).
- Cash flow +12.9/30.0
- ARV discount +5.3/15.0
- 1% rule +4.7/10.0
- Livability +4.2/5.0
- DSCR +3.9/10.0
- Rent growth +3.1/5.0
- Schools +2.7/10.0
- Condition / age +2.5/5.0
- Appreciation +0.0/10.0
$161,175
🖨 Deal sheet 📄 Offer letter ✓ Due diligence
Listing remarks
The list price is not indicative of seller's final reserve amount. This property is part of an online bidding event; please visit Auction.com to place bids. Inspections of this property and contact with occupants are strictly prohibited. Property is sold "as is" and no for sale sign allowed.
Key facts
- 5,662 sq ft lot
- Built 1958
- Listed 65 days
Neighborhood map
What this means for you Summary
Snapshot
- This is a 3-bed/2.0-bath single-family listed at $161k.
Deal economics
- At list price, monthly cash flow is $-11 ($-127/yr) — negative.
- To cash-flow at today's rent, offer at most $159k (1.2% below list).
- To meet the 1% rule (rent ≥ 1% of price), the offer needs to be $156k (3.2% below list).
- Recommended offer: $152k (6.0% below list) — sets the bar for market timing.
- Cap rate 6.2% vs local median 3.1% in Atlanta — top-decile yield for the area; either an underpriced asset or a hidden risk that comps aren't pricing in. Stress-test before assuming the spread holds.
Location & tenants
- Location reads 83/100 on livability (#6 in GA, #919 nationally) — a professional / high-income tenant draw. Strengths: amenities A+, commute A+, housing A+; Watch: cost of living C-.
- Atlanta Public Schools (urban): math 28% / reading 35% proficiency, ranked #80 of 174 in GA (top 46%) — families likely to look elsewhere, expect single-tenant / working-renter base with shorter leases; 71% free/reduced lunch — lower-income household profile, screen leases tightly.
- Zoned schools: Frederick Douglass High School (math 24%, 1,112 students, 100% FRL) — zoned schools average 100% FRL vs 71% district-wide (29 pts higher); higher-poverty schools than district average — tighter screening recommended.
- Market conditions: Rents rising (+2.5%/yr); 293 active listings in the ZIP; 31 comparable units currently listed for rent nearby; rentals at typical pace (median 24d on market — plan ~3-4 weeks tenant-placement turnaround); lower-income renter base — watch delinquency; 11,565 units permitted in Fulton County in 2024 (8,159 in 5+ unit buildings).
- This rent runs 45% of the median local income ($42k/yr) — at the standard rent-burdened threshold; future hikes will face affordability resistance.
Forward outlook
- Local home prices are declining (-3.0%/yr); year-one equity from $1k of loan paydown is wiped out by about $5k of value loss. Plan a longer hold.
- Fulton County population projected at +38% by 2050 — long-run rental-demand tailwind backs the buy-and-hold thesis.
Negotiation context
- It's been on market 65 days — a 6% lower offer ($152k) is reasonable based on typical stale-listing flexibility.
- 11 sale attempts since 12y ago; this cycle's ask is 169% above the opening price — seller raised mid-cycle; expect resistance to lowballs.
Risks & watch-outs
- Watch-outs: built in 1958 — expect roof / HVAC / electrical / plumbing capex.
- Climate carrying-cost: extreme-heat days projected 7→18/yr by 2055 (HVAC capex compounding) — expect insurance premiums to compound above CPI over the hold.
Questions for the listing agent
- What do current leases actually rent for vs. the listed asking? Can we see a recent rent roll and the last 12 months of T-12 income?
- It's been on market 65 days. Have you received any prior offers? Is the seller open to a 6% concession, seller financing, or rate buy-down credit?
- Built in 1958 — when were the roof, HVAC, electrical panel, plumbing, and water heater last replaced?
- Why hasn't it sold? Are there any deal-killer items the seller is aware of (foundation, flood, title, zoning, code violations)?
- Is there a deadline driving the sale (1031 exchange, divorce, estate, relocation)? That informs how much negotiation room exists.
- The area grade is low — what's the realistic commute time and amenity access for the typical tenant pool here? Any planned neighborhood developments (good or bad) we should know about?
- What's the average days-on-market for RENTAL listings here right now (not sales)? A rising rental-DOM trend means longer vacancies and softer asking-rent achievability than the comps imply.
- What's the recent tenant-quality profile in this submarket — average credit score on applications, eviction rate, late-payment / NSF rate, and stable-employment percentage? A property-management company in the area should have these aggregated.
- How much new for-sale + rental construction is in the pipeline within 1–3 miles? Heavy new supply typically softens prices + rents 12–24 months out; constrained supply supports both.
Investment metrics
- 1% rule
- 0.97% ✗
- Cap rate
- 6.21%
- Cash-on-cash
- -0.28%
- DSCR
- 0.99
- GRM
- 8.6
CMA / ARV
- ARV (on-the-fly)
- $153,582
- Comps found
- 12
Show comp detail 12 sales within ~0.75 mi
| Address | Dist | Beds/Ba | Sqft | Sold | Price | $/sf | Match |
|---|---|---|---|---|---|---|---|
| 116 Dahlia Ave NW | 0.00mi | 3/2.0 | 858 (0%) | 1mo | $66,675 | $78 | 99 |
| 1 Lamar Ave SW | 0.39mi | 2/2.0 (-1) | 800 (-7%) | 3mo | $185,000 | $231 | 63 |
| 225 Joe Louis Dr NW | 0.30mi | 3/2.0 | 784 (-9%) | 14mo | $165,000 | $210 | 60 |
| 2073 Morehouse Dr NW | 0.55mi | 2/2.0 (-1) | 798 (-7%) | 1mo | $195,000 | $244 | 57 |
| 191 Florida Ave SW | 0.43mi | 3/1.0 | 950 (+11%) | 3mo | $135,000 | $142 | 56 |
| 210 Joe Louis Dr NW | 0.26mi | 3/2.0 | 972 (+13%) | 14mo | $212,000 | $218 | 54 |
| 311 Henry Aaron Ave | 0.69mi | 2/1.0 (-1) | 841 (-2%) | 5mo | $75,000 | $89 | 51 |
| 2161 Penelope St NW | 0.38mi | 3/2.0 | 960 (+12%) | 15mo | $237,500 | $247 | 50 |
| 2631 Godfrey Dr NW | 0.70mi | 3/1.0 | 840 (-2%) | 12mo | $150,000 | $179 | 50 |
| 2043 Chicago Ave NW | 0.74mi | 3/1.0 | 915 (+7%) | 2mo | $120,000 | $131 | 49 |
| 2200 Larchwood Rd SW | 0.65mi | 2/2.0 (-1) | 984 (+15%) | 3mo | $146,000 | $148 | 38 |
| 350 New Jersey Ave NW | 0.68mi | 2/1.0 (-1) | 943 (+10%) | 10mo | $60,000 | $64 | 34 |
Match score weights: distance 35% · size 25% · config 20% · recency 20%. Top-matched comps best support the ARV.
Projected returns pro-forma
-3.0% appreciation · 2.53% rent growth · sell at horizon
- IRR
- -17.3%
- Equity multiple
- 0.39×
- Total profit
- $-27,422
- Equity at exit
- $24,032
- IRR
- -10.1%
- Equity multiple
- 0.39×
- Total profit
- $-27,312
- Equity at exit
- $13,935
Cash invested: $45,129 (down + closing). Projections, not guarantees.
Landlord ↔ Tenant lean methodology
- Overall (STATE)
- 90 Strongly Landlord-Friendly
- State Georgia
- 90 Strongly Landlord-Friendly · R+3
- County
- — inherits STATE
- City
- — inherits STATE
ZIP-level market 30314
- Home prices YoY
- -22.9%
- Rents YoY
- 2.5%
- Active inventory
- 293
- Price-to-rent
- 8.6×
Monthly cashflow live
- Estimated rent
- $1,561 high interval (Pro) →
- Mortgage (P&I)
- −$845
- Tax from tax record
- −$331 /mo · $3,976/yr
- Insurance
- −$67
- HOA
- −$0
- Vacancy / Maint / Mgmt
- −$328
- Net cashflow
- $-11
Break-even live
UW: 25.0% down · 7.5% · 30yr · 1.5% tax · 5.0% vac · 8.0% maint · 8.0% mgmt
Financing live
Cash to close
- Down payment
- $40,294
- Closing costs
- $4,835
- Reserves months
- —
- Total cash needed
- —
Loan-product check · same deal, 3 products live
Conventional
25% down · 7.5% · 30yr
- Down + closing
- —
- Monthly P&I
- —
- Monthly cashflow
- —
- DSCR
- —
- Eligible?
- —
Personal DTI + credit; lowest rate.
DSCR
20% down · 8.5% · 30yr
- Down + closing
- —
- Monthly P&I
- —
- Monthly cashflow
- —
- DSCR
- —
- Eligible?
- —
No personal income docs; deal must DSCR.
Hard money
10% down · 12.0% · 12mo
- Down + closing
- —
- Monthly P&I
- —
- Monthly cashflow
- —
- DSCR
- —
- Eligible?
- —
Short-term bridge; refi at stabilization.
Rent comps 31 comps
| Address | Beds | Baths | Sqft | Rent | $/sqft | DOM | Units | Dist |
|---|---|---|---|---|---|---|---|---|
| 156 Fairfield Pl NW Unit B-9 Atlanta, GA | 2.0 | 1.0 | 750 | $1,199 | $1.60 | 24d | 1 | 0.19mi |
| 2175 Pansy St NW Atlanta, GA | 2.0 | 1.0 | 624 | $1,403 | $2.25 | 24d | 1 | 0.23mi |
| 2423 M.L.K. Jr Dr SW Atlanta, GA | 1.0–3.0 | 1.0–2.0 | 1120 | $1,750 | $1.56 | 1d | 19 | 0.34mi |
| 2199 Tiger Flowers Dr NW Atlanta, GA | 3.0 | 1.0 | 936 | $1,325 | $1.42 | 24d | 1 | 0.38mi |
| 2227 Telhurst St SW Atlanta, GA | 2.0 | 2.0 | 928 | $1,395 | $1.50 | 3d | 1 | 0.41mi |
| 2227 Telhurst St SW Atlanta, GA | 2.0 | 2.0 | 928 | $1,395 | $1.50 | 13d | 1 | 0.41mi |
| 269 Florida Ave SW Atlanta, GA | 3.0 | 1.0 | 925 | $1,850 | $2.00 | 24d | 1 | 0.54mi |
| 166 Anderson Ave NW Unit B18 Atlanta, GA | 2.0 | 1.0 | 760 | $1,095 | $1.44 | 2d | 1 | 0.64mi |
| 166 Anderson Ave NW Unit B17 Atlanta, GA | 2.0 | 1.0 | 760 | $1,150 | $1.51 | 24d | 1 | 0.64mi |
| 166 Anderson Ave NW Unit B12 Atlanta, GA | 2.0 | 1.0 | 760 | $1,095 | $1.44 | 7d | 1 | 0.65mi |
| 166 Anderson Ave NW Apt B4 Atlanta, GA | 2.0 | 1.0 | 760 | $1,095 | $1.44 | 11d | 1 | 0.65mi |
| 100 Peyton Pl SW Atlanta, GA | 1.0–3.0 | 1.0–2.0 | 1040 | $1,799 | $1.73 | 1d | 26 | 0.76mi |
| 295 Penelope Dr NW Atlanta, GA | 1.0–2.0 | 1.0 | 751 | $1,542 | $2.05 | 21d | 1 | 0.81mi |
| 488 Park Valley Dr NW Atlanta, GA | 3.0 | 1.0 | 840 | $2,500 | $2.98 | 24d | 1 | 0.85mi |
| 1839 Penelope Rd NW Atlanta, GA | 3.0 | 1.0 | 988 | $1,400 | $1.42 | 24d | 1 | 0.85mi |
| 2059 Detroit Ave NW Atlanta, GA | 2.0 | 1.0 | 750 | $1,340 | $1.79 | 21d | 1 | 0.87mi |
| 1916 Joseph E. Boone Blvd NW Unit A Atlanta, GA | 3.0 | 1.0 | 1100 | $1,550 | $1.41 | 20d | 1 | 0.88mi |
| 1916 Joseph E. Boone Blvd NW Unit B Atlanta, GA | 2.0 | 1.0 | 1000 | $1,195 | $1.20 | 24d | 1 | 0.88mi |
| 139 Peyton Pl SW Atlanta, GA | 2.0 | 1.5 | 1008 | $1,150 | $1.14 | 24d | 1 | 0.92mi |
| 139 Peyton Pl SW Atlanta, GA | 2.0 | 2.0 | 1008 | $1,150 | $1.14 | 4d | 1 | 0.92mi |
| 340 Dixie Hills Cir NW Unit C1 Atlanta, GA | 2.0 | 1.0 | 775 | $1,099 | $1.42 | 24d | 1 | 0.93mi |
| 511 Emily Pl NW Atlanta, GA | 3.0 | 1.0 | 1101 | $1,745 | $1.58 | 24d | 1 | 1.10mi |
| 1894 North Ave NW Atlanta, GA | 2.0 | 1.5 | 1098 | $1,995 | $1.82 | 24d | 1 | 1.11mi |
| 2875 Hedgewood Dr NW Atlanta, GA | 3.0 | 2.0 | 1100 | $1,700 | $1.55 | 16d | 1 | 1.16mi |
| 1958 Maywood Pl NW Atlanta, GA | 2.0 | 1.0 | 829 | $1,425 | $1.72 | 5d | 1 | 1.24mi |
| 1699 Derry Ave SW Atlanta, GA | 2.0 | 1.0 | 825 | $1,800 | $2.18 | 24d | 1 | 1.37mi |
| 2740 Oldknow Dr NW Unit A Atlanta, GA | 2.0 | 2.0 | 1100 | $2,050 | $1.86 | 24d | 1 | 1.39mi |
| 2762 Oldknow Dr NW Atlanta, GA | 2.0 | 1.0 | 880 | $1,600 | $1.82 | 24d | 1 | 1.42mi |
| 1595 Carlisle St NW Unit 1 Atlanta, GA | 2.0 | 1.0 | 900 | $1,200 | $1.33 | 24d | 1 | 1.45mi |
| 371 Lanier St NW #1 Atlanta, GA | 2.0 | 1.0 | 700 | $1,250 | $1.79 | 7d | 1 | 1.45mi |
| 280 Holly Rd NW Unit B Atlanta, GA | 2.0 | 2.0 | 1100 | $1,650 | $1.50 | 24d | 1 | 1.47mi |
Listing history 46 events
-
2026-04-15status Under Contract
-
2026-02-21price $161,175
-
2026-02-10price $266,761
-
2026-02-09$60,000 New
-
2026-02-07historical
-
2026-02-06$266,274
-
2025-10-27historical
-
2025-10-14$1 New
-
2022-03-18historical
-
2022-03-15soldstatus $280,000 Closed
-
2022-03-15soldstatus $280,000 Sold
-
2022-03-15soldstatus $280,000
-
2022-03-14status Pending
-
2022-03-14status Under Contract
-
2022-03-12status Active
-
2022-03-09historical
-
2022-03-09status Active
-
2022-02-03status Pending
-
2022-02-03status Under Contract
-
2022-01-28price $285,000
-
2022-01-28price $285,000
-
2022-01-28price $294,400
-
2022-01-27price $294,400
-
2022-01-27price $294,500
-
2022-01-26price $294,500
-
2022-01-12$295,000 Active
-
2022-01-12$295,000 New
-
2021-09-01soldstatus $85,000
-
2016-11-10soldstatus $28,000 Sold
-
2016-11-10soldstatus $28,000 Sold
-
2016-10-25status Under Contract
-
2016-10-25historical Pending
-
2016-09-04$34,000 New
-
2016-09-04$34,000 Active
-
2014-11-25historical
-
2014-11-24soldstatus $10,000 Sold
-
2014-11-24soldstatus $10,000 Sold
-
2014-11-12status Under Contract
-
2014-11-12status Pending
-
2014-07-07$10,000 New
-
2014-07-07$10,000 Active
-
2006-11-13soldstatus $64,100
-
2006-11-13soldstatus $87,000
-
2004-10-21soldstatus $131,000
-
2004-07-26soldstatus $81,600
-
1998-11-06soldstatus $68,000
ⓘ Source: listings_history table (triggers on properties + properties_extension) + one-shot
backfill from property_details.listing_events for pre-trigger history.
Tax reassessment forecast GA · Resets to sale price
- Current annual tax
- $3,976 · $331/mo
- Projected year-2 tax
- $3,976 · $331/mo
- Expected delta
- $0/yr ($0/mo · 0.0%)
ⓘ Screening estimate from a state-policy table — verify with the county assessor before closing.
Climate risk First Street
- Flood 1/10 Low FEMA zone X (unshaded) · 0% chance over 30 yrs
- Wildfire 1/10 Low
- Heat 5/10 Major 7 d/yr ≥103°F today · 18 d/yr by 30 yrs out
- Wind 4/10 Moderate 23% chance of damaging wind over 30 yrs
- Air quality 4/10 Moderate 3 unhealthy d/yr today · 5 by 30 yrs out
Nearby sold comps map
Loading sold comps map…
Walkable amenities ~0.75 mi
Loading nearby amenities…
Taxation est. · year 1
- Rental income
- $18,732
- − Mortgage interest
- −$9,028
- − Property taxes
- −$3,976
- − Insurance
- −$806
- − Repairs & maintenance
- −$1,499
- − Management
- −$1,499
- − Depreciation
- −$4,689
- Taxable loss
- −$2,765
- Est. tax savings @ 24.0%
- +$664
- After-tax cash flow
- $537/yr
For passive investors: Depreciation is non-cash, so a rental often shows a tax loss while cash-flowing — sheltering income. Rental losses are passive: they offset passive income freely, and up to $25,000/yr can offset ordinary (W-2) income if you actively participate and your MAGI is under $100k (phasing out to $0 by $150k); unused losses carry forward. On sale, claimed depreciation is recaptured at up to 25%, and gains may owe capital-gains tax (a 1031 exchange can defer both). Figures are a year-1 estimate at your 24.0% rate — not tax advice; consult a CPA.
Schools (NCES district)
- District
- Atlanta Public Schools
- NCES district ID
- 1300120
- Math proficiency
- 28% ▼ -6.00%
- Reading proficiency
- 35% ▼ -2.00%
- Median HH income
- $48,306
- Composite
- 27.27/100
- National rank
- #7006
- State rank
- #80 of 174 in GA
Livability — Atlanta
- Score
- 83/100
- State rank
- #6
- US rank
- #919
Category grades
Schools grade is shown separately in the Schools card above.
Census & demographics
- Census place
- Atlanta, GA
- County
- Fulton County · 1,094,430 people
- City population
- 629,525
- Metro
- Atlanta-Sandy Springs-Alpharetta, GA
- Population (ZIP)
- 23,333
- Household income
- $42,089
- Rent vs Own
- Severe rent burden
- 1293.0
Population outlook (Fulton County) Hauer SSP2
- Today (2025)
- 1,203,707 people
- By 2030
- 1,299,706 · +8.0%
- By 2040
- 1,488,256 · +23.6%
- By 2050
- 1,664,580 · +38.3%
- By 2075
- 2,036,072 · +69.2%
- By 2100
- 2,222,402 · +84.6%
Race, ethnicity, and origin ACS 2023
- Neighborhood character
- Predominantly Black (76%)
- Race & ethnicity
- Black 76% White 11% Hispanic / Latino 7% Asian 4% Two or more races 3%
- Hispanic origin (detail)
- Mexican 4% Dominican 1%
- Common ancestry
- Lithuanian 1%
- Foreign-born
- 6% · Canada, China, South Korea
- Languages at home
- 89% English-only · Spanish 5% Other Indo-European 1% Chinese 1%
Political lean MEDSL · Fulton
- 2024 margin
- Solid D (+44.9) · D 71.9% · R 27.0% · Other 1.1%
- 2008→2024 swing
- +9.8pp toward D · 2008: 35.0pp · 2024: 44.9pp
- All cycles
- 2024: D+44.9 2020: D+46.4 2016: D+42.1 2012: D+29.6 2008: D+35.0
Not yet ingested
- Civics
- —
Market trends
- HPI YoY
- ▼ -95.32%
- Current HPI
- 321.4626
- Rent YoY
- ▲ 2.53%
- Metro
- Atlanta-Sandy Springs-Alpharetta, GA
- State GDP YoY
- ▲ 2.66%
- F500 in state
- 28
Industry mix (Fortune 500 HQ in GA)
| Industry | F500 HQs | Revenue |
|---|---|---|
| Paper / Packaging | 2 | $29B |
|
||
| Retail | 1 | $160B |
|
||
| Transportation / Logistics | 1 | $91B |
|
||
| Airlines | 1 | $62B |
|
||
| Consumer Goods | 1 | $47B |
|
||
| Utilities | 1 | $25B |
|
||
Price history
+137.0% since first listed46 events — show timeline
- 2026-04-15 Pending — GAMLS
- 2026-02-21 Price Changed $161,175 GAMLS
- 2026-02-10 Price Changed $266,761 GAMLS
- 2026-02-09 Listed $60,000 GAMLS
- 2026-02-07 Listing Removed — GAMLS
- 2026-02-06 Listed $266,274 GAMLS
- 2025-10-27 Listing Removed — GAMLS
- 2025-10-14 Listed $1 GAMLS
- 2022-03-18 Listing Removed — FMLS
- 2022-03-15 Sold (Public Records) $280,000 Public Records
- 2022-03-15 Sold (MLS) $280,000 GAMLS
- 2022-03-15 Sold (MLS) $280,000 FMLS
- 2022-03-14 Pending — FMLS
- 2022-03-14 Pending — GAMLS
- 2022-03-12 Relisted — GAMLS
- 2022-03-09 Listing Removed — GAMLS
- 2022-03-09 Relisted — FMLS
- 2022-02-03 Pending — FMLS
- 2022-02-03 Pending — GAMLS
- 2022-01-28 Price Changed $285,000 FMLS
- 2022-01-28 Price Changed $285,000 GAMLS
- 2022-01-28 Price Changed $294,400 FMLS
- 2022-01-27 Price Changed $294,400 GAMLS
- 2022-01-27 Price Changed $294,500 FMLS
- 2022-01-26 Price Changed $294,500 GAMLS
- 2022-01-12 Listed $295,000 GAMLS
- 2022-01-12 Listed $295,000 FMLS
- 2021-09-01 Sold (Public Records) $85,000 Public Records
- 2016-11-10 Sold (MLS) $28,000 GAMLS
- 2016-11-10 Sold (MLS) $28,000 FMLS
- 2016-10-25 Pending — GAMLS
- 2016-10-25 Contingent — FMLS
- 2016-09-04 Listed $34,000 GAMLS
- 2016-09-04 Listed $34,000 FMLS
- 2014-11-25 Listing Removed — FMLS
- 2014-11-24 Sold (MLS) $10,000 GAMLS
- 2014-11-24 Sold (MLS) $10,000 FMLS
- 2014-11-12 Pending — GAMLS
- 2014-11-12 Pending — FMLS
- 2014-07-07 Listed $10,000 GAMLS
- 2014-07-07 Listed $10,000 FMLS
- 2006-11-13 Sold (Public Records) $87,000 Public Records
- 2006-11-13 Sold (Public Records) $64,100 Public Records
- 2004-10-21 Sold (Public Records) $131,000 Public Records
- 2004-07-26 Sold (Public Records) $81,600 Public Records
- 1998-11-06 Sold (Public Records) $68,000 Public Records
Property tax history
+6.6%/yrLatest (2025): $3,976 · +11.2% YoY. Source: county tax records.
Cash-flow waterfall
monthlySold comps — $/sqft
last 12 mo · ≤1 miLoading sold comps…