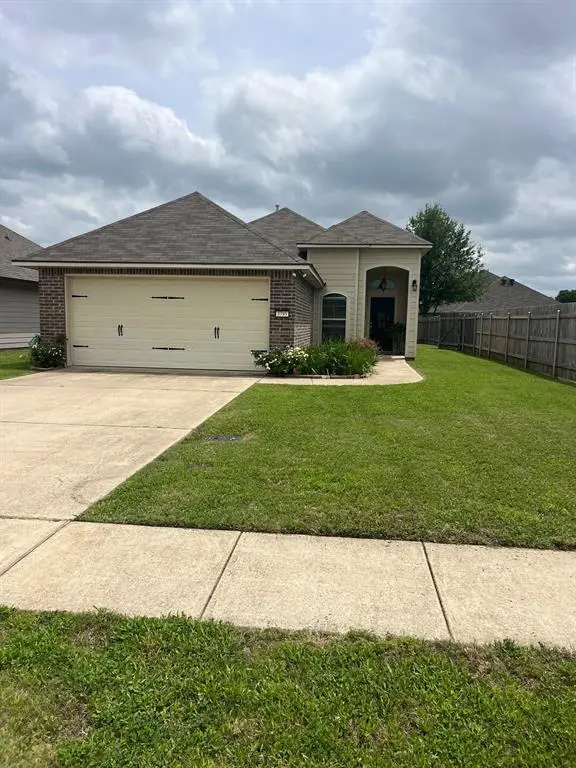
3795 Pickering Pass · Bossier City, LA
Flood risk 1/10 · Minimal
- FEMA flood zone
- X (unshaded)
- Chance of flooding over 30 yrs
- 0.0%
- Est. flood insurance / yr
- $507 – $1,088
Fire risk 3/10 · Minor
- Est. fire insurance / yr
- $1,269 – $2,357
Heat risk 7/10 · Major
- Hot days now (above 110°F)
- 7 days/yr
- Hot days in 30 yrs
- 23 days/yr
Wind risk 6/10 · Moderate
- Chance of severe wind over 30 yrs
- 73.0%
Air-quality risk 2/10 · Minimal
- Unhealthy air days now
- 1 days/yr
- Unhealthy air days in 30 yrs
- 1 days/yr
Risk factors via First Street. Map © Google.
Why this score? — see what drove the C- grade
The composite is a weighted blend of 9 inputs, each scored 0–100. Each bar is that input's sub-score; the figure is the points it added to the 100-point composite (weight × sub-score).
- Cash flow +17.8/30.0
- ARV discount +13.1/15.0
- DSCR +5.6/10.0
- Rent growth +4.1/5.0
- 1% rule +4.0/10.0
- Schools +3.8/10.0
- Livability +3.6/5.0
- Condition / age +2.5/5.0
- Appreciation +0.0/10.0
$225,000
🖨 Deal sheet 📄 Offer letter ✓ Due diligence
Listing remarks
Come see this nice 3 bedroom 2 bath home in one of Bossier City's fast-growing neighborhoods. Roof Replaced in 2020. New central AC just installed in April 2026 with 5 years of manufacture warranty. Home has hardwood floors, and ceramic tile, with carpet in the bedrooms. Stainless steel appliances in kitchen. Gas Range oven. Fridge to remain with acceptable offer. Quartz countertops in kitchen. Fenced in backyard.
Key facts
- 6,000 sq ft lot
- 2 garage spots
- Built 2016
Property features AI
Finance
- Other: Lot dimensions approximately 120 x 50; Lot is less than 0.5 acre (about 0.1377 acres); Subdivision: Legacy
- Financial info: Second mortgage present; Loan type treated as clear
- HOA & community: Mandatory association; Annual association fee (includes maintenance of grounds); HOA managed by Regency
Exterior
- Parking: Attached garage; 2 covered garage spaces
- Utilities: City water; City sewer; Not in a municipal utility district
- Home design: Single family residence; One story; Not attached to other properties; Accessible features present
- Construction: Built in 2016; Brick and siding exterior; Asphalt roof; Slab foundation
- Exterior features: Covered porch; Covered patio/porch; Wood fencing; Subdivision lot
Interior
- Kitchen: Disposal; Gas oven; Gas range
- Bedrooms: 3 bedrooms total; Primary bedroom on level 1 (12 x 10)
- Bathrooms: 2 full bathrooms
- Heating & cooling: Central heating; Central air conditioning
- Interior features: Pantry; One living area; One dining area; Accessible full bath
- Laundry & utility: Electric dryer hookup; Utility room; Full-size washer/dryer area
Neighborhood map
What this means for you Summary
Snapshot
- This is a 3-bed/2.0-bath single-family listed at $225k.
Deal economics
- At list price, monthly cash flow is $186 ($2k/yr) — positive.
- The deal already cash-flows at list — no discount required.
- To meet the 1% rule (rent ≥ 1% of price), the offer needs to be $203k (10.0% below list).
- Recommended offer: $203k (10.0% below list) — sets the bar for 1% rule.
- Cap rate 7.3% vs local median 4.7% in Bossier City — top-decile yield for the area; either an underpriced asset or a hidden risk that comps aren't pricing in. Stress-test before assuming the spread holds.
Location & tenants
- Location reads 71/100 on livability (#47 in LA) — a middle-class / working-renter tenant base. Strengths: commute A+, cost of living A+, housing A+; Watch: employment D+, crime F, amenities F.
- Bossier Parish (urban): math 40% / reading 47% proficiency, ranked #17 of 98 in LA (top 17%) — families likely to look elsewhere, expect single-tenant / working-renter base with shorter leases.
- Market conditions: Rents rising fast (+6.6%/yr); 421 active listings in the ZIP; 4 comparable units currently listed for rent nearby; rentals leasing fast (median 14d on market — plan ~1-2 weeks tenant-placement turnaround); 716 units permitted in Bossier Parish in 2024 (0 in 5+ unit buildings).
- This rent runs 37% of the median local income ($65k/yr) — at the standard rent-burdened threshold; future hikes will face affordability resistance.
Forward outlook
- Local home prices are declining (-3.0%/yr); year-one equity from $2k of loan paydown is wiped out by about $7k of value loss. Plan a longer hold.
- Bossier County population projected at +28% by 2050 — long-run rental-demand tailwind backs the buy-and-hold thesis.
Negotiation context
- It's been on market 42 days — a 3% lower offer ($218k) is reasonable based on typical stale-listing flexibility.
- Current owner paid $165k; 36% above their basis — modest negotiation headroom, anchor on the comps not their cost.
Risks & watch-outs
- Climate carrying-cost: major wind risk, 73% chance of damaging wind over 30y; extreme-heat days projected 7→23/yr by 2055 (HVAC capex compounding) — expect insurance premiums to compound above CPI over the hold.
Questions for the listing agent
- It's been on market 42 days. Have you received any prior offers? Is the seller open to a 10% concession, seller financing, or rate buy-down credit?
- What does the HOA fee cover, when was the last increase, and are there any pending special assessments or reserve-fund shortfalls?
- Is there a deadline driving the sale (1031 exchange, divorce, estate, relocation)? That informs how much negotiation room exists.
- Schools are B-rated — typically a magnet for longer-tenancy family renters. What's the average tenant stay here, and is there a school-zone premium baked into asking?
- Crime grade is F in this area — have there been break-ins, vandalism, or insurance claims at this property in the last 3 years? What carrier currently insures it and at what premium?
- What's the average days-on-market for RENTAL listings here right now (not sales)? A rising rental-DOM trend means longer vacancies and softer asking-rent achievability than the comps imply.
- What's the recent tenant-quality profile in this submarket — average credit score on applications, eviction rate, late-payment / NSF rate, and stable-employment percentage? A property-management company in the area should have these aggregated.
- How much new for-sale + rental construction is in the pipeline within 1–3 miles? Heavy new supply typically softens prices + rents 12–24 months out; constrained supply supports both.
Investment metrics
- 1% rule
- 0.90% ✗
- Cap rate
- 7.28%
- Cash-on-cash
- 3.54%
- DSCR
- 1.16
- GRM
- 9.3
CMA / ARV
- ARV (median comp)
- $256,771
- List price
- $225,000
- Delta
- -12.37%
- Verdict
- UNDERPRICED
- Comps
- 20 within 1.0 mi
Show comp detail 12 sales within ~0.75 mi
| Address | Dist | Beds/Ba | Sqft | Sold | Price | $/sf | Match |
|---|---|---|---|---|---|---|---|
| 3813 Pickering Pass Dr | 0.10mi | 3/2.0 | 1,160 (+3%) | 0mo | $225,000 | $194 | 91 |
| 4035 False River Dr | 0.21mi | 3/2.0 | 1,129 (0%) | 5mo | $219,900 | $195 | 86 |
| 3933 White Lake Dr | 0.19mi | 3/2.0 | 1,123 (-0%) | 10mo | $217,305 | $194 | 82 |
| 4194 Grassy Lake Dr | 0.31mi | 3/2.0 | 1,180 (+4%) | 11mo | $224,000 | $190 | 69 |
| 3316 Cane Break | 0.29mi | 3/2.0 | 1,258 (+11%) | 0mo | $235,000 | $187 | 67 |
| 3312 Cane Break Dr | 0.28mi | 3/2.0 | 1,278 (+13%) | 3mo | $220,000 | $172 | 62 |
| 3510 Grand Cane Ln | 0.17mi | 3/2.0 | 1,296 (+15%) | 8mo | $219,900 | $170 | 61 |
| 3433 Grand Cane Ln | 0.13mi | 3/2.0 | 1,297 (+15%) | 10mo | $249,900 | $193 | 61 |
| 4219 Toledo Bend Dr | 0.31mi | 3/2.0 | 1,297 (+15%) | 1mo | $257,040 | $198 | 60 |
| 4161 Grassy Lake Dr | 0.28mi | 3/2.0 | 1,297 (+15%) | 3mo | $257,332 | $198 | 60 |
| 4203 Toledo Bend Dr | 0.26mi | 3/2.0 | 1,297 (+15%) | 5mo | $257,765 | $199 | 59 |
| 4204 Toledo Bend Dr | 0.29mi | 3/2.0 | 1,297 (+15%) | 12mo | $259,560 | $200 | 52 |
Match score weights: distance 35% · size 25% · config 20% · recency 20%. Top-matched comps best support the ARV.
Projected returns pro-forma
-3.0% appreciation · 6.56% rent growth · sell at horizon
- IRR
- -7.1%
- Equity multiple
- 0.73×
- Total profit
- $-17,175
- Equity at exit
- $33,548
- IRR
- 6.2%
- Equity multiple
- 1.53×
- Total profit
- $33,232
- Equity at exit
- $19,454
Cash invested: $63,000 (down + closing). Projections, not guarantees.
Landlord ↔ Tenant lean methodology
- Overall (STATE)
- 90 Strongly Landlord-Friendly
- State Louisiana
- 90 Strongly Landlord-Friendly · R+12
- County
- — inherits STATE
- City
- — inherits STATE
ZIP-level market 71111
- Home prices YoY
- -34.8%
- Rents YoY
- 6.6%
- Active inventory
- 421
- Price-to-rent
- 9.3×
Monthly cashflow live
- Estimated rent
- $2,026 medium interval (Pro) →
- Mortgage (P&I)
- −$1,180
- Tax from tax record
- −$93 /mo · $1,118/yr
- Insurance
- −$94
- HOA
- −$48
- Vacancy / Maint / Mgmt
- −$425
- Net cashflow
- $186
Break-even live
UW: 25.0% down · 7.5% · 30yr · 1.5% tax · 5.0% vac · 8.0% maint · 8.0% mgmt
Financing live
Cash to close
- Down payment
- $56,250
- Closing costs
- $6,750
- Reserves months
- —
- Total cash needed
- —
Loan-product check · same deal, 3 products live
Conventional
25% down · 7.5% · 30yr
- Down + closing
- —
- Monthly P&I
- —
- Monthly cashflow
- —
- DSCR
- —
- Eligible?
- —
Personal DTI + credit; lowest rate.
DSCR
20% down · 8.5% · 30yr
- Down + closing
- —
- Monthly P&I
- —
- Monthly cashflow
- —
- DSCR
- —
- Eligible?
- —
No personal income docs; deal must DSCR.
Hard money
10% down · 12.0% · 12mo
- Down + closing
- —
- Monthly P&I
- —
- Monthly cashflow
- —
- DSCR
- —
- Eligible?
- —
Short-term bridge; refi at stabilization.
Rent comps 4 comps
| Address | Beds | Baths | Sqft | Rent | $/sqft | DOM | Units | Dist |
|---|---|---|---|---|---|---|---|---|
| 3461 Grand Cane Ln Bossier City, LA | 3.0 | 2.0 | 1297 | $2,100 | $1.62 | 13d | 1 | 0.10mi |
| 3283 Grand Lake Dr Bossier City, LA | 3.0 | 2.0 | 1302 | $1,950 | $1.50 | 21d | 1 | 0.21mi |
| 90 Kingston Xing Bossier City, LA | 1.0–3.0 | 1.0–2.0 | 1150 | $2,015 | $1.75 | 13d | 14 | 0.76mi |
| 3055 Vanceville Rd Bossier City, LA | 2.0–3.0 | 2.0 | 1112 | $1,995 | $1.79 | 13d | 6 | 1.02mi |
HOA detail
- Monthly dues
- $48 · $576/yr
- Likely covers
- gas
Listing history 16 events
-
2026-06-17status $225,000 Pending 42 DOM
-
2026-06-17days on market $225,000 Active 42 DOM
-
2026-06-16days on market $225,000 Active 41 DOM
-
2026-06-15days on market $225,000 Active 40 DOM
-
2026-06-14days on market $225,000 Active 38 DOM
-
2026-06-13days on market $225,000 Active 37 DOM
-
2026-06-10days on market $225,000 Active 35 DOM
-
2026-06-09days on market $225,000 Active 34 DOM
-
2026-06-08days on market $225,000 Active 33 DOM
-
2026-06-07days on market $225,000 Active 32 DOM
-
2026-06-02days on market $225,000 Active 27 DOM
-
2026-06-01days on market $225,000 Active 26 DOM
-
2026-05-31days on market $225,000 Active 25 DOM
-
2026-05-30days on market $225,000 Active 24 DOM
-
2026-05-05$225,000 Active 424-char remark
-
2018-01-26soldstatus $164,999
ⓘ Source: listings_history table (triggers on properties + properties_extension) + one-shot
backfill from property_details.listing_events for pre-trigger history.
Tax reassessment forecast LA · Resets to sale price
- Current annual tax
- $1,118 · $93/mo
- Projected year-2 tax
- $1,238 · $103/mo
- Expected delta
- +$119/yr (+$10/mo · 10.7%)
ⓘ Screening estimate from a state-policy table — verify with the county assessor before closing.
Climate risk First Street
- Flood 1/10 Low FEMA zone X (unshaded) · 0% chance over 30 yrs
- Wildfire 3/10 Moderate
- Heat 7/10 Severe 7 d/yr ≥110°F today · 23 d/yr by 30 yrs out
- Wind 6/10 Major 73% chance of damaging wind over 30 yrs
- Air quality 2/10 Low 1 unhealthy d/yr today · 1 by 30 yrs out
Nearby sold comps map
Loading sold comps map…
Walkable amenities ~0.75 mi
Loading nearby amenities…
Taxation est. · year 1
- Rental income
- $24,312
- − Mortgage interest
- −$12,603
- − Property taxes
- −$1,118
- − Insurance
- −$1,125
- − Repairs & maintenance
- −$1,945
- − Management
- −$1,945
- − HOA
- −$576
- − Depreciation
- −$6,545
- Taxable loss
- −$1,546
- Est. tax savings @ 24.0%
- +$371
- After-tax cash flow
- $2,599/yr
For passive investors: Depreciation is non-cash, so a rental often shows a tax loss while cash-flowing — sheltering income. Rental losses are passive: they offset passive income freely, and up to $25,000/yr can offset ordinary (W-2) income if you actively participate and your MAGI is under $100k (phasing out to $0 by $150k); unused losses carry forward. On sale, claimed depreciation is recaptured at up to 25%, and gains may owe capital-gains tax (a 1031 exchange can defer both). Figures are a year-1 estimate at your 24.0% rate — not tax advice; consult a CPA.
Schools (NCES district)
- District
- Bossier Parish
- NCES district ID
- 2200270
- Math proficiency
- 40% ▼ -32.00%
- Reading proficiency
- 47% ▼ -28.00%
- Median HH income
- $51,326
- Composite
- 37.5/100
- National rank
- #4402
- State rank
- #17 of 98 in LA
Livability — Bossier City
- Score
- 71/100
- State rank
- #47
- US rank
- #7044
Category grades
Schools grade is shown separately in the Schools card above.
Census & demographics
- County
- Bossier Parish · 98,704 people
- City population
- 91,925
- Metro
- Shreveport-Bossier City, LA
- Population (ZIP)
- 43,925
- Household income
- $65,292
- Rent vs Own
- Severe rent burden
- 1942.0
Population outlook (Bossier County) Hauer SSP2
- Today (2025)
- 143,247 people
- By 2030
- 151,802 · +6.0%
- By 2040
- 168,194 · +17.4%
- By 2050
- 183,533 · +28.1%
- By 2075
- 217,009 · +51.5%
- By 2100
- 230,091 · +60.6%
Race, ethnicity, and origin ACS 2023
- Neighborhood character
- Diverse neighborhood (Simpson 0.60)
- Race & ethnicity
- White 56% Black 29% Hispanic / Latino 9% Two or more races 8% Asian 3%
- Hispanic origin (detail)
- Mexican 5%
- Common ancestry
- Lithuanian 2% Iranian 1% Slovak 1%
- Foreign-born
- 5% · Canada, Vietnam
- Languages at home
- 90% English-only · Spanish 7% Vietnamese 1% French/Haitian/Cajun 1%
Political lean MEDSL · Bossier
- 2024 margin
- Solid R (+43.3) · D 27.7% · R 71.0% · Other 1.3%
- 2008→2024 swing
- +0.3pp no change · 2008: -43.7pp · 2024: -43.3pp
- All cycles
- 2024: R+43.3 2020: R+41.0 2016: R+45.8 2012: R+45.4 2008: R+43.7
Not yet ingested
- Civics
- —
Market trends
- HPI YoY
- ▼ -79.78%
- Current HPI
- 149.4336
- Rent YoY
- ▲ 6.56%
- Metro
- Shreveport-Bossier City, LA
- State GDP YoY
- ▲ 3.29%
- F500 in state
- 10
Industry mix (Fortune 500 HQ in LA)
| Industry | F500 HQs | Revenue |
|---|---|---|
| Telecommunications | 2 | $23B |
|
||
| Utilities | 1 | $12B |
|
||
| Wholesale / Distribution | 1 | $5B |
|
||
| Advertising | 1 | $2B |
|
||
Price history
+36.4% since first listed3 events — show timeline
- 2026-06-17 Pending — NTREIS
- 2026-05-05 Listed $225,000 NTREIS
- 2018-01-26 Sold (Public Records) $164,999 Public Records
Property tax history
+102.0%/yrLatest (2025): $1,118 · -1.0% YoY. Source: county tax records.
Cash-flow waterfall
monthlySold comps — $/sqft
last 12 mo · ≤1 miLoading sold comps…