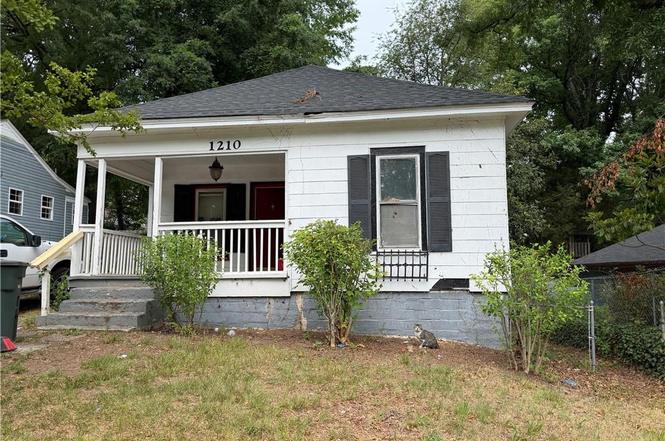
1210 Portland St · Greensboro, NC
Flood risk 1/10 · Minimal
- FEMA flood zone
- X (unshaded)
- Chance of flooding over 30 yrs
- 0.0%
- Est. flood insurance / yr
- $507 – $1,088
Fire risk 1/10 · Minimal
- Est. fire insurance / yr
- $906 – $1,684
Heat risk 5/10 · Moderate
- Hot days now (above 103°F)
- 7 days/yr
- Hot days in 30 yrs
- 16 days/yr
Wind risk 4/10 · Minor
- Chance of severe wind over 30 yrs
- 15.0%
Air-quality risk 2/10 · Minimal
- Unhealthy air days now
- 1 days/yr
- Unhealthy air days in 30 yrs
- 2 days/yr
Risk factors via First Street. Map © Google.
Why this score? — see what drove the B- grade
The composite is a weighted blend of 9 inputs, each scored 0–100. Each bar is that input's sub-score; the figure is the points it added to the 100-point composite (weight × sub-score).
- Cash flow +24.2/30.0
- ARV discount +15.0/15.0
- DSCR +7.8/10.0
- 1% rule +5.4/10.0
- Livability +4.0/5.0
- Schools +3.6/10.0
- Rent growth +3.2/5.0
- Condition / age +2.5/5.0
- Appreciation +0.0/10.0
$120,000
🖨 Deal sheet 📄 Offer letter ✓ Due diligence
Listing remarks
Location, Location along with A great opportunity to invest in and add to your portfolio! 4 bedroom/2bath near UNCG. Does need work. Roof 2021.
Key facts
- 6,534 sq ft lot
- Built 1915
- Listed 2 days
Property features AI
Finance
- HOA & community: No homeowners association
Exterior
- Parking: Driveway
- Utilities: Public water; Public sewer; Water heater: unknown
- Home design: Single-story house; Stick/site-built residential property; Built in 1915; Existing structure
- Construction: Vinyl siding
- Exterior features: City lot; Public road maintenance
Interior
- Bathrooms: One full bathroom
- Heating & cooling: Central air conditioning; Baseboard and forced air heating; Heated by electricity and natural gas
- Interior features: Primary bedroom on the main level
Neighborhood map
What this means for you Summary
Snapshot
- This is a 2-bed/1.0-bath single-family listed at $120k.
Deal economics
- At list price, monthly cash flow is $239 ($3k/yr) — positive.
- The deal already cash-flows at list — no discount required.
- Meets the 1% rule at list price ($1k rent vs $120k).
- Cap rate 8.7% vs local median 3.8% in Greensboro — top-decile yield for the area; either an underpriced asset or a hidden risk that comps aren't pricing in. Stress-test before assuming the spread holds.
Location & tenants
- Location reads 81/100 on livability (#12 in NC, #1,335 nationally) — a professional / high-income tenant draw. Strengths: amenities A+, commute A+, cost of living A+; Watch: employment D, crime F.
- Guilford County Schools (urban): math 39% / reading 45% proficiency, ranked #99 of 178 in NC (top 56%) — families likely to look elsewhere, expect single-tenant / working-renter base with shorter leases.
- Market conditions: Rents rising (+2.8%/yr); 67 active listings in the ZIP; 32 comparable units currently listed for rent nearby; rentals at typical pace (median 21d on market — plan ~3-4 weeks tenant-placement turnaround); 3,843 units permitted in Guilford County in 2024 (2,397 in 5+ unit buildings).
Forward outlook
- Local home prices are declining (-3.0%/yr); year-one equity from $830 of loan paydown is wiped out by about $4k of value loss. Plan a longer hold.
- Guilford County population projected at +26% by 2050 — long-run rental-demand tailwind backs the buy-and-hold thesis.
Negotiation context
- Only 2 days on market — expect competitive offers; lowballing is unlikely to land.
- Current owner paid $25k; list at $120k implies a 380% gain — meaningful room to come down on a strong offer.
Risks & watch-outs
- Watch-outs: built in 1915 — expect roof / HVAC / electrical / plumbing capex.
- Climate carrying-cost: extreme-heat days projected 7→16/yr by 2055 (HVAC capex compounding) — expect insurance premiums to compound above CPI over the hold.
Questions for the listing agent
- Built in 1915 — when were the roof, HVAC, electrical panel, plumbing, and water heater last replaced?
- Is there a deadline driving the sale (1031 exchange, divorce, estate, relocation)? That informs how much negotiation room exists.
- Crime grade is F in this area — have there been break-ins, vandalism, or insurance claims at this property in the last 3 years? What carrier currently insures it and at what premium?
- What's the average days-on-market for RENTAL listings here right now (not sales)? A rising rental-DOM trend means longer vacancies and softer asking-rent achievability than the comps imply.
- What's the recent tenant-quality profile in this submarket — average credit score on applications, eviction rate, late-payment / NSF rate, and stable-employment percentage? A property-management company in the area should have these aggregated.
- How much new for-sale + rental construction is in the pipeline within 1–3 miles? Heavy new supply typically softens prices + rents 12–24 months out; constrained supply supports both.
Investment metrics
- 1% rule
- 1.04% ✓
- Cap rate
- 8.69%
- Cash-on-cash
- 8.55%
- DSCR
- 1.38
- GRM
- 8.0
CMA / ARV
- ARV (on-the-fly)
- $159,324
- Comps found
- 12
Show comp detail 12 sales within ~0.75 mi
| Address | Dist | Beds/Ba | Sqft | Sold | Price | $/sf | Match |
|---|---|---|---|---|---|---|---|
| 1014 Lexington Ave | 0.32mi | 2/1.0 | 857 (+1%) | 10mo | $135,000 | $158 | 76 |
| 1012 Neal St | 0.19mi | 2/1.0 | 790 (-7%) | 8mo | $169,900 | $215 | 72 |
| 1517 Lovett St | 0.23mi | 2/1.0 | 878 (+3%) | 15mo | $92,000 | $105 | 72 |
| 1014 Mccormick St | 0.22mi | 2/1.0 | 809 (-5%) | 12mo | $150,000 | $185 | 71 |
| 1508 Lovett St | 0.20mi | 3/1.0 (+1) | 816 (-4%) | 9mo | $120,000 | $147 | 71 |
| 1613 Trogdon St | 0.23mi | 2/1.0 | 907 (+6%) | 10mo | $160,000 | $176 | 70 |
| 1114 Mccormick St | 0.15mi | 2/1.0 | 757 (-11%) | 9mo | $155,000 | $205 | 67 |
| 1708 Hertford St | 0.29mi | 2/1.0 | 947 (+11%) | 13mo | $181,900 | $192 | 57 |
| 1705 Boyden St | 0.37mi | 3/1.0 (+1) | 912 (+7%) | 12mo | $175,000 | $192 | 56 |
| 902 Hall St | 0.53mi | 3/1.0 (+1) | 912 (+7%) | 11mo | $190,000 | $208 | 50 |
| 2101 Maywood St | 0.67mi | 2/1.0 | 798 (-6%) | 11mo | $149,000 | $187 | 49 |
| 2212 Coliseum Blvd | 0.68mi | 3/2.0 (+1) | 944 (+11%) | 7mo | $111,000 | $118 | 35 |
Match score weights: distance 35% · size 25% · config 20% · recency 20%. Top-matched comps best support the ARV.
Projected returns pro-forma
-3.0% appreciation · 2.75% rent growth · sell at horizon
- IRR
- -3.6%
- Equity multiple
- 0.86×
- Total profit
- $-4,541
- Equity at exit
- $17,892
- IRR
- 5.8%
- Equity multiple
- 1.42×
- Total profit
- $14,269
- Equity at exit
- $10,375
Cash invested: $33,600 (down + closing). Projections, not guarantees.
Landlord ↔ Tenant lean methodology
- Overall (STATE)
- 85 Strongly Landlord-Friendly
- State North Carolina
- 85 Strongly Landlord-Friendly · R+3
- County
- — inherits STATE
- City
- — inherits STATE
ZIP-level market 27403
- Rents YoY
- 2.8%
- Active inventory
- 67
- Price-to-rent
- 8.0×
Monthly cashflow live
- Estimated rent
- $1,243 high interval (Pro) →
- Mortgage (P&I)
- −$629
- Tax from tax record
- −$63 /mo · $754/yr
- Insurance
- −$50
- HOA
- −$0
- Vacancy / Maint / Mgmt
- −$261
- Net cashflow
- $239
Break-even live
UW: 25.0% down · 7.5% · 30yr · 1.5% tax · 5.0% vac · 8.0% maint · 8.0% mgmt
Financing live
Cash to close
- Down payment
- $30,000
- Closing costs
- $3,600
- Reserves months
- —
- Total cash needed
- —
Loan-product check · same deal, 3 products live
Conventional
25% down · 7.5% · 30yr
- Down + closing
- —
- Monthly P&I
- —
- Monthly cashflow
- —
- DSCR
- —
- Eligible?
- —
Personal DTI + credit; lowest rate.
DSCR
20% down · 8.5% · 30yr
- Down + closing
- —
- Monthly P&I
- —
- Monthly cashflow
- —
- DSCR
- —
- Eligible?
- —
No personal income docs; deal must DSCR.
Hard money
10% down · 12.0% · 12mo
- Down + closing
- —
- Monthly P&I
- —
- Monthly cashflow
- —
- DSCR
- —
- Eligible?
- —
Short-term bridge; refi at stabilization.
Rent comps 32 comps
| Address | Beds | Baths | Sqft | Rent | $/sqft | DOM | Units | Dist |
|---|---|---|---|---|---|---|---|---|
| 1401 Oak St Greensboro, NC | 2.0 | 1.0 | 690 | $1,300 | $1.88 | 23d | 1 | 0.04mi |
| 920 Highland Ave Greensboro, NC | 2.0 | 2.0 | 890 | $1,235 | $1.39 | 14d | 1 | 0.43mi |
| 826 W Terrell St Greensboro, NC | 3.0 | 1.0 | 1084 | $1,750 | $1.61 | 23d | 1 | 0.55mi |
| 1636 Willomore St Greensboro, NC | 2.0 | 1.0 | 1070 | $1,330 | $1.24 | 14d | 1 | 0.57mi |
| 2023 Maywood St Unit A Greensboro, NC | 2.0 | 1.0 | 800 | $1,250 | $1.56 | 23d | 1 | 0.64mi |
| 815 Dana Pl Unit C Greensboro, NC | 2.0 | 1.0 | 780 | $1,100 | $1.41 | 23d | 1 | 0.67mi |
| 811 Dana Pl Greensboro, NC | 3.0 | 1.0 | 950 | $1,250 | $1.32 | 23d | 1 | 0.67mi |
| 1620 Spring Garden St Greensboro, NC | 2.0 | 1.0 | 1080 | $1,300 | $1.20 | 23d | 1 | 0.70mi |
| 1630 Spring Garden St Unit 1630-C Greensboro, NC | 2.0 | 1.5 | 1080 | $1,300 | $1.20 | 23d | 1 | 0.70mi |
| 2212 Coliseum Blvd Greensboro, NC | 3.0 | 2.0 | 1044 | $1,750 | $1.68 | 14d | 1 | 0.71mi |
| 2202 Maywood St Greensboro, NC | 3.0 | 1.0 | 960 | $1,250 | $1.30 | 14d | 1 | 0.77mi |
| 1827 Willomore St Greensboro, NC | 2.0 | 1.0 | 850 | $925 | $1.09 | 23d | 1 | 0.81mi |
| 1808 Willomore St Greensboro, NC | 2.0 | 1.0 | 850 | $950 | $1.12 | 23d | 2 | 0.82mi |
| 1820 McCormick St Unit H Greensboro, NC | 2.0 | 1.0 | 850 | $925 | $1.09 | 14d | 1 | 0.83mi |
| 1915 Spring Garden St Greensboro, NC | 2.0–3.0 | 2.0–3.0 | 786 | $695 | $0.88 | 14d | 32 | 0.84mi |
| 803 Holliday Dr Greensboro, NC | 2.0 | 2.0 | 1300 | $1,680 | $1.29 | 14d | 18 | 0.90mi |
| 2003 Spring Garden St Greensboro, NC | 1.0 | 1.0 | 600 | $995 | $1.66 | 23d | 1 | 0.90mi |
| 500 Savannah St Greensboro, NC | 2.0 | 1.0–1.5 | 769 | $1,295 | $1.68 | 19d | 8 | 0.92mi |
| 1813 Walker Ave Apt D Greensboro, NC | 2.0 | 1.0 | 775 | $950 | $1.23 | 23d | 1 | 0.98mi |
| 1710 Walker Ave Unit A Greensboro, NC | 2.0 | 1.0 | 900 | $1,150 | $1.28 | 23d | 1 | 0.99mi |
| 317 Craig St Greensboro, NC | 2.0 | 1.0 | 1027 | $1,275 | $1.24 | 14d | 1 | 1.02mi |
| 1911 Walker Ave Unit D Greensboro, NC | 2.0 | 2.0 | 865 | $1,249 | $1.44 | 23d | 1 | 1.03mi |
| 516 S Mendenhall St Unit 512-G Greensboro, NC | 2.0 | 1.0 | 812 | $1,299 | $1.60 | 14d | 1 | 1.03mi |
| 1915 Walker Ave Greensboro, NC | 2.0 | 1.0 | 1095 | $1,049 | $0.96 | 23d | 1 | 1.05mi |
| 720 S Elam Ave Greensboro, NC | 2.0 | 1.0 | 642 | $1,100 | $1.71 | 14d | 1 | 1.12mi |
| 720 S Elam Ave Greensboro, NC | 2.0 | 1.0 | 642 | $1,100 | $1.71 | 19d | 1 | 1.12mi |
| 2003 Urban Dr Greensboro, NC | 3.0 | 1.5 | 1107 | $1,495 | $1.35 | 21d | 1 | 1.17mi |
| 906 Howard St Apt E Greensboro, NC | 3.0 | 2.0 | 1080 | $1,299 | $1.20 | 21d | 1 | 1.27mi |
| 801 W McGee St #25 Greensboro, NC | 2.0 | 2.0 | 960 | $1,550 | $1.61 | 21d | 1 | 1.28mi |
| 2529 Spring Garden St Unit A1 Greensboro, NC | 1.0 | 1.0 | 600 | $950 | $1.58 | 23d | 1 | 1.36mi |
| 800 Arlington St Unit A Greensboro, NC | 2.0 | 1.0 | 650 | $1,250 | $1.92 | 14d | 1 | 1.41mi |
| 2904 W Florida St Greensboro, NC | 1.0–2.0 | 1.0–1.5 | 746 | $1,095 | $1.47 | 21d | 3 | 1.45mi |
Listing history 3 events
-
2026-06-18days on market $120,000 Active 2 DOM
-
2026-06-16remarks 144-char remark
-
2026-06-16$120,000 Active 1 DOM
ⓘ Source: listings_history table (triggers on properties + properties_extension) + one-shot
backfill from property_details.listing_events for pre-trigger history.
Tax reassessment forecast NC · Resets to sale price
- Current annual tax
- $754 · $63/mo
- Projected year-2 tax
- $984 · $82/mo
- Expected delta
- +$230/yr (+$19/mo · 30.5%)
ⓘ Screening estimate from a state-policy table — verify with the county assessor before closing.
Climate risk First Street
- Flood 1/10 Low FEMA zone X (unshaded) · 0% chance over 30 yrs
- Wildfire 1/10 Low
- Heat 5/10 Major 7 d/yr ≥103°F today · 16 d/yr by 30 yrs out
- Wind 4/10 Moderate 15% chance of damaging wind over 30 yrs
- Air quality 2/10 Low 1 unhealthy d/yr today · 2 by 30 yrs out
Nearby sold comps map
Loading sold comps map…
Walkable amenities ~0.75 mi
Loading nearby amenities…
Taxation est. · year 1
- Rental income
- $14,910
- − Mortgage interest
- −$6,722
- − Property taxes
- −$754
- − Insurance
- −$600
- − Repairs & maintenance
- −$1,193
- − Management
- −$1,193
- − Depreciation
- −$3,491
- Taxable income
- $958
- Est. tax owed @ 24.0%
- −$230
- After-tax cash flow
- $2,644/yr
For passive investors: Depreciation is non-cash, so a rental often shows a tax loss while cash-flowing — sheltering income. Rental losses are passive: they offset passive income freely, and up to $25,000/yr can offset ordinary (W-2) income if you actively participate and your MAGI is under $100k (phasing out to $0 by $150k); unused losses carry forward. On sale, claimed depreciation is recaptured at up to 25%, and gains may owe capital-gains tax (a 1031 exchange can defer both). Figures are a year-1 estimate at your 24.0% rate — not tax advice; consult a CPA.
Schools (NCES district)
- District
- Guilford County Schools
- NCES district ID
- 3701920
- Math proficiency
- 39% ▲ 1.00%
- Reading proficiency
- 45% ▲ 1.00%
- Median HH income
- $46,315
- Composite
- 35.78/100
- National rank
- #4842
- State rank
- #99 of 178 in NC
Livability — Greensboro
- Score
- 81/100
- State rank
- #12
- US rank
- #1335
Category grades
Schools grade is shown separately in the Schools card above.
Census & demographics
- Census place
- Greensboro, NC
- County
- Guilford County · 487,190 people
- City population
- 329,421
- Metro
- Greensboro-High Point, NC
- Population (ZIP)
- 22,557
- Household income
- $57,917
- Rent vs Own
- Severe rent burden
- 1047.0
Population outlook (Guilford County) Hauer SSP2
- Today (2025)
- 584,596 people
- By 2030
- 616,851 · +5.5%
- By 2040
- 678,451 · +16.1%
- By 2050
- 734,788 · +25.7%
- By 2075
- 862,985 · +47.6%
- By 2100
- 948,704 · +62.3%
Race, ethnicity, and origin ACS 2023
- Neighborhood character
- Diverse neighborhood (Simpson 0.65)
- Race & ethnicity
- White 52% Black 25% Hispanic / Latino 14% Two or more races 10% Asian 5%
- Hispanic origin (detail)
- Mexican 5% Puerto Rican 3%
- Common ancestry
- Slovak 2% Serbian 2% Lithuanian 2%
- Foreign-born
- 10% · Canada, Vietnam, Jamaica
- Languages at home
- 86% English-only · Spanish 8% Other Indo-European 2% Other Asian/Pacific 1%
Political lean MEDSL · Guilford
- 2024 margin
- Strong D (+21.8) · D 60.2% · R 38.4% · Other 1.4%
- 2008→2024 swing
- +3.5pp toward D · 2008: 18.4pp · 2024: 21.8pp
- All cycles
- 2024: D+21.8 2020: D+23.1 2016: D+20.0 2012: D+16.5 2008: D+18.4
Not yet ingested
- Civics
- —
Market trends
- HPI YoY
- ▼ -215.63%
- Current HPI
- 222.3145
- Rent YoY
- ▲ 2.75%
- Metro
- Greensboro-High Point, NC
- State GDP YoY
- ▲ 3.28%
- F500 in state
- 26
Industry mix (Fortune 500 HQ in NC)
| Industry | F500 HQs | Revenue |
|---|---|---|
| Financial Services | 2 | $213B |
|
||
| Retail | 2 | $95B |
|
||
| Industrial Conglomerate | 1 | $38B |
|
||
| Metals / Steel | 1 | $35B |
|
||
| Utilities | 1 | $30B |
|
||
| Industrial Machinery | 1 | $19B |
|
||
Price history
+380.0% since first listed2 events — show timeline
- 2026-06-16 Listed $120,000 Triad MLS
- 1995-05-01 Sold (Public Records) $25,000 Public Records
Property tax history
+4.0%/yrLatest (2025): $754 · -1.0% YoY. Source: county tax records.
Cash-flow waterfall
monthlySold comps — $/sqft
last 12 mo · ≤1 miLoading sold comps…