4228 43rd Ave N · Birmingham, AL
Flood risk 1/10 · Minimal
- FEMA flood zone
- X (unshaded)
- Chance of flooding over 30 yrs
- 0.0%
- Est. flood insurance / yr
- $507 – $1,088
Fire risk 2/10 · Minimal
- Est. fire insurance / yr
- $916 – $1,700
Heat risk 6/10 · Moderate
- Hot days now (above 106°F)
- 7 days/yr
- Hot days in 30 yrs
- 19 days/yr
Wind risk 6/10 · Moderate
- Chance of severe wind over 30 yrs
- 27.0%
Air-quality risk 5/10 · Moderate
- Unhealthy air days now
- 9 days/yr
- Unhealthy air days in 30 yrs
- 10 days/yr
Risk factors via First Street. Map © Google.
Why this score? — see what drove the B- grade
The composite is a weighted blend of 9 inputs, each scored 0–100. Each bar is that input's sub-score; the figure is the points it added to the 100-point composite (weight × sub-score).
- Cash flow +30.0/30.0
- 1% rule +10.0/10.0
- DSCR +10.0/10.0
- ARV discount +5.7/15.0
- Rent growth +3.4/5.0
- Livability +3.4/5.0
- Condition / age +2.5/5.0
- Schools +0.9/10.0
- Appreciation +0.0/10.0
$64,900
🖨 Deal sheet 📄 Offer letter ✓ Due diligence
Listing remarks
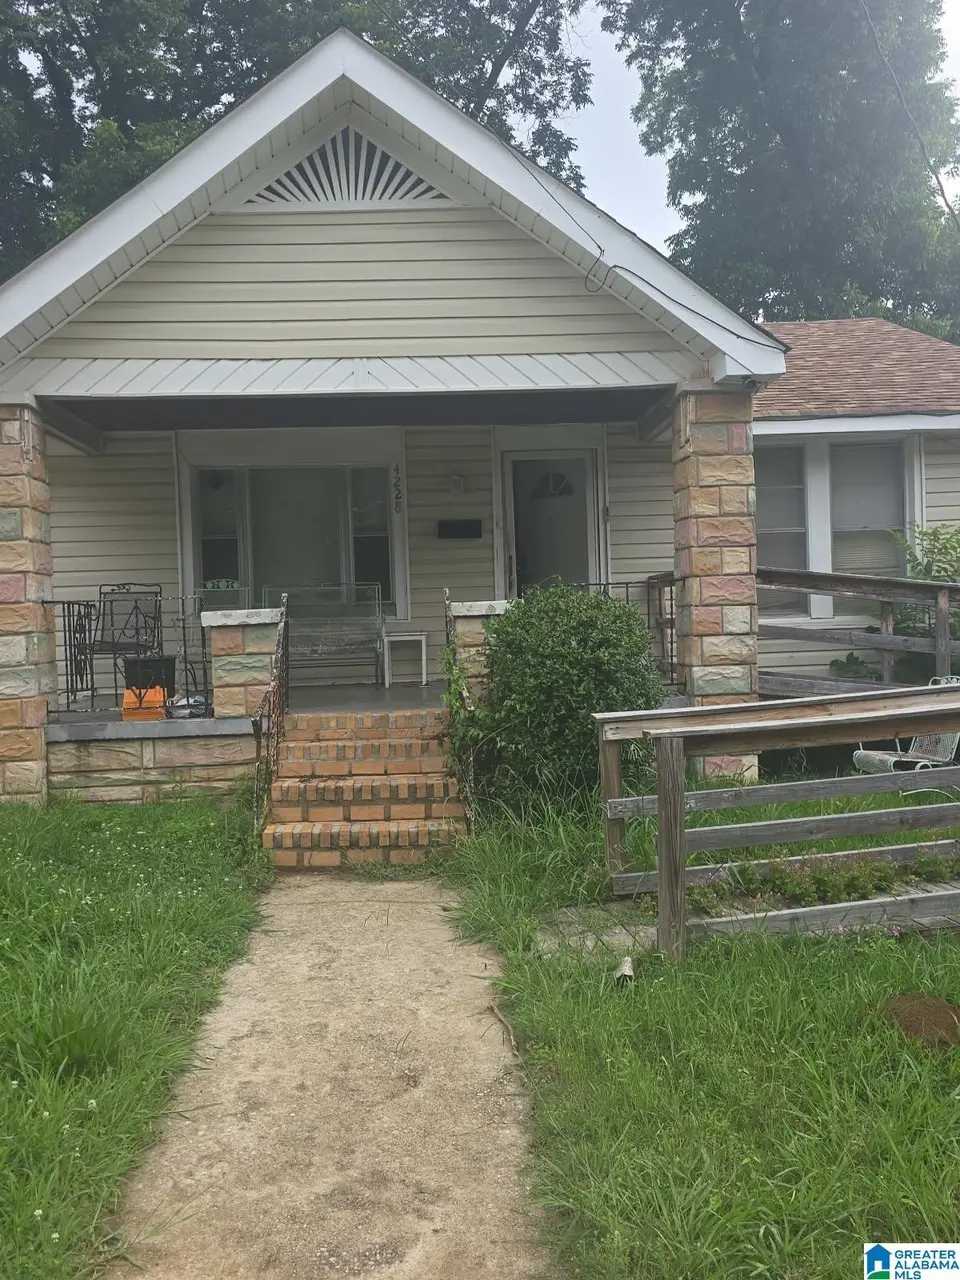
Attention investors and DIY enthusiasts! Multiple exit strategies: finish this remodel then either flip, rent or move in! Home being sold as is. Cash preferred but will consider financed all offers. Seller is assisted by an Attorney in Fact. Do not knock on door or approach house without prior communication.
Key facts
- 7,492 sq ft lot
- Built 1945
- Listed 9 days
Property features AI
Finance
- Other: Lot size about 0.172 acres; Located in the Mountain Park subdivision
- Financial info: No financial details provided
- HOA & community: No HOA/community details provided
Exterior
- Parking: Off-street parking
- Security: No security details provided
- Utilities: Public water; Internet availability unknown
- Home design: Existing property; Siding (other) construction
- Construction: Slab foundation; Siding (other) exterior material
- Exterior features: No waterfront; No pool; No patio; No garden/patio; No decks
Interior
- Kitchen: Kitchen on main level
- Bedrooms: Master bedroom (main level); Additional bedroom (main level)
- Flooring: Tile flooring
- Bathrooms: 2 full bathrooms; Tub/shower combination
- Heating & cooling: No heat; Central cooling
- Interior features: Tile flooring; Ceilings: Other (see remarks); No additional interior features listed
- Laundry & utility: No laundry/utility details provided
Neighborhood map
What this means for you Summary
Snapshot
- This is a 3-bed/2.0-bath single-family listed at $65k.
Deal economics
- At list price, monthly cash flow is $439 ($5k/yr) — positive.
- The deal already cash-flows at list — no discount required.
- Meets the 1% rule at list price ($1k rent vs $65k).
- Cap rate 14.4% vs local median 6.2% in Birmingham — top-decile yield for the area; either an underpriced asset or a hidden risk that comps aren't pricing in. Stress-test before assuming the spread holds.
Location & tenants
- Location reads 67/100 on livability (#78 in AL) — a middle-class / working-renter tenant base. Strengths: commute A+, cost of living A+, housing A+; Watch: amenities C-, crime F, employment F.
- Birmingham City (urban): math 4% / reading 20% proficiency, ranked #116 of 129 in AL (top 90%) — low school quality limits family demand, transient renter base, plan for 1-2y turnover; 82% free/reduced lunch — lower-income household profile, screen leases tightly.
- Zoned schools: Inglenook School (math 2% / reading 8%, grade F, #618 of 627 statewide, top 100%, 333 students, 91% FRL).
- Market conditions: Rents rising (+3.6%/yr); 94 active listings in the ZIP; 40 comparable units currently listed for rent nearby; rentals lingering (median 44d on market — plan ~5-8 weeks vacancy on turnover, expect pricing pressure); 55% of comp listings sitting > 30 days — soft ceiling on asking rent; lower-income renter base — watch delinquency; 2,114 units permitted in Jefferson County in 2024 (556 in 5+ unit buildings).
- This rent runs 34% of the median local income ($40k/yr) — at the standard rent-burdened threshold; future hikes will face affordability resistance.
Forward outlook
- Local home prices are declining (-3.0%/yr); year-one equity from $449 of loan paydown is wiped out by about $2k of value loss. Plan a longer hold.
- Jefferson County population projected to shrink 4% by 2050 — rents likely to lag national; underwrite the cash flow, not the appreciation.
- At projected returns (-3.0% appreciation + 3.6% rent growth), your $18k cash investment doubles in ~5 years — after that, you're playing with house money.
Negotiation context
- Only 9 days on market — expect competitive offers; lowballing is unlikely to land.
- Current owner paid $46k; 42% above their basis — modest negotiation headroom, anchor on the comps not their cost.
Risks & watch-outs
- Watch-outs: built in 1945 — expect roof / HVAC / electrical / plumbing capex.
- Climate carrying-cost: major wind risk, 27% chance of damaging wind over 30y; extreme-heat days projected 7→19/yr by 2055 (HVAC capex compounding) — expect insurance premiums to compound above CPI over the hold.
Questions for the listing agent
- Built in 1945 — when were the roof, HVAC, electrical panel, plumbing, and water heater last replaced?
- Is there a deadline driving the sale (1031 exchange, divorce, estate, relocation)? That informs how much negotiation room exists.
- Schools are F-rated, which usually means shorter tenancies and higher turnover. Who's the typical renter profile here, and what's been the actual vacancy rate?
- Crime grade is F in this area — have there been break-ins, vandalism, or insurance claims at this property in the last 3 years? What carrier currently insures it and at what premium?
- What's the average days-on-market for RENTAL listings here right now (not sales)? A rising rental-DOM trend means longer vacancies and softer asking-rent achievability than the comps imply.
- What's the recent tenant-quality profile in this submarket — average credit score on applications, eviction rate, late-payment / NSF rate, and stable-employment percentage? A property-management company in the area should have these aggregated.
- How much new for-sale + rental construction is in the pipeline within 1–3 miles? Heavy new supply typically softens prices + rents 12–24 months out; constrained supply supports both.
Investment metrics
- 1% rule
- 1.78% ✓
- Cap rate
- 14.41%
- Cash-on-cash
- 29.00%
- DSCR
- 2.29
- GRM
- 4.7
CMA / ARV
- ARV (on-the-fly)
- $62,350
- Comps found
- 12
Show comp detail 12 sales within ~0.75 mi
| Address | Dist | Beds/Ba | Sqft | Sold | Price | $/sf | Match |
|---|---|---|---|---|---|---|---|
| 4100 41st Ave N | 0.22mi | 3/2.0 | 1,504 (+4%) | 8mo | $55,000 | $37 | 77 |
| 4104 41st Ave N | 0.21mi | 4/1.5 (+1) | 1,345 (-7%) | 1mo | $42,500 | $32 | 70 |
| 3920 39th Ave N | 0.48mi | 3/1.5 | 1,502 (+4%) | 9mo | $53,000 | $35 | 62 |
| 3940 40th Ave N | 0.38mi | 3/1.0 | 1,444 (-0%) | 19mo | $50,000 | $35 | 62 |
| 636 Jefferson Blvd | 0.60mi | 3/1.0 | 1,505 (+4%) | 0mo | $65,000 | $43 | 61 |
| 4240 49th Ave | 0.43mi | 3/2.0 | 1,358 (-6%) | 14mo | $149,000 | $110 | 57 |
| 4212 50th Ave N | 0.57mi | 3/2.0 | 1,517 (+5%) | 15mo | $101,000 | $67 | 53 |
| 1012 Birmingham St | 0.70mi | 3/2.0 | 1,572 (+8%) | 3mo | $26,000 | $17 | 51 |
| 4117 50th Ave N | 0.61mi | 3/1.0 | 1,492 (+3%) | 18mo | $74,500 | $50 | 48 |
| 4101 49th Ter N | 0.57mi | 3/1.0 | 1,547 (+7%) | 14mo | $67,000 | $43 | 47 |
| 4318 49th Ct N | 0.50mi | 3/2.0 | 1,266 (-13%) | 11mo | $95,800 | $76 | 47 |
| 4329 Pulaski St | 0.54mi | 3/2.0 | 1,240 (-14%) | 18mo | $96,400 | $78 | 36 |
Match score weights: distance 35% · size 25% · config 20% · recency 20%. Top-matched comps best support the ARV.
Projected returns pro-forma
-3.0% appreciation · 3.58% rent growth · sell at horizon
- IRR
- 24.1%
- Equity multiple
- 2.00×
- Total profit
- $18,162
- Equity at exit
- $9,677
- IRR
- 32.3%
- Equity multiple
- 4.01×
- Total profit
- $54,778
- Equity at exit
- $5,611
Cash invested: $18,172 (down + closing). Projections, not guarantees.
Landlord ↔ Tenant lean methodology
- Overall (STATE)
- 90 Strongly Landlord-Friendly
- State Alabama
- 90 Strongly Landlord-Friendly · R+15
- County
- — inherits STATE
- City
- — inherits STATE
ZIP-level market 35217
- Rents YoY
- 3.6%
- Active inventory
- 94
- Price-to-rent
- 4.7×
Monthly cashflow live
- Estimated rent
- $1,156 high interval (Pro) →
- Mortgage (P&I)
- −$340
- Tax from tax record
- −$107 /mo · $1,279/yr
- Insurance
- −$27
- HOA
- −$0
- Vacancy / Maint / Mgmt
- −$243
- Net cashflow
- $439
Break-even live
UW: 25.0% down · 7.5% · 30yr · 1.5% tax · 5.0% vac · 8.0% maint · 8.0% mgmt
Financing live
Cash to close
- Down payment
- $16,225
- Closing costs
- $1,947
- Reserves months
- —
- Total cash needed
- —
Loan-product check · same deal, 3 products live
Conventional
25% down · 7.5% · 30yr
- Down + closing
- —
- Monthly P&I
- —
- Monthly cashflow
- —
- DSCR
- —
- Eligible?
- —
Personal DTI + credit; lowest rate.
DSCR
20% down · 8.5% · 30yr
- Down + closing
- —
- Monthly P&I
- —
- Monthly cashflow
- —
- DSCR
- —
- Eligible?
- —
No personal income docs; deal must DSCR.
Hard money
10% down · 12.0% · 12mo
- Down + closing
- —
- Monthly P&I
- —
- Monthly cashflow
- —
- DSCR
- —
- Eligible?
- —
Short-term bridge; refi at stabilization.
Rent comps 40 comps
| Address | Beds | Baths | Sqft | Rent | $/sqft | DOM | Units | Dist |
|---|---|---|---|---|---|---|---|---|
| 4217 43rd Ave N Birmingham, AL | 3.0 | 1.0 | 1140 | $1,200 | $1.05 | 3d | 1 | 0.04mi |
| 4220 40th Ct N Birmingham, AL | 3.0 | 1.0 | 948 | $1,200 | $1.27 | 43d | 1 | 0.14mi |
| 4418 43rd St N Birmingham, AL | 3.0 | 1.0 | 1710 | $925 | $0.54 | 23d | 1 | 0.14mi |
| 4400 43rd St N Birmingham, AL | 3.0 | 1.0 | 1152 | $850 | $0.74 | 14d | 1 | 0.18mi |
| 4400 43rd St N Birmingham, AL | 3.0 | 1.0 | 1152 | $850 | $0.74 | 43d | 1 | 0.18mi |
| 4231 40th Ave N Birmingham, AL | 3.0 | 1.0 | 1272 | $850 | $0.67 | 19d | 1 | 0.22mi |
| 4236 39th Ave N Birmingham, AL | 3.0 | 2.0 | 1000 | $1,195 | $1.20 | 23d | 1 | 0.26mi |
| 4028 40th Ave N Birmingham, AL | 3.0 | 1.0 | 1186 | $950 | $0.80 | 43d | 1 | 0.31mi |
| 4301 Greenwood St Birmingham, AL | 3.0 | 1.0 | 1140 | $1,025 | $0.90 | 2d | 1 | 0.52mi |
| 3823 43rd Ave N Birmingham, AL | 3.0 | 2.0 | 1500 | $1,200 | $0.80 | 43d | 1 | 0.52mi |
| 3823 43rd Ave N Birmingham, AL | 3.0 | 2.0 | 1500 | $1,200 | $0.80 | 23d | 1 | 0.52mi |
| 4925 43rd Way N Birmingham, AL | 3.0 | 2.0 | 1232 | $1,461 | $1.19 | 1d | 1 | 0.53mi |
| 4329 Harmon St Birmingham, AL | 3.0 | 1.0 | 1227 | $950 | $0.77 | 3d | 1 | 0.56mi |
| 4329 Harmon St Birmingham, AL | 3.0 | 1.0 | 1227 | $950 | $0.77 | 43d | 1 | 0.56mi |
| 4329 Pulaski St Birmingham, AL | 3.0 | 2.0 | 1240 | $1,353 | $1.09 | 23d | 1 | 0.56mi |
| 4208 50th Ave N Birmingham, AL | 3.0 | 1.0 | 1104 | $1,200 | $1.09 | 43d | 1 | 0.60mi |
| 4212 50th Ave N Birmingham, AL | 4.0 | 2.0 | 1517 | $1,595 | $1.05 | 1d | 1 | 0.60mi |
| 4344 Pulaski St Birmingham, AL | 3.0 | 1.0 | 1268 | $1,050 | $0.83 | 43d | 1 | 0.60mi |
| 5015 42nd Pl N Birmingham, AL | 3.0 | 2.0 | 1500 | $1,200 | $0.80 | 43d | 1 | 0.62mi |
| 5025 43rd Pl N Birmingham, AL | 4.0 | 2.0 | 1017 | $1,300 | $1.28 | 43d | 1 | 0.64mi |
| 1316 Spring St Birmingham, AL | 2.0 | 1.0 | 920 | $1,195 | $1.30 | 3d | 1 | 0.66mi |
| 4316 Gadsden St Birmingham, AL | 2.0 | 1.0 | 1048 | $1,100 | $1.05 | 3d | 1 | 0.68mi |
| 619 Bell Ave Birmingham, AL | 3.0 | 1.0 | 1550 | $1,075 | $0.69 | 43d | 1 | 0.69mi |
| 1045 Waverly St Birmingham, AL | 3.0 | 1.0 | 1014 | $1,000 | $0.99 | 43d | 1 | 0.72mi |
| 1303 Main St Birmingham, AL | 4.0 | 2.0 | 1432 | $1,300 | $0.91 | 43d | 1 | 0.77mi |
| 732 Fulton Ave Birmingham, AL | 4.0 | 2.0 | 1320 | $1,450 | $1.10 | 43d | 1 | 0.78mi |
| 1076 Green St Birmingham, AL | 3.0 | 1.0 | 1172 | $1,050 | $0.90 | 16d | 1 | 0.84mi |
| 1237 Elm Ave Birmingham, AL | 2.0 | 1.5 | 1312 | $1,150 | $0.88 | 43d | 1 | 0.89mi |
| 1043 Jackson Blvd Birmingham, AL | 4.0 | 2.0 | 1300 | $1,095 | $0.84 | 14d | 1 | 0.93mi |
| 1249 Waverly St Birmingham, AL | 3.0 | 1.0 | 1260 | $1,000 | $0.79 | 43d | 1 | 0.97mi |
| 1434 Thomason Ave Birmingham, AL | 4.0 | 2.0 | 1644 | $1,100 | $0.67 | 43d | 1 | 0.99mi |
| 3708 42nd Ave N Birmingham, AL | 3.0 | 1.0 | 876 | $950 | $1.08 | 43d | 1 | 1.01mi |
| 1439 Sloan Ave Birmingham, AL | 3.0 | 1.0 | 936 | $900 | $0.96 | 43d | 1 | 1.04mi |
| 1120 Hall St Birmingham, AL | 2.0 | 1.0 | 887 | $775 | $0.87 | 43d | 1 | 1.06mi |
| 1116 Hall St Birmingham, AL | 2.0 | 1.0 | 887 | $775 | $0.87 | 43d | 1 | 1.08mi |
| 1401 Wharton Ave Birmingham, AL | 2.0 | 1.0 | 1104 | $950 | $0.86 | 19d | 1 | 1.11mi |
| 1108 Hall St Birmingham, AL | 2.0 | 1.0 | 1680 | $850 | $0.51 | 43d | 1 | 1.11mi |
| 1731 Mountain Dr Birmingham, AL | 3.0 | 1.0 | 1160 | $975 | $0.84 | 43d | 1 | 1.20mi |
| 1601 48th St N Birmingham, AL | 3.0 | 1.0 | 1313 | $1,200 | $0.91 | 23d | 1 | 1.24mi |
| 1304 46th St N Birmingham, AL | 3.0 | 1.0 | 1683 | $670 | $0.40 | 16d | 1 | 1.31mi |
Listing history 7 events
-
2026-06-15statusdays on market $64,900 Pending 9 DOM
-
2026-06-13pricedays on market $64,900 Active 8 DOM
-
2026-06-10days on market $69,900 Active 5 DOM
-
2026-06-09days on market $69,900 Active 4 DOM
-
2026-06-08days on market $69,900 Active 3 DOM
-
2026-06-07remarks 309-char remark
-
2026-06-07$69,900 Active 2 DOM
ⓘ Source: listings_history table (triggers on properties + properties_extension) + one-shot
backfill from property_details.listing_events for pre-trigger history.
Tax reassessment forecast AL · Resets to sale price
- Current annual tax
- $1,279 · $107/mo
- Projected year-2 tax
- $1,279 · $107/mo
- Expected delta
- $0/yr ($0/mo · 0.0%)
ⓘ Screening estimate from a state-policy table — verify with the county assessor before closing.
Climate risk First Street
- Flood 1/10 Low FEMA zone X (unshaded) · 0% chance over 30 yrs
- Wildfire 2/10 Low
- Heat 6/10 Major 7 d/yr ≥106°F today · 19 d/yr by 30 yrs out
- Wind 6/10 Major 27% chance of damaging wind over 30 yrs
- Air quality 5/10 Major 9 unhealthy d/yr today · 10 by 30 yrs out
Nearby sold comps map
Loading sold comps map…
Walkable amenities ~0.75 mi
Loading nearby amenities…
Taxation est. · year 1
- Rental income
- $13,869
- − Mortgage interest
- −$3,635
- − Property taxes
- −$1,279
- − Insurance
- −$324
- − Repairs & maintenance
- −$1,110
- − Management
- −$1,110
- − Depreciation
- −$1,888
- Taxable income
- $4,523
- Est. tax owed @ 24.0%
- −$1,086
- After-tax cash flow
- $4,184/yr
For passive investors: Depreciation is non-cash, so a rental often shows a tax loss while cash-flowing — sheltering income. Rental losses are passive: they offset passive income freely, and up to $25,000/yr can offset ordinary (W-2) income if you actively participate and your MAGI is under $100k (phasing out to $0 by $150k); unused losses carry forward. On sale, claimed depreciation is recaptured at up to 25%, and gains may owe capital-gains tax (a 1031 exchange can defer both). Figures are a year-1 estimate at your 24.0% rate — not tax advice; consult a CPA.
Schools (NCES district)
- District
- Birmingham City
- NCES district ID
- 0100390
- Math proficiency
- 4% ▼ -17.00%
- Reading proficiency
- 20% ▼ -4.00%
- Median HH income
- $31,988
- Composite
- 9.49/100
- National rank
- #9850
- State rank
- #116 of 129 in AL
Livability — Birmingham
- Score
- 67/100
- State rank
- #78
- US rank
- #10412
Category grades
Schools grade is shown separately in the Schools card above.
Census & demographics
- Census place
- Birmingham, AL
- County
- Jefferson County · 527,445 people
- City population
- 210,422
- Metro
- Birmingham-Hoover, AL
- Population (ZIP)
- 12,240
- Household income
- $40,486
- Rent vs Own
- Severe rent burden
- 594.0
Population outlook (Jefferson County) Hauer SSP2
- Today (2025)
- 669,185 people
- By 2030
- 669,694 · +0.1%
- By 2040
- 661,388 · -1.2%
- By 2050
- 643,086 · -3.9%
- By 2075
- 577,267 · -13.7%
- By 2100
- 474,758 · -29.1%
Race, ethnicity, and origin ACS 2023
- Neighborhood character
- Diverse neighborhood (Simpson 0.58)
- Race & ethnicity
- Black 57% White 27% Hispanic / Latino 14% Two or more races 6%
- Hispanic origin (detail)
- Mexican 9%
- Common ancestry
- Slovak 3% Italian 1%
- Foreign-born
- 7% · Canada, Guatemala
- Languages at home
- 86% English-only · Spanish 13%
Political lean MEDSL · Jefferson
- 2024 margin
- D (+10.4) · D 54.6% · R 44.2% · Other 1.2%
- 2008→2024 swing
- +5.4pp toward D · 2008: 5.1pp · 2024: 10.4pp
- All cycles
- 2024: D+10.4 2020: D+13.2 2016: D+7.2 2012: D+6.0 2008: D+5.1
Not yet ingested
- Civics
- —
Market trends
- HPI YoY
- ▼ -74.54%
- Current HPI
- 117.416
- Rent YoY
- ▲ 3.58%
- Metro
- Birmingham-Hoover, AL
- State GDP YoY
- ▲ 2.94%
- F500 in state
- 4
Industry mix (Fortune 500 HQ in AL)
| Industry | F500 HQs | Revenue |
|---|---|---|
| Financial Services | 1 | $8B |
|
||
| Healthcare | 1 | $5B |
|
||
Price history
+52.7% since first listed2 events — show timeline
- 2026-06-05 Listed $69,900 Greater Alabama MLS
- 2016-09-29 Sold (Public Records) $45,774 Public Records
Property tax history
+4.5%/yrLatest (2025): $1,279 · +0.0% YoY. Source: county tax records.
Cash-flow waterfall
monthlySold comps — $/sqft
last 12 mo · ≤1 miLoading sold comps…