280 E Wilkison St · Montezuma, IN
Flood risk 1/10 · Minimal
- FEMA flood zone
- X (unshaded)
- Chance of flooding over 30 yrs
- 0.0%
- Est. flood insurance / yr
- $507 – $1,088
Fire risk 1/10 · Minimal
- Est. fire insurance / yr
- $717 – $1,331
Heat risk 4/10 · Minor
- Hot days now (above 105°F)
- 7 days/yr
- Hot days in 30 yrs
- 19 days/yr
Wind risk 2/10 · Minimal
- Chance of severe wind over 30 yrs
- 1.0%
Air-quality risk 2/10 · Minimal
- Unhealthy air days now
- 1 days/yr
- Unhealthy air days in 30 yrs
- 2 days/yr
Risk factors via First Street. Map © Google.
Why this score? — see what drove the C- grade
The composite is a weighted blend of 9 inputs, each scored 0–100. Each bar is that input's sub-score; the figure is the points it added to the 100-point composite (weight × sub-score).
- Cash flow +18.8/30.0
- ARV discount +7.5/15.0
- DSCR +5.9/10.0
- Appreciation +5.5/10.0
- 1% rule +3.9/10.0
- Livability +3.2/5.0
- Schools +3.0/10.0
- Rent growth +2.5/5.0
- Condition / age +2.5/5.0
$139,000
🖨 Deal sheet 📄 Offer letter ✓ Due diligence
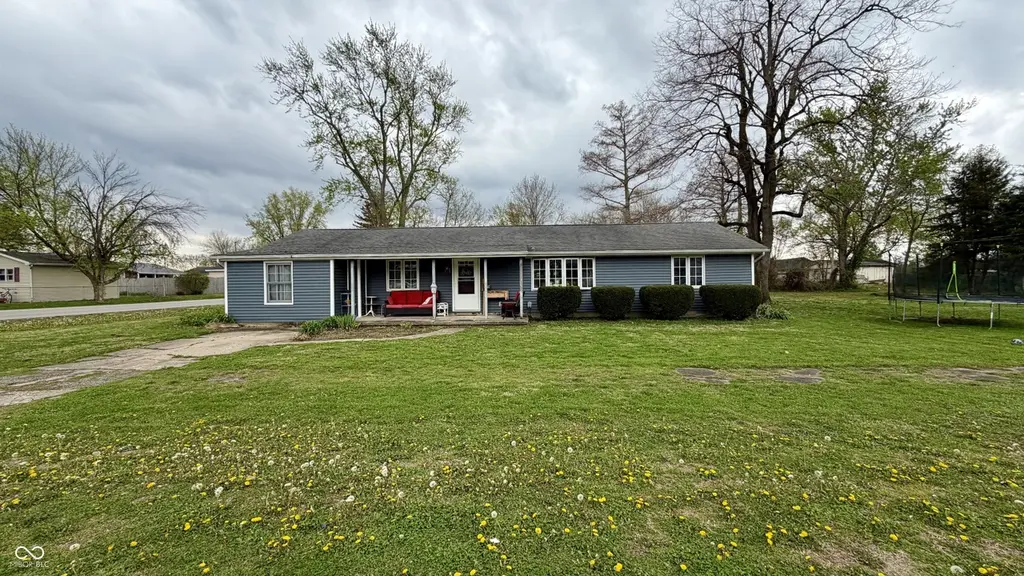
Listing remarks
Spacious three bedroom one and 1/2 bath home with a two car attached garage in Montezuma. As you walk up to this welcoming home, you were greeted with a lovely covered front porch; a perfect place for relaxation and taking in the neighborhood. The split floor plan provides additional privacy by having the primary suite on one side of the house and the two secondary bedrooms on the opposite side. In the full bath, you will find a large size walk-in shower and the good news is this home has a secondary half bath. The kitchen is spacious and with the attached formal dining room. You'll have lots of space to entertain. The house has been updated with new whole house wrap as well as new siding.
Key facts
- Covered front porch
- New siding
- Split floor plan
Tags
Neighborhood map
What this means for you Summary
Snapshot
- This is a 3-bed/1.5-bath single-family listed at $139k.
Deal economics
- At list price, monthly cash flow is $139 ($2k/yr) — positive.
- The deal already cash-flows at list — no discount required.
- To meet the 1% rule (rent ≥ 1% of price), the offer needs to be $123k (11.4% below list).
- Recommended offer: $123k (11.4% below list) — sets the bar for 1% rule.
Location & tenants
- Location reads 65/100 on livability (#314 in IN) — a middle-class / working-renter tenant base. Strengths: cost of living A+, housing A+, health & safety A; Watch: employment C-, crime D+, amenities F.
- Southwest Parke Community School Corporation (rural): math 34% / reading 36% proficiency, ranked #195 of 301 in IN (top 65%) — families likely to look elsewhere, expect single-tenant / working-renter base with shorter leases.
- Zoned schools: Montezuma Elementary School (math 47% / reading 37%, grade F, #434 of 994 statewide, top 48%, 232 students, 66% FRL); Riverton Parke Jr-Sr High School (math 23% / reading 39%, grade F, #303 of 369 statewide, top 82%, 472 students, 53% FRL).
- Market conditions: 10 active listings in the ZIP; 61 units permitted in Parke County in 2024 (0 in 5+ unit buildings).
Forward outlook
- In year one you build about $2k of equity ($961 loan paydown + $2k appreciation (1.1% local appreciation)).
- Parke County population projected at -10% by 2050 — secular population decline; favor cash flow + early exit over multi-decade hold.
- At projected returns (1.1% appreciation + 3.0% rent growth), your $39k cash investment doubles in ~8 years — after that, you're playing with house money.
Negotiation context
- Only 7 days on market — expect competitive offers; lowballing is unlikely to land.
- 3 sale attempts since 19y ago with the ask held roughly flat each time — persistent listings suggest the price (not the market) is what's stuck; bring a comps-based counter.
- Current owner paid $38k; list at $139k implies a 266% gain — meaningful room to come down on a strong offer.
Questions for the listing agent
- Built in 1979 — when were the roof, HVAC, electrical panel, plumbing, and water heater last replaced?
- Is there a deadline driving the sale (1031 exchange, divorce, estate, relocation)? That informs how much negotiation room exists.
- Schools are D-rated, which usually means shorter tenancies and higher turnover. Who's the typical renter profile here, and what's been the actual vacancy rate?
- Crime grade is D in this area — have there been break-ins, vandalism, or insurance claims at this property in the last 3 years? What carrier currently insures it and at what premium?
- What's the average days-on-market for RENTAL listings here right now (not sales)? A rising rental-DOM trend means longer vacancies and softer asking-rent achievability than the comps imply.
- What's the recent tenant-quality profile in this submarket — average credit score on applications, eviction rate, late-payment / NSF rate, and stable-employment percentage? A property-management company in the area should have these aggregated.
- How much new for-sale + rental construction is in the pipeline within 1–3 miles? Heavy new supply typically softens prices + rents 12–24 months out; constrained supply supports both.
Investment metrics
- 1% rule
- 0.89% ✗
- Cap rate
- 7.50%
- Cash-on-cash
- 4.30%
- DSCR
- 1.19
- GRM
- 9.4
CMA / ARV
- ARV (on-the-fly)
- $139,072
- Comps found
- 5
Show comp detail 5 sales within ~0.75 mi
| Address | Dist | Beds/Ba | Sqft | Sold | Price | $/sf | Match |
|---|---|---|---|---|---|---|---|
| 1479 N East Street St | 0.38mi | 3/1.5 | 1,680 (-1%) | 0mo | $145,000 | $86 | 80 |
| 230 E Poplar St | 0.45mi | 3/1.5 | 1,676 (-1%) | 5mo | $24,000 | $14 | 72 |
| 354 Bloomingdale Rd | 0.27mi | 2/1.0 (-1) | 1,458 (-14%) | 4mo | $120,000 | $82 | 54 |
| 41 E B St | 0.65mi | 3/2.5 | 1,836 (+8%) | 15mo | $150,000 | $82 | 40 |
| 1696 N Washington St | 0.53mi | 3/1.0 | 1,456 (-14%) | 22mo | $150,000 | $103 | 31 |
Match score weights: distance 35% · size 25% · config 20% · recency 20%. Top-matched comps best support the ARV.
Projected returns pro-forma
1.09% appreciation · 3.0% rent growth · sell at horizon
- IRR
- 6.1%
- Equity multiple
- 1.31×
- Total profit
- $12,058
- Equity at exit
- $48,129
- IRR
- 10.2%
- Equity multiple
- 2.25×
- Total profit
- $48,584
- Equity at exit
- $64,486
Cash invested: $38,920 (down + closing). Projections, not guarantees.
Landlord ↔ Tenant lean methodology
- Overall (STATE)
- 90 Strongly Landlord-Friendly
- State Indiana
- 90 Strongly Landlord-Friendly · R+11
- County
- — inherits STATE
- City
- — inherits STATE
ZIP-level market 47862
- Home prices YoY
- 0.5%
- Active inventory
- 10
- Price-to-rent
- 9.4×
Monthly cashflow live
- Estimated rent
- $1,231 medium interval (Pro) →
- Mortgage (P&I)
- −$729
- Tax from tax record
- −$46 /mo · $555/yr
- Insurance
- −$58
- HOA
- −$0
- Vacancy / Maint / Mgmt
- −$259
- Net cashflow
- $139
Break-even live
UW: 25.0% down · 7.5% · 30yr · 1.5% tax · 5.0% vac · 8.0% maint · 8.0% mgmt
Financing live
Cash to close
- Down payment
- $34,750
- Closing costs
- $4,170
- Reserves months
- —
- Total cash needed
- —
Loan-product check · same deal, 3 products live
Conventional
25% down · 7.5% · 30yr
- Down + closing
- —
- Monthly P&I
- —
- Monthly cashflow
- —
- DSCR
- —
- Eligible?
- —
Personal DTI + credit; lowest rate.
DSCR
20% down · 8.5% · 30yr
- Down + closing
- —
- Monthly P&I
- —
- Monthly cashflow
- —
- DSCR
- —
- Eligible?
- —
No personal income docs; deal must DSCR.
Hard money
10% down · 12.0% · 12mo
- Down + closing
- —
- Monthly P&I
- —
- Monthly cashflow
- —
- DSCR
- —
- Eligible?
- —
Short-term bridge; refi at stabilization.
Listing history 8 events
-
2026-04-17status Pending
-
2026-04-10$139,000 Active
-
2023-10-13status Pending
-
2023-09-26$112,500 Active
-
2011-04-13soldstatus $38,000
-
2010-10-21soldstatus $82,237
-
2009-11-09historical
-
2007-11-08$64,900
ⓘ Source: listings_history table (triggers on properties + properties_extension) + one-shot
backfill from property_details.listing_events for pre-trigger history.
Tax reassessment forecast IN · Partial reset (capped growth)
- Current annual tax
- $555 · $46/mo
- Projected year-2 tax
- $868 · $72/mo
- Expected delta
- +$313/yr (+$26/mo · 56.4%)
ⓘ Screening estimate from a state-policy table — verify with the county assessor before closing.
Climate risk First Street
- Flood 1/10 Low FEMA zone X (unshaded) · 0% chance over 30 yrs
- Wildfire 1/10 Low
- Heat 4/10 Moderate 7 d/yr ≥105°F today · 19 d/yr by 30 yrs out
- Wind 2/10 Low 100% chance of damaging wind over 30 yrs
- Air quality 2/10 Low 1 unhealthy d/yr today · 2 by 30 yrs out
Nearby sold comps map
Loading sold comps map…
Walkable amenities ~0.75 mi
Loading nearby amenities…
Taxation est. · year 1
- Rental income
- $14,773
- − Mortgage interest
- −$7,786
- − Property taxes
- −$555
- − Insurance
- −$695
- − Repairs & maintenance
- −$1,182
- − Management
- −$1,182
- − Depreciation
- −$4,044
- Taxable loss
- −$670
- Est. tax savings @ 24.0%
- +$161
- After-tax cash flow
- $1,834/yr
For passive investors: Depreciation is non-cash, so a rental often shows a tax loss while cash-flowing — sheltering income. Rental losses are passive: they offset passive income freely, and up to $25,000/yr can offset ordinary (W-2) income if you actively participate and your MAGI is under $100k (phasing out to $0 by $150k); unused losses carry forward. On sale, claimed depreciation is recaptured at up to 25%, and gains may owe capital-gains tax (a 1031 exchange can defer both). Figures are a year-1 estimate at your 24.0% rate — not tax advice; consult a CPA.
Schools (NCES district)
- District
- Southwest Parke Community School Corporation
- NCES district ID
- 1810900
- Math proficiency
- 34% ▼ -4.00%
- Reading proficiency
- 36% ▼ -6.00%
- Median HH income
- $42,288
- Composite
- 29.61/100
- National rank
- #6474
- State rank
- #195 of 301 in IN
Livability — Montezuma
- Score
- 65/100
- State rank
- #314
- US rank
- #12442
Category grades
Schools grade is shown separately in the Schools card above.
Census & demographics
- Census place
- Montezuma, IN
- Population (ZIP)
- 1,262
Population outlook (Parke County) Hauer SSP2
- Today (2025)
- 15,937 people
- By 2030
- 15,467 · -2.9%
- By 2040
- 14,793 · -7.2%
- By 2050
- 14,318 · -10.2%
- By 2075
- 13,484 · -15.4%
- By 2100
- 12,236 · -23.2%
Race, ethnicity, and origin ACS 2023
- Neighborhood character
- Predominantly White (87%)
- Race & ethnicity
- White 87% Two or more races 10% Hispanic / Latino 10% Black 2%
- Hispanic origin (detail)
- Mexican 10%
- Common ancestry
- Iranian 2% Slovak 2% Romanian 2%
- Foreign-born
- 2% · Canada, Jamaica
- Languages at home
- 95% English-only · Spanish 5%
Political lean MEDSL · Parke
- 2024 margin
- Solid R (+56.9) · D 20.6% · R 77.5% · Other 1.9%
- 2008→2024 swing
- -42.8pp toward R · 2008: -14.1pp · 2024: -56.9pp
- All cycles
- 2024: R+56.9 2020: R+55.5 2016: R+52.0 2012: R+32.6 2008: R+14.1
Not yet ingested
- Civics
- —
Market trends
- HPI YoY
- ▲ 1.09%
- Current HPI
- 212.829
- Rent YoY
- —
- Metro
- —
- State GDP YoY
- ▲ 2.90%
- F500 in state
- 18
Industry mix (Fortune 500 HQ in IN)
| Industry | F500 HQs | Revenue |
|---|---|---|
| Industrial Machinery | 2 | $37B |
|
||
| Healthcare | 1 | $177B |
|
||
| Pharmaceuticals | 1 | $45B |
|
||
| Metals / Steel | 1 | $18B |
|
||
| Agriculture | 1 | $17B |
|
||
| Packaging | 1 | $12B |
|
||
Price history
+114.2% since first listed8 events — show timeline
- 2026-04-17 Pending — MIBOR as Distributed by MLS Grid
- 2026-04-10 Listed $139,000 MIBOR as Distributed by MLS Grid
- 2023-10-13 Pending — THAAR
- 2023-09-26 Listed $112,500 THAAR
- 2011-04-13 Sold (Public Records) $38,000 Public Records
- 2010-10-21 Sold (Public Records) $82,237 Public Records
- 2009-11-09 Listing Removed — MIBOR as Distributed by MLS Grid
- 2007-11-08 Listed $64,900 MIBOR as Distributed by MLS Grid
Property tax history
+4.9%/yrLatest (2024): $555 · -8.7% YoY. Source: county tax records.
Cash-flow waterfall
monthlySold comps — $/sqft
last 12 mo · ≤1 miLoading sold comps…