 Multi-family
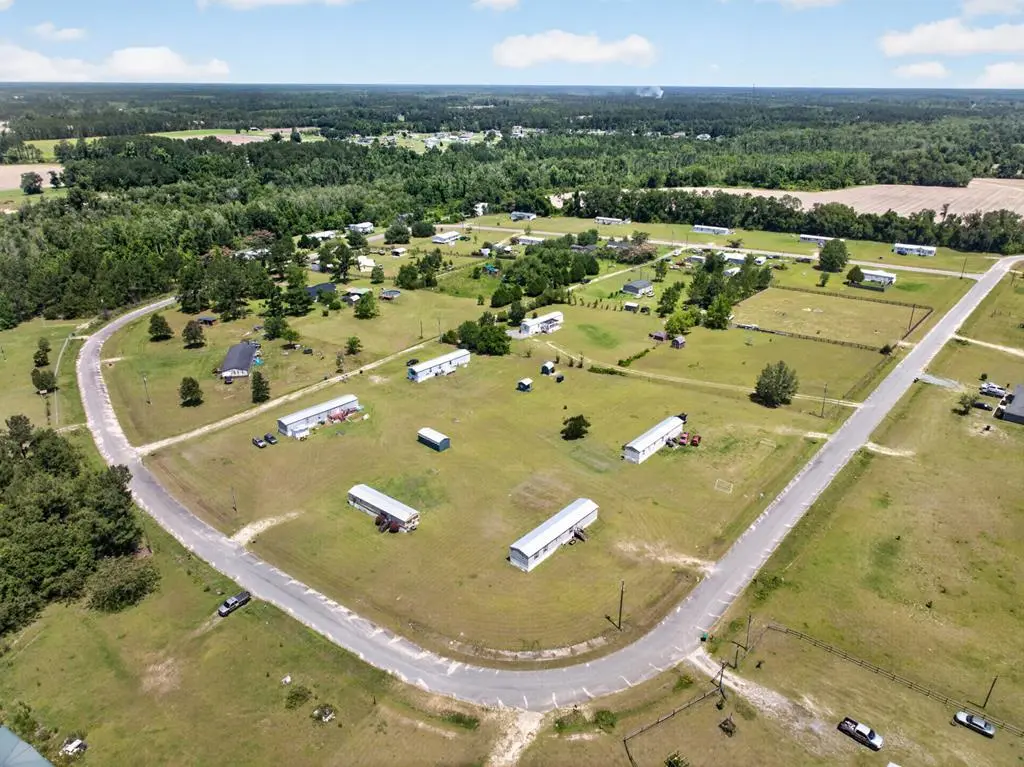
52 Dowdy Ln- Mobile Home Park #5 · Ray City, GA
Flood risk 1/10 · Minimal
- FEMA flood zone
- X (unshaded)
- Chance of flooding over 30 yrs
- 0.0%
- Est. flood insurance / yr
- $507 – $1,088
Fire risk 7/10 · Major
- Est. fire insurance / yr
- $963 – $1,789
Heat risk 8/10 · Major
- Hot days now (above 107°F)
- 7 days/yr
- Hot days in 30 yrs
- 20 days/yr
Wind risk 8/10 · Major
- Chance of severe wind over 30 yrs
- 99.0%
Air-quality risk 6/10 · Moderate
- Unhealthy air days now
- 11 days/yr
- Unhealthy air days in 30 yrs
- 12 days/yr
Risk factors via First Street. Map © Google.
Why this score? — see what drove the B+ grade
The composite is a weighted blend of 9 inputs, each scored 0–100. Each bar is that input's sub-score; the figure is the points it added to the 100-point composite (weight × sub-score).
- Cash flow +30.0/30.0
- 1% rule +10.0/10.0
- DSCR +10.0/10.0
- ARV discount +7.5/15.0
- Appreciation +6.6/10.0
- Schools +3.8/10.0
- Livability +3.2/5.0
- Rent growth +2.5/5.0
- Condition / age +2.2/5.0
$369,000
🖨 Deal sheet (PDF) 📄 Offer letter ✓ Due diligence
Multi-family units
County records classify this as Multi-Family (2-4 Unit). Listing-text estimate: 1 unit. estimate disagrees with records
Listing remarks
Income-producing mobile home park in Ray City, GA generating $3,915 per month in gross rental income, with significant upside through future rent increases. Situated on 3.57 acres, the property consists of five tenant-occupied mobile homes with current rents of $995, $995, $850, $550, and $525 per month. Each home is individually metered for electricity and served by its own septic system, while all units share a private well that was installed approximately two years ago. Tenants maintain their own lawns, helping keep operating expenses low. The homes were manufactured between 1988 and 1997 and all feature metal roofs. Each unit is equipped with HVAC, with all but one system having been re
Key facts
- Private well
- Metal roofs
- Equipped with hvac
Tags
Property features AI
Finance
- Other: Located at 52 Dowdy Ln - Mobile Home Park #5, Ray City, GA 31645
- Financial info: Annual property tax listed as $509
Exterior
- Utilities: Private well water; Septic tank sewer
- Home design: Single-story building; Multi-family residential (multi-unit)
- Construction: Metal siding construction; Metal roof
- Exterior features: Property sits on a 3.57-acre parcel; Zoned R
Neighborhood map
What this means for you Summary
Snapshot
- This is a multifamily listed at $369k. Condition is rated fair.
Deal economics
- At list price, monthly cash flow is $3k ($31k/yr) — positive.
- The deal already cash-flows at list — no discount required.
- Meets the 1% rule at list price ($6k rent vs $369k).
- Cap rate 14.6% vs local median 4.1% in Ray City — top-decile yield for the area; either an underpriced asset or a hidden risk that comps aren't pricing in. Stress-test before assuming the spread holds.
Location & tenants
- Location reads 64/100 on livability (#260 in GA) — a middle-class / working-renter tenant base. Strengths: crime A+, cost of living A+, housing A+; Watch: health & safety D, amenities F, commute F.
- Berrien County (rural): math 48% / reading 44% proficiency, ranked #24 of 174 in GA (top 14%) — families likely to look elsewhere, expect single-tenant / working-renter base with shorter leases.
- Zoned schools: Berrien Primary School (813 students, 83% FRL); Berrien Middle School (math 49% / reading 46%, grade C-, #84 of 470 statewide, top 19%, 684 students, 54% FRL); Berrien High School (math 32% / reading 42%, grade F, #68 of 424 statewide, top 17%, 851 students, 43% FRL) — zoned schools at 60% FRL track the district average.
- Market conditions: 40 active listings in the ZIP; 96 units permitted in Berrien County in 2024 (0 in 5+ unit buildings).
Forward outlook
- In year one you build about $15k of equity ($3k loan paydown + $12k appreciation (3.3% local appreciation)).
- Berrien County population projected at -23% by 2050 — secular population decline; favor cash flow + early exit over multi-decade hold.
- At projected returns (3.3% appreciation + 3.0% rent growth), your $103k cash investment doubles in ~3 years — after that, you're playing with house money.
- By year 3, paydown + projected appreciation supports a ~$36k cash-out refi (75% LTV) — recoverable capital for the next deal without selling this one.
Negotiation context
- Only 5 days on market — expect competitive offers; lowballing is unlikely to land.
Risks & watch-outs
- Climate carrying-cost: severe wind risk, 99% chance of damaging wind over 30y; major wildfire risk; extreme-heat days projected 7→20/yr by 2055 (HVAC capex compounding) — expect insurance premiums to compound above CPI over the hold.
Questions for the listing agent
- Have any recent inspections been done? Can we get a copy of the seller's disclosures and any deferred-maintenance estimates?
- Is there a deadline driving the sale (1031 exchange, divorce, estate, relocation)? That informs how much negotiation room exists.
- Schools are F-rated, which usually means shorter tenancies and higher turnover. Who's the typical renter profile here, and what's been the actual vacancy rate?
- What's the average days-on-market for RENTAL listings here right now (not sales)? A rising rental-DOM trend means longer vacancies and softer asking-rent achievability than the comps imply.
- What's the recent tenant-quality profile in this submarket — average credit score on applications, eviction rate, late-payment / NSF rate, and stable-employment percentage? A property-management company in the area should have these aggregated.
- How much new apartment / multifamily construction is in the pipeline within 1–3 miles? Heavy new supply (>2% of stock underway) typically softens rents 12–24 months out; light construction supports rent growth.
Investment metrics
- 1% rule
- 1.75% ✓
- Cap rate
- 14.62%
- Cash-on-cash
- 29.74%
- DSCR
- 2.32
- GRM
- 4.8
CMA / ARV
No comps found within radius.
Projected returns pro-forma
3.27% appreciation · 3.0% rent growth · sell at horizon
- IRR
- 36.1%
- Equity multiple
- 3.06×
- Total profit
- $212,897
- Equity at exit
- $171,527
- IRR
- 35.9%
- Equity multiple
- 6.06×
- Total profit
- $523,075
- Equity at exit
- $268,790
Cash invested: $103,320 (down + closing). Projections, not guarantees.
Landlord ↔ Tenant lean methodology
- Overall (STATE)
- 90 Strongly Landlord-Friendly
- State Georgia
- 90 Strongly Landlord-Friendly · R+3
- County
- — inherits STATE
- City
- — inherits STATE
ZIP-level market 31645
- Home prices YoY
- 1.4%
- Active inventory
- 40
- Price-to-rent
- 23.8×
Monthly cashflow live
- Estimated rent
- $6,469 medium interval (Pro) →
- Mortgage (P&I)
- −$1,935
- Tax est. 1.5%
- −$461 /mo · $5,535/yr
- Insurance
- −$154
- HOA
- −$0
- Vacancy / Maint / Mgmt
- −$1,358
- Net cashflow
- $2,560
Break-even live
Sensitivity live
| Price | -10% $2,815 | -5% $2,688 | +0% $2,560 | +5% $2,433 | +10% $2,305 |
|---|---|---|---|---|---|
| Rent | -10% $2,049 | -5% $2,305 | +0% $2,560 | +5% $2,816 | +10% $3,071 |
| Rate | -1.0pp $2,746 | -0.5pp $2,654 | base $2,560 | +0.5pp $2,465 | +1.0pp $2,368 |
5-unit breakdown (identical units grouped — click to expand)
| Units | Beds | Baths | Est. rent |
|---|---|---|---|
| 5× units | 2 | 1 | $6,470 |
| #1 | 2 | 1 | $1,294 |
| #2 | 2 | 1 | $1,294 |
| #3 | 2 | 1 | $1,294 |
| #4 | 2 | 1 | $1,294 |
| #5 | 2 | 1 | $1,294 |
| Total (5 units) | $6,469 | ||
UW: 25.0% down · 7.5% · 30yr · 1.5% tax · 5.0% vac · 8.0% maint · 8.0% mgmt
Financing live
Cash to close
- Down payment
- $92,250
- Closing costs
- $11,070
- Reserves months
- —
- Total cash needed
- —
Loan-product check · same deal, 3 products live
Conventional
25% down · 7.5% · 30yr
- Down + closing
- —
- Monthly P&I
- —
- Monthly cashflow
- —
- DSCR
- —
- Eligible?
- —
Personal DTI + credit; lowest rate.
DSCR
20% down · 8.5% · 30yr
- Down + closing
- —
- Monthly P&I
- —
- Monthly cashflow
- —
- DSCR
- —
- Eligible?
- —
No personal income docs; deal must DSCR.
Hard money
10% down · 12.0% · 12mo
- Down + closing
- —
- Monthly P&I
- —
- Monthly cashflow
- —
- DSCR
- —
- Eligible?
- —
Short-term bridge; refi at stabilization.
Listing history 5 events
-
2026-06-13status $369,000 Pending 5 DOM
-
2026-06-12days on market $369,000 Active 5 DOM
-
2026-06-09days on market $369,000 Active 2 DOM
-
2026-06-07remarks 699-char remark
-
2026-06-07$369,000 Active 1 DOM
ⓘ Source: listings_history table (triggers on properties + properties_extension) + one-shot
backfill from property_details.listing_events for pre-trigger history.
Climate risk First Street
- Flood 1/10 Low FEMA zone X (unshaded) · 0% chance over 30 yrs
- Wildfire 7/10 Severe
- Heat 8/10 Severe 7 d/yr ≥107°F today · 20 d/yr by 30 yrs out
- Wind 8/10 Severe 99% chance of damaging wind over 30 yrs
- Air quality 6/10 Major 11 unhealthy d/yr today · 12 by 30 yrs out
Nearby sold comps map
Loading sold comps map…
Walkable amenities ~0.75 mi
Loading nearby amenities…
Taxation est. · year 1
- Rental income
- $77,628
- − Mortgage interest
- −$20,670
- − Property taxes
- −$5,535
- − Insurance
- −$1,845
- − Repairs & maintenance
- −$6,210
- − Management
- −$6,210
- − Depreciation
- −$10,735
- Taxable income
- $26,423
- Est. tax owed @ 24.0%
- −$6,342
- After-tax cash flow
- $24,384/yr
For passive investors: Depreciation is non-cash, so a rental often shows a tax loss while cash-flowing — sheltering income. Rental losses are passive: they offset passive income freely, and up to $25,000/yr can offset ordinary (W-2) income if you actively participate and your MAGI is under $100k (phasing out to $0 by $150k); unused losses carry forward. On sale, claimed depreciation is recaptured at up to 25%, and gains may owe capital-gains tax (a 1031 exchange can defer both). Figures are a year-1 estimate at your 24.0% rate — not tax advice; consult a CPA.
Condition & rehab AI · 13 photos
This mobile home park requires significant cosmetic repairs and maintenance to improve its condition and value. A new roof and exterior updates would significantly enhance its appeal and marketability.
Repairs flagged
- Major Roof inspection and repairs — Metal roofs may have leaks or damage that needs addressing.
- Moderate Exterior painting and repairs — Paint chipping and siding damage require attention to maintain appearance.
- Major Flooring replacement — Given the age of the homes, flooring may be worn and in need of replacement.
Value-add opportunities
- Both Roof replacement — A new roof would significantly improve the home's appearance and value.
- Both Exterior painting and repairs — Fresh paint and repairs would enhance curb appeal and home value.
- Both Landscaping improvements — Aesthetic improvements would attract more tenants and increase rental value.
Renovation cost estimate screening
| Repair item | Severity | Est. cost |
|---|---|---|
| Roof inspection and repairs · Metal roofs may have leaks or damage that needs addressing. | Major | $15,000–50,000 |
| Exterior painting and repairs · Paint chipping and siding damage require attention to maintain appearance. | Moderate | $3,000–15,000 |
| Flooring replacement · Given the age of the homes, flooring may be worn and in need of replacement. | Major | $15,000–50,000 |
| Total estimated repair cost · 3 items | $33,000–115,000 |
Value-add ROI direction
- Both Roof replacement — A new roof would significantly improve the home's appearance and value. ↑
- Both Exterior painting and repairs — Fresh paint and repairs would enhance curb appeal and home value. ↑
- Both Landscaping improvements — Aesthetic improvements would attract more tenants and increase rental value. ↑
ⓘ Cost ranges are severity-bucket heuristics (US national rule-of-thumb). Get contractor quotes + a written scope before underwriting a rehab budget.
Schools (NCES district)
- District
- Berrien County
- NCES district ID
- 1300390
- Math proficiency
- 48% ▲ 1.00%
- Reading proficiency
- 44% ▼ -3.00%
- Median HH income
- $33,858
- Composite
- 37.95/100
- National rank
- #4302
- State rank
- #24 of 174 in GA
Livability — Ray City
- Score
- 64/100
- State rank
- #260
- US rank
- #14250
Category grades
Schools grade is shown separately in the Schools card above.
Census & demographics
- Population (ZIP)
- 4,971
Population outlook (Berrien County) Hauer SSP2
- Today (2025)
- 17,982 people
- By 2030
- 17,282 · -3.9%
- By 2040
- 15,676 · -12.8%
- By 2050
- 13,876 · -22.8%
- By 2075
- 9,689 · -46.1%
- By 2100
- 6,430 · -64.2%
Race, ethnicity, and origin ACS 2023
- Neighborhood character
- Predominantly White (74%)
- Race & ethnicity
- White 74% Black 11% Hispanic / Latino 10% Two or more races 5% Asian 1%
- Hispanic origin (detail)
- Mexican 3% Puerto Rican 3%
- Common ancestry
- Slovak 2% Iranian 1% Lithuanian 1%
- Foreign-born
- 2% · Canada
- Languages at home
- 92% English-only · Spanish 8%
Political lean MEDSL · Berrien
- 2024 margin
- Solid R (+69.8) · D 15.0% · R 84.8%
- 2008→2024 swing
- -16.6pp toward R · 2008: -53.2pp · 2024: -69.8pp
- All cycles
- 2024: R+69.8 2020: R+66.5 2016: R+66.5 2012: R+57.7 2008: R+53.2
Not yet ingested
- Civics
- —
Market trends
- HPI YoY
- ▲ 3.27%
- Current HPI
- 233.1015
- Rent YoY
- —
- Metro
- —
- State GDP YoY
- ▲ 2.66%
- F500 in state
- 28
Industry mix (Fortune 500 HQ in GA)
| Industry | F500 HQs | Revenue |
|---|---|---|
| Paper / Packaging | 2 | $29B |
|
||
| Retail | 1 | $160B |
|
||
| Transportation / Logistics | 1 | $91B |
|
||
| Airlines | 1 | $62B |
|
||
| Consumer Goods | 1 | $47B |
|
||
| Utilities | 1 | $25B |
|
||
Price history
1 event — show timeline
- 2026-06-07 Listed $369,000 SGMLS
Cash-flow waterfall
monthlySold comps — $/sqft
last 12 mo · ≤1 miLoading sold comps…