 🏷️ Likely Rental
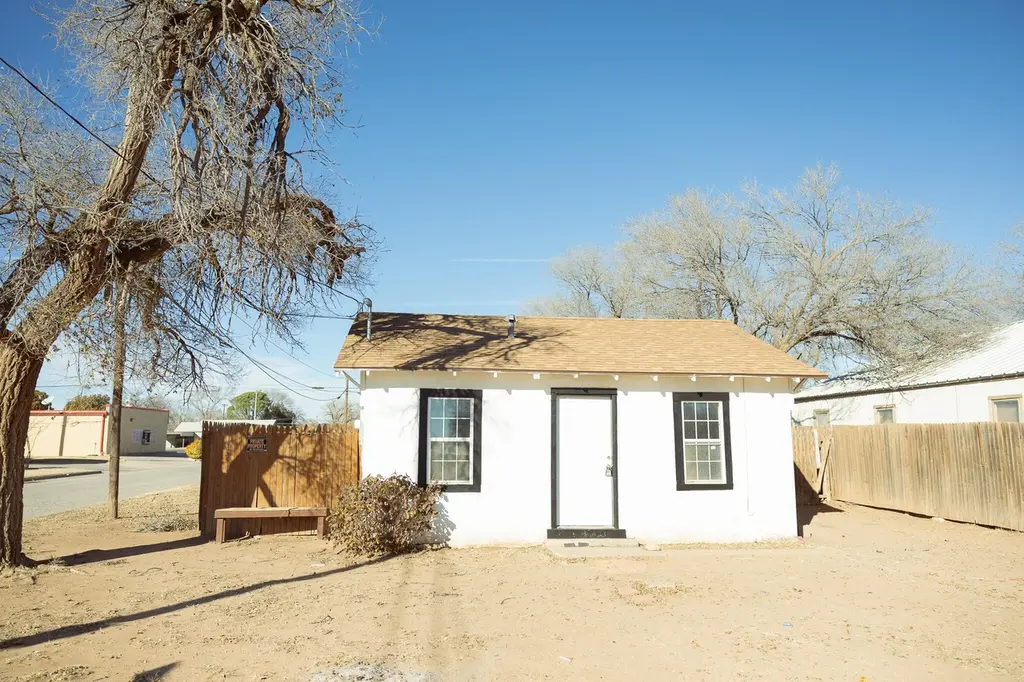
921 W 11th St · Littlefield, TX
Flood risk 1/10 · Minimal
- FEMA flood zone
- —
- Chance of flooding over 30 yrs
- 0.0%
- Est. flood insurance / yr
- —
Fire risk 4/10 · Minor
- Est. fire insurance / yr
- $1,222 – $2,270
Heat risk 4/10 · Minor
- Hot days now (above 98°F)
- 7 days/yr
- Hot days in 30 yrs
- 19 days/yr
Wind risk 2/10 · Minimal
- Chance of severe wind over 30 yrs
- —
Air-quality risk 1/10 · Minimal
- Unhealthy air days now
- 0 days/yr
- Unhealthy air days in 30 yrs
- 0 days/yr
Risk factors via First Street. Map © Google.
Why this score? — see what drove the C+ grade
The composite is a weighted blend of 9 inputs, each scored 0–100. Each bar is that input's sub-score; the figure is the points it added to the 100-point composite (weight × sub-score).
- Cash flow +19.3/30.0
- ARV discount +15.0/15.0
- DSCR +6.1/10.0
- Appreciation +4.7/10.0
- 1% rule +4.3/10.0
- Livability +3.2/5.0
- Schools +3.0/10.0
- Rent growth +2.5/5.0
- Condition / age +2.5/5.0
$90,000
🖨 Deal sheet 📄 Offer letter ✓ Due diligence
Listing remarks MLS
Check out this great property that has 2 houses on 1 lot. This property could be a great opportunity where you can live in one house and rent the other house and use the rental income towards your mortgage payment. The house facing 11th Street is 1 bedroom, 1 bathroom. This house has a new a/c unit, new flooring and paint. Bathroom has been updated in last 3 years. The second house that faces Monticello Ave is 2 bedroom, 1 Bathroom. The roof was replaced in 2025, and the hvac, flooring, insulation, water heater, paint and windows have been replaced in the last 3 years. Each house has it's own separate entry, separate driveway, separate backyard and fence. The combined square footage for both houses is 1160. If you are an investor looking for cash flow, this is a great property. Average combined rent is $1250 per month! Annual Property Taxes on this property is $655. The front house is a 1/1 while the back house is a 2/1.
Key facts
- Replaced insulation
- New flooring
- New paint
Tags
Neighborhood map
What this means for you Summary
Snapshot
- This is a 3-bed/1.0-bath single-family listed at $90k.
Deal economics
- At list price, monthly cash flow is $98 ($1k/yr) — positive.
- The deal already cash-flows at list — no discount required.
- To meet the 1% rule (rent ≥ 1% of price), the offer needs to be $84k (6.8% below list).
- Recommended offer: $84k (6.8% below list) — sets the bar for 1% rule.
Location & tenants
- Location reads 65/100 on livability (#658 in TX) — a middle-class / working-renter tenant base. Strengths: cost of living A+, housing A+, crime B+; Watch: health & safety C-, schools D, amenities F.
- Littlefield ISD (town): math 34% / reading 37% proficiency, ranked #527 of 826 in TX (top 64%) — families likely to look elsewhere, expect single-tenant / working-renter base with shorter leases; 66% free/reduced lunch — lower-income household profile, screen leases tightly.
- Market conditions: 44 active listings in the ZIP.
Forward outlook
- In year one you build about $151 of equity ($622 loan paydown + $-471 appreciation (-0.5% local appreciation)).
- Lamb County population projected at -20% by 2050 — secular population decline; favor cash flow + early exit over multi-decade hold.
- At projected returns (-0.5% appreciation + 3.0% rent growth), your $25k cash investment doubles in ~10 years — after that, you're playing with house money.
Negotiation context
- It's been on market 78 days — a 6% lower offer ($85k) is reasonable based on typical stale-listing flexibility.
Risks & watch-outs
- Watch-outs: built in 1950 — expect roof / HVAC / electrical / plumbing capex.
Questions for the listing agent
- It's been on market 78 days. Have you received any prior offers? Is the seller open to a 7% concession, seller financing, or rate buy-down credit?
- Built in 1950 — when were the roof, HVAC, electrical panel, plumbing, and water heater last replaced?
- Why hasn't it sold? Are there any deal-killer items the seller is aware of (foundation, flood, title, zoning, code violations)?
- Is there a deadline driving the sale (1031 exchange, divorce, estate, relocation)? That informs how much negotiation room exists.
- Schools are D-rated, which usually means shorter tenancies and higher turnover. Who's the typical renter profile here, and what's been the actual vacancy rate?
- What's the average days-on-market for RENTAL listings here right now (not sales)? A rising rental-DOM trend means longer vacancies and softer asking-rent achievability than the comps imply.
- What's the recent tenant-quality profile in this submarket — average credit score on applications, eviction rate, late-payment / NSF rate, and stable-employment percentage? A property-management company in the area should have these aggregated.
- How much new for-sale + rental construction is in the pipeline within 1–3 miles? Heavy new supply typically softens prices + rents 12–24 months out; constrained supply supports both.
Investment metrics
- 1% rule
- 0.93% ✗
- Cap rate
- 7.60%
- Cash-on-cash
- 4.69%
- DSCR
- 1.21
- GRM
- 8.9
CMA / ARV
- ARV (median comp)
- $130,117
- List price
- $90,000
- Delta
- -30.83%
- Verdict
- UNDERPRICED
- Comps
- 2 within 1.0 mi
Projected returns pro-forma
-0.52% appreciation · 3.0% rent growth · sell at horizon
- IRR
- 1.2%
- Equity multiple
- 1.06×
- Total profit
- $1,419
- Equity at exit
- $23,801
- IRR
- 7.2%
- Equity multiple
- 1.74×
- Total profit
- $18,601
- Equity at exit
- $26,809
Cash invested: $25,200 (down + closing). Projections, not guarantees.
Landlord ↔ Tenant lean methodology
- Overall (STATE)
- 87 Strongly Landlord-Friendly
- State Texas
- 87 Strongly Landlord-Friendly · R+5
- County
- — inherits STATE
- City
- — inherits STATE
ZIP-level market 79339
- Home prices YoY
- -0.4%
- Active inventory
- 44
- Price-to-rent
- 8.9×
Monthly cashflow live
- Estimated rent
- $839 medium interval (Pro) →
- Mortgage (P&I)
- −$472
- Tax from tax record
- −$55 /mo · $658/yr
- Insurance
- −$38
- HOA
- −$0
- Vacancy / Maint / Mgmt
- −$176
- Net cashflow
- $98
Break-even live
UW: 25.0% down · 7.5% · 30yr · 1.5% tax · 5.0% vac · 8.0% maint · 8.0% mgmt
Financing live
Cash to close
- Down payment
- $22,500
- Closing costs
- $2,700
- Reserves months
- —
- Total cash needed
- —
Loan-product check · same deal, 3 products live
Conventional
25% down · 7.5% · 30yr
- Down + closing
- —
- Monthly P&I
- —
- Monthly cashflow
- —
- DSCR
- —
- Eligible?
- —
Personal DTI + credit; lowest rate.
DSCR
20% down · 8.5% · 30yr
- Down + closing
- —
- Monthly P&I
- —
- Monthly cashflow
- —
- DSCR
- —
- Eligible?
- —
No personal income docs; deal must DSCR.
Hard money
10% down · 12.0% · 12mo
- Down + closing
- —
- Monthly P&I
- —
- Monthly cashflow
- —
- DSCR
- —
- Eligible?
- —
Short-term bridge; refi at stabilization.
Listing history 25 events
-
2026-06-18days on market $90,000 Active 78 DOM
-
2026-06-17days on market $90,000 Active 77 DOM
-
2026-06-16days on market $90,000 Active 76 DOM
-
2026-06-15days on market $90,000 Active 75 DOM
-
2026-06-13days on market $90,000 Active 73 DOM
-
2026-06-12days on market $90,000 Active 72 DOM
-
2026-06-10days on market $90,000 Active 69 DOM
-
2026-06-08days on market $90,000 Active 68 DOM
-
2026-06-08days on market $90,000 Active 67 DOM
-
2026-06-07days on market $90,000 Active 66 DOM
-
2026-06-04price $90,000 Active 63 DOM
-
2026-06-03days on market $95,000 Active 63 DOM
-
2026-06-02days on market $95,000 Active 62 DOM
-
2026-06-01days on market $95,000 Active 61 DOM
-
2026-05-31days on market $95,000 Active 60 DOM
-
2026-05-07price $95,000 937-char remark
Show marketing remark (937 chars)
Check out this great property that has 2 houses on 1 lot. This property could be a great opportunity where you can live in one house and rent the other house and use the rental income towards your mortgage payment. The house facing 11th Street is 1 bedroom, 1 bathroom. This house has a new a/c unit, new flooring and paint. Bathroom has been updated in last 3 years. The second house that faces Monticello Ave is 2 bedroom, 1 Bathroom. The roof was replaced in 2025, and the hvac, flooring, insulation, water heater, paint and windows have been replaced in the last 3 years. Each house has it's own separate entry, separate driveway, separate backyard and fence. The combined square footage for both houses is 1160. If you are an investor looking for cash flow, this is a great property. Average combined rent is $1250 per month! Annual Property Taxes on this property is $655. The front house is a 1/1 while the back house is a 2/1.
-
2026-05-01price $97,000 937-char remark
Show marketing remark (937 chars)
Check out this great property that has 2 houses on 1 lot. This property could be a great opportunity where you can live in one house and rent the other house and use the rental income towards your mortgage payment. The house facing 11th Street is 1 bedroom, 1 bathroom. This house has a new a/c unit, new flooring and paint. Bathroom has been updated in last 3 years. The second house that faces Monticello Ave is 2 bedroom, 1 Bathroom. The roof was replaced in 2025, and the hvac, flooring, insulation, water heater, paint and windows have been replaced in the last 3 years. Each house has it's own separate entry, separate driveway, separate backyard and fence. The combined square footage for both houses is 1160. If you are an investor looking for cash flow, this is a great property. Average combined rent is $1250 per month! Annual Property Taxes on this property is $655. The front house is a 1/1 while the back house is a 2/1.
-
2026-04-27price $99,500 937-char remark
Show marketing remark (937 chars)
Check out this great property that has 2 houses on 1 lot. This property could be a great opportunity where you can live in one house and rent the other house and use the rental income towards your mortgage payment. The house facing 11th Street is 1 bedroom, 1 bathroom. This house has a new a/c unit, new flooring and paint. Bathroom has been updated in last 3 years. The second house that faces Monticello Ave is 2 bedroom, 1 Bathroom. The roof was replaced in 2025, and the hvac, flooring, insulation, water heater, paint and windows have been replaced in the last 3 years. Each house has it's own separate entry, separate driveway, separate backyard and fence. The combined square footage for both houses is 1160. If you are an investor looking for cash flow, this is a great property. Average combined rent is $1250 per month! Annual Property Taxes on this property is $655. The front house is a 1/1 while the back house is a 2/1.
-
2026-04-20price $99,800 937-char remark
Show marketing remark (937 chars)
Check out this great property that has 2 houses on 1 lot. This property could be a great opportunity where you can live in one house and rent the other house and use the rental income towards your mortgage payment. The house facing 11th Street is 1 bedroom, 1 bathroom. This house has a new a/c unit, new flooring and paint. Bathroom has been updated in last 3 years. The second house that faces Monticello Ave is 2 bedroom, 1 Bathroom. The roof was replaced in 2025, and the hvac, flooring, insulation, water heater, paint and windows have been replaced in the last 3 years. Each house has it's own separate entry, separate driveway, separate backyard and fence. The combined square footage for both houses is 1160. If you are an investor looking for cash flow, this is a great property. Average combined rent is $1250 per month! Annual Property Taxes on this property is $655. The front house is a 1/1 while the back house is a 2/1.
-
2026-04-08price $99,900 937-char remark
Show marketing remark (937 chars)
Check out this great property that has 2 houses on 1 lot. This property could be a great opportunity where you can live in one house and rent the other house and use the rental income towards your mortgage payment. The house facing 11th Street is 1 bedroom, 1 bathroom. This house has a new a/c unit, new flooring and paint. Bathroom has been updated in last 3 years. The second house that faces Monticello Ave is 2 bedroom, 1 Bathroom. The roof was replaced in 2025, and the hvac, flooring, insulation, water heater, paint and windows have been replaced in the last 3 years. Each house has it's own separate entry, separate driveway, separate backyard and fence. The combined square footage for both houses is 1160. If you are an investor looking for cash flow, this is a great property. Average combined rent is $1250 per month! Annual Property Taxes on this property is $655. The front house is a 1/1 while the back house is a 2/1.
-
2026-04-01$100,000 Active 937-char remark
Show marketing remark (937 chars)
Check out this great property that has 2 houses on 1 lot. This property could be a great opportunity where you can live in one house and rent the other house and use the rental income towards your mortgage payment. The house facing 11th Street is 1 bedroom, 1 bathroom. This house has a new a/c unit, new flooring and paint. Bathroom has been updated in last 3 years. The second house that faces Monticello Ave is 2 bedroom, 1 Bathroom. The roof was replaced in 2025, and the hvac, flooring, insulation, water heater, paint and windows have been replaced in the last 3 years. Each house has it's own separate entry, separate driveway, separate backyard and fence. The combined square footage for both houses is 1160. If you are an investor looking for cash flow, this is a great property. Average combined rent is $1250 per month! Annual Property Taxes on this property is $655. The front house is a 1/1 while the back house is a 2/1.
-
2026-03-31price $100,000
-
2025-07-02price $110,000
-
2021-07-01soldstatus
-
2020-07-31soldstatus
ⓘ Source: listings_history table (triggers on properties + properties_extension) + one-shot
backfill from property_details.listing_events for pre-trigger history.
Tax reassessment forecast TX · Resets to sale price
- Current annual tax
- $658 · $55/mo
- Projected year-2 tax
- $1,647 · $137/mo
- Expected delta
- +$989/yr (+$82/mo · 150.5%)
ⓘ Screening estimate from a state-policy table — verify with the county assessor before closing.
Climate risk First Street
- Flood 1/10 Low 0% chance over 30 yrs
- Wildfire 4/10 Moderate
- Heat 4/10 Moderate 7 d/yr ≥98°F today · 19 d/yr by 30 yrs out
- Wind 2/10 Low
- Air quality 1/10 Low 0 unhealthy d/yr today · 0 by 30 yrs out
Nearby sold comps map
Loading sold comps map…
Walkable amenities ~0.75 mi
Loading nearby amenities…
Taxation est. · year 1
- Rental income
- $10,066
- − Mortgage interest
- −$5,041
- − Property taxes
- −$658
- − Insurance
- −$450
- − Repairs & maintenance
- −$805
- − Management
- −$805
- − Depreciation
- −$2,618
- Taxable loss
- −$312
- Est. tax savings @ 24.0%
- +$75
- After-tax cash flow
- $1,256/yr
For passive investors: Depreciation is non-cash, so a rental often shows a tax loss while cash-flowing — sheltering income. Rental losses are passive: they offset passive income freely, and up to $25,000/yr can offset ordinary (W-2) income if you actively participate and your MAGI is under $100k (phasing out to $0 by $150k); unused losses carry forward. On sale, claimed depreciation is recaptured at up to 25%, and gains may owe capital-gains tax (a 1031 exchange can defer both). Figures are a year-1 estimate at your 24.0% rate — not tax advice; consult a CPA.
Schools (NCES district)
- District
- Littlefield ISD
- NCES district ID
- 4827750
- Math proficiency
- 34% ▼ -11.00%
- Reading proficiency
- 37% ▼ -1.00%
- Median HH income
- $36,900
- Composite
- 29.51/100
- National rank
- #6503
- State rank
- #527 of 826 in TX
Livability — Littlefield
- Score
- 65/100
- State rank
- #658
- US rank
- #12392
Category grades
Schools grade is shown separately in the Schools card above.
Census & demographics
- Census place
- Littlefield, TX
- Population (ZIP)
- 6,707
Population outlook (Lamb County) Hauer SSP2
- Today (2025)
- 12,357 people
- By 2030
- 11,878 · -3.9%
- By 2040
- 10,950 · -11.4%
- By 2050
- 9,929 · -19.6%
- By 2075
- 7,355 · -40.5%
- By 2100
- 4,603 · -62.7%
Race, ethnicity, and origin ACS 2023
- Neighborhood character
- Diverse neighborhood (Simpson 0.56)
- Race & ethnicity
- Hispanic / Latino 53% White 41% Two or more races 17% Black 4%
- Hispanic origin (detail)
- Mexican 51%
- Common ancestry
- Italian 1% Slovak 1% Iranian 1%
- Foreign-born
- 8% · Canada
- Languages at home
- 65% English-only · Spanish 35%
Political lean MEDSL · Lamb
- 2024 margin
- Solid R (+64.3) · D 17.6% · R 81.9%
- 2008→2024 swing
- -15.9pp toward R · 2008: -48.4pp · 2024: -64.3pp
- All cycles
- 2024: R+64.3 2020: R+60.8 2016: R+58.1 2012: R+50.3 2008: R+48.4
Not yet ingested
- Civics
- —
Market trends
- HPI YoY
- ▼ -0.52%
- Current HPI
- 140.3662
- Rent YoY
- —
- Metro
- —
- State GDP YoY
- ▲ 3.95%
- F500 in state
- 110
Industry mix (Fortune 500 HQ in TX)
| Industry | F500 HQs | Revenue |
|---|---|---|
| Energy | 16 | $1,198B |
|
||
| Technology | 5 | $198B |
|
||
| Engineering / Construction | 4 | $72B |
|
||
| Energy Services | 3 | $60B |
|
||
| Utilities | 3 | $41B |
|
||
| Healthcare | 2 | $330B |
|
||
Price history
-13.6% since first listed10 events — show timeline
- 2026-05-07 Price Changed $95,000 LARMLS
- 2026-05-01 Price Changed $97,000 LARMLS
- 2026-04-27 Price Changed $99,500 LARMLS
- 2026-04-20 Price Changed $99,800 LARMLS
- 2026-04-08 Price Changed $99,900 LARMLS
- 2026-04-01 Listed $100,000 LARMLS
- 2026-03-31 Price Changed $100,000 LARMLS
- 2025-07-02 Price Changed $110,000 LARMLS
- 2021-07-01 Sold (Public Records) — Public Records
- 2020-07-31 Sold (Public Records) — Public Records
Property tax history
+8.5%/yrLatest (2025): $658 · +7.7% YoY. Source: county tax records.
Cash-flow waterfall
monthlySold comps — $/sqft
last 12 mo · ≤1 miLoading sold comps…