 Duplex
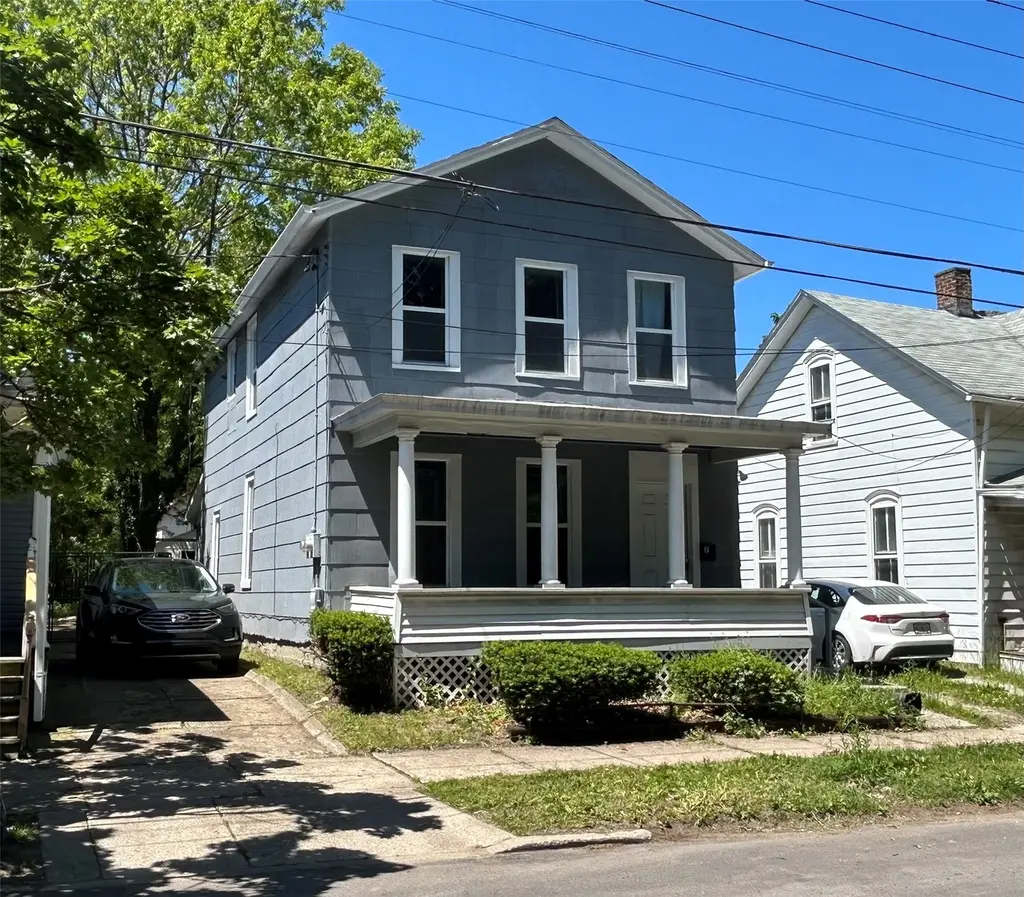
2206 Cherry St · Erie, PA
Flood risk 4/10 · Minor
- FEMA flood zone
- X (unshaded)
- Chance of flooding over 30 yrs
- 0.21%
- Est. flood insurance / yr
- $473 – $860
Fire risk 1/10 · Minimal
- Est. fire insurance / yr
- $511 – $949
Heat risk 2/10 · Minimal
- Hot days now (above 90°F)
- 7 days/yr
- Hot days in 30 yrs
- 15 days/yr
Wind risk 1/10 · Minimal
- Chance of severe wind over 30 yrs
- —
Air-quality risk 2/10 · Minimal
- Unhealthy air days now
- 1 days/yr
- Unhealthy air days in 30 yrs
- 3 days/yr
Risk factors via First Street. Map © Google.
Why this score? — see what drove the C+ grade
The composite is a weighted blend of 9 inputs, each scored 0–100. Each bar is that input's sub-score; the figure is the points it added to the 100-point composite (weight × sub-score).
- Cash flow +26.6/30.0
- DSCR +9.1/10.0
- ARV discount +7.5/15.0
- 1% rule +6.9/10.0
- Livability +4.2/5.0
- Rent growth +3.2/5.0
- Condition / age +2.5/5.0
- Schools +1.3/10.0
- Appreciation +0.0/10.0
$169,900
🖨 Deal sheet 📄 Offer letter ✓ Due diligence
Multi-family units
County records classify this as Multi-Family (2-4 Unit). Listing-text estimate: 2 units. confirmed
Listing remarks MLS
SPACIOUS TWO UNIT INVESTMENT PROPERTY! EACH UNIT HAS A LIVING RM, DINING RM, KITCHEN, THREE BEDROOMS & 1 FULL BATH FOR A TOTAL OF 6 BEDS 2 BATHS. EACH UNIT ALSO HAS BASEMENT ACCESS. AWESOME MONEY MAKER! THIS PROPERTY CAN GENERATE YOU AT LEAST $1,000 MONTHLY AND IS MINUTES FROM LOTS OF ATTRACTIONS LIKE LIBERTY PARK, DOWNTOWN ERIE, MAJOR BUS LINE & MEDICAL CENTER. SELLING AS IS. SHOWING APPT REQUIRED.
Key facts
- Separate utilities
- Modernized kitchens
- Off-street parking
Tags
Property features AI
Finance
- Financial info: Unit rents reported: one unit at $800, one unit at $900
Exterior
- Parking: 2 parking spaces
- Utilities: Public water; Public sewer
- Home design: Multi-family residential income property; Two stories; Zoning: R-2
- Construction: Asbestos construction material
- Exterior features: Level lot; Paved road access; Composition roof
Interior
- Kitchen: Each unit includes a range/oven; Each unit includes a refrigerator; Each unit includes a dishwasher
- Bedrooms: Two 2-bedroom units
- Bathrooms: Each unit has 1 bathroom
- Heating & cooling: Forced air heating; Central air conditioning
- Interior features: Two-level layout
- Laundry & utility: Laundry in each unit
Neighborhood map
What this means for you Summary
Snapshot
- This is a 2 × 2-bed/1.0-bath units multifamily listed at $170k.
Deal economics
- At list price, monthly cash flow is $453 ($5k/yr) — positive. Per door: $227/mo.
- The deal already cash-flows at list — no discount required.
- Meets the 1% rule at list price ($2k rent vs $170k).
- Recommended offer: $167k (1.5% below list) — sets the bar for market timing.
- Cap rate 9.5% vs local median 5.2% in Erie — top-decile yield for the area; either an underpriced asset or a hidden risk that comps aren't pricing in. Stress-test before assuming the spread holds.
Location & tenants
- Location reads 83/100 on livability (#109 in PA, #840 nationally) — a professional / high-income tenant draw. Strengths: amenities A+, commute A+, cost of living A+; Watch: crime D+, employment F.
- Erie City SD (urban): math 12% / reading 19% proficiency, ranked #510 of 539 in PA (top 95%) — low school quality limits family demand, transient renter base, plan for 1-2y turnover; 81% free/reduced lunch — lower-income household profile, screen leases tightly.
- Market conditions: Rents rising (+3.0%/yr); 56 active listings in the ZIP; lower-income renter base — watch delinquency; 364 units permitted in Erie County in 2024 (188 in 5+ unit buildings).
- At $2,029/mo this rent would consume 63% of the median local household income ($39k/yr) (locally 1044% of renters already pay >50% of income on rent) — very limited rent-growth headroom before tenants either downsize or default.
Forward outlook
- Local home prices are declining (-3.0%/yr); year-one equity from $1k of loan paydown is wiped out by about $5k of value loss. Plan a longer hold.
- Erie County population projected at -14% by 2050 — secular population decline; favor cash flow + early exit over multi-decade hold.
- At projected returns (-3.0% appreciation + 3.0% rent growth), your $48k cash investment doubles in ~10 years — after that, you're playing with house money.
Negotiation context
- It's been on market 18 days — a 2% lower offer ($167k) is reasonable based on typical stale-listing flexibility.
- 3 sale attempts since 4y ago with the ask held roughly flat each time — persistent listings suggest the price (not the market) is what's stuck; bring a comps-based counter.
Risks & watch-outs
- Watch-outs: built in 1882 — expect roof / HVAC / electrical / plumbing capex.
Questions for the listing agent
- Can we see the unit-by-unit rent roll, current vacancy, and any below-market leases? What's the average tenancy length?
- What capital expenditures (roof, boiler, parking lot, exteriors) have been made in the last 5 years, and what's planned in the next 2?
- Built in 1882 — when were the roof, HVAC, electrical panel, plumbing, and water heater last replaced?
- Is there a deadline driving the sale (1031 exchange, divorce, estate, relocation)? That informs how much negotiation room exists.
- Crime grade is D in this area — have there been break-ins, vandalism, or insurance claims at this property in the last 3 years? What carrier currently insures it and at what premium?
- What's the average days-on-market for RENTAL listings here right now (not sales)? A rising rental-DOM trend means longer vacancies and softer asking-rent achievability than the comps imply.
- What's the recent tenant-quality profile in this submarket — average credit score on applications, eviction rate, late-payment / NSF rate, and stable-employment percentage? A property-management company in the area should have these aggregated.
- How much new apartment / multifamily construction is in the pipeline within 1–3 miles? Heavy new supply (>2% of stock underway) typically softens rents 12–24 months out; light construction supports rent growth.
Investment metrics
- 1% rule
- 1.19% ✓
- Cap rate
- 9.49%
- Cash-on-cash
- 11.43%
- DSCR
- 1.51
- GRM
- 7.0
CMA / ARV
- ARV (on-the-fly)
- $105,108
- Comps found
- 12
Show comp detail 12 sales within ~0.75 mi
| Address | Dist | Beds/Ba | Sqft | Sold | Price | $/sf | Match |
|---|---|---|---|---|---|---|---|
| 719 W 16th St | 0.42mi | 6/2.0 | 1,850 (+0%) | 1mo | $92,000 | $50 | 79 |
| 1901 Liberty St | 0.27mi | 7/2.0 (+1) | 1,782 (-3%) | 8mo | $130,000 | $73 | 71 |
| 1809 Myrtle St | 0.50mi | 6/2.0 | 1,842 (-0%) | 10mo | $79,500 | $43 | 68 |
| 421 W 16th St | 0.45mi | 5/2.0 (-1) | 1,760 (-5%) | 2mo | $79,500 | $45 | 65 |
| 721 W 19th St | 0.26mi | 6/2.0 | 2,010 (+9%) | 10mo | $120,000 | $60 | 65 |
| 2925 Cherry St | 0.48mi | 5/— (-1) | 1,848 (+0%) | 10mo | $135,000 | $73 | 64 |
| 1822 Cherry St | 0.22mi | 6/2.0 | 2,032 (+10%) | 10mo | $45,000 | $22 | 64 |
| 348 W 24th St | 0.34mi | 5/2.0 (-1) | 1,970 (+7%) | 11mo | $95,000 | $48 | 59 |
| 2916 Hazel St | 0.47mi | 6/2.0 | 2,032 (+10%) | 6mo | $121,000 | $60 | 56 |
| 1114 W 20th St | 0.60mi | 5/2.0 (-1) | 1,936 (+5%) | 4mo | $111,000 | $57 | 55 |
| 1151 W 22nd St | 0.66mi | 5/2.0 (-1) | 2,112 (+14%) | 7mo | $114,000 | $54 | 34 |
| 1156 W 21st St | 0.67mi | 5/3.0 (-1) | 1,693 (-8%) | 19mo | $129,900 | $77 | 30 |
Match score weights: distance 35% · size 25% · config 20% · recency 20%. Top-matched comps best support the ARV.
Projected returns pro-forma
-3.0% appreciation · 2.97% rent growth · sell at horizon
- IRR
- 0.7%
- Equity multiple
- 1.03×
- Total profit
- $1,285
- Equity at exit
- $25,333
- IRR
- 10.3%
- Equity multiple
- 1.80×
- Total profit
- $38,095
- Equity at exit
- $14,690
Cash invested: $47,572 (down + closing). Projections, not guarantees.
Landlord ↔ Tenant lean methodology
- Overall (STATE)
- 62 Landlord-Friendly
- State Pennsylvania
- 62 Landlord-Friendly · EVEN
- County
- — inherits STATE
- City
- — inherits STATE
ZIP-level market 16502
- Home prices YoY
- -30.5%
- Rents YoY
- 3.0%
- Active inventory
- 56
- Price-to-rent
- 14.0×
Monthly cashflow live
- Estimated rent
- $2,029 high interval (Pro) →
- Mortgage (P&I)
- −$891
- Tax from tax record
- −$188 /mo · $2,256/yr
- Insurance
- −$71
- HOA
- −$0
- Vacancy / Maint / Mgmt
- −$426
- Net cashflow
- $453
Break-even live
2-unit breakdown (identical units grouped — click to expand)
| Units | Beds | Baths | Est. rent |
|---|---|---|---|
| 2× units | 2 | 1 | $2,030 |
| #1 | 2 | 1 | $1,015 |
| #2 | 2 | 1 | $1,015 |
| Total (2 units) | $2,029 | ||
UW: 25.0% down · 7.5% · 30yr · 1.5% tax · 5.0% vac · 8.0% maint · 8.0% mgmt
Financing live
Cash to close
- Down payment
- $42,475
- Closing costs
- $5,097
- Reserves months
- —
- Total cash needed
- —
Loan-product check · same deal, 3 products live
Conventional
25% down · 7.5% · 30yr
- Down + closing
- —
- Monthly P&I
- —
- Monthly cashflow
- —
- DSCR
- —
- Eligible?
- —
Personal DTI + credit; lowest rate.
DSCR
20% down · 8.5% · 30yr
- Down + closing
- —
- Monthly P&I
- —
- Monthly cashflow
- —
- DSCR
- —
- Eligible?
- —
No personal income docs; deal must DSCR.
Hard money
10% down · 12.0% · 12mo
- Down + closing
- —
- Monthly P&I
- —
- Monthly cashflow
- —
- DSCR
- —
- Eligible?
- —
Short-term bridge; refi at stabilization.
Listing history 15 events
-
2026-06-19days on market $169,900 Active 18 DOM
-
2026-06-18days on market $169,900 Active 17 DOM
-
2026-06-17days on market $169,900 Active 16 DOM
-
2026-06-16days on market $169,900 Active 15 DOM
-
2026-06-15days on market $169,900 Active 14 DOM
-
2026-06-14days on market $169,900 Active 12 DOM
-
2026-06-13days on market $169,900 Active 11 DOM
-
2026-06-10days on market $169,900 Active 9 DOM
-
2026-06-09days on market $169,900 Active 8 DOM
-
2026-06-08days on market $169,900 Active 7 DOM
-
2026-06-07days on market $169,900 Active 6 DOM
-
2026-06-05days on market $169,900 Active 3 DOM
-
2026-06-03days on market $169,900 Active 2 DOM
-
2026-06-02remarks 538-char remark
-
2026-06-02$169,900 Active 1 DOM
ⓘ Source: listings_history table (triggers on properties + properties_extension) + one-shot
backfill from property_details.listing_events for pre-trigger history.
Tax reassessment forecast PA · Partial reset (capped growth)
- Current annual tax
- $2,256 · $188/mo
- Projected year-2 tax
- $2,470 · $206/mo
- Expected delta
- +$214/yr (+$18/mo · 9.5%)
ⓘ Screening estimate from a state-policy table — verify with the county assessor before closing.
Climate risk First Street
- Flood 4/10 Moderate FEMA zone X (unshaded) · 21% chance over 30 yrs
- Wildfire 1/10 Low
- Heat 2/10 Low 7 d/yr ≥90°F today · 15 d/yr by 30 yrs out
- Wind 1/10 Low
- Air quality 2/10 Low 1 unhealthy d/yr today · 3 by 30 yrs out
Nearby sold comps map
Loading sold comps map…
Walkable amenities ~0.75 mi
Loading nearby amenities…
Taxation est. · year 1
- Rental income
- $24,348
- − Mortgage interest
- −$9,517
- − Property taxes
- −$2,256
- − Insurance
- −$850
- − Repairs & maintenance
- −$1,948
- − Management
- −$1,948
- − Depreciation
- −$4,943
- Taxable income
- $2,887
- Est. tax owed @ 24.0%
- −$693
- After-tax cash flow
- $4,745/yr
For passive investors: Depreciation is non-cash, so a rental often shows a tax loss while cash-flowing — sheltering income. Rental losses are passive: they offset passive income freely, and up to $25,000/yr can offset ordinary (W-2) income if you actively participate and your MAGI is under $100k (phasing out to $0 by $150k); unused losses carry forward. On sale, claimed depreciation is recaptured at up to 25%, and gains may owe capital-gains tax (a 1031 exchange can defer both). Figures are a year-1 estimate at your 24.0% rate — not tax advice; consult a CPA.
Schools (NCES district)
- District
- Erie City SD
- NCES district ID
- 4209300
- Math proficiency
- 12% ▼ -11.00%
- Reading proficiency
- 19% ▼ -16.00%
- Median HH income
- $33,625
- Composite
- 12.59/100
- National rank
- #9617
- State rank
- #510 of 539 in PA
Livability — Erie
- Score
- 83/100
- State rank
- #109
- US rank
- #840
Category grades
Schools grade is shown separately in the Schools card above.
Census & demographics
- Census place
- Erie, PA
- County
- Erie County · 92,215 people
- City population
- 92,215
- Metro
- Erie, PA
- Population (ZIP)
- 15,995
- Household income
- $38,566
- Rent vs Own
- Severe rent burden
- 1044.0
Population outlook (Erie County) Hauer SSP2
- Today (2025)
- 272,159 people
- By 2030
- 266,299 · -2.2%
- By 2040
- 250,987 · -7.8%
- By 2050
- 234,925 · -13.7%
- By 2075
- 199,164 · -26.8%
- By 2100
- 162,985 · -40.1%
Race, ethnicity, and origin ACS 2023
- Neighborhood character
- Predominantly White (66%)
- Race & ethnicity
- White 66% Two or more races 16% Hispanic / Latino 13% Black 11% Asian 2%
- Hispanic origin (detail)
- Mexican 5% Puerto Rican 5%
- Common ancestry
- Romanian 7% Serbian 2% Italian 1%
- Foreign-born
- 5% · Canada
- Languages at home
- 89% English-only · Spanish 8% Other Indo-European 1% Russian/Polish/Slavic 1%
Political lean MEDSL · Erie
- 2024 margin
- Toss-up / Even · D 49.0% · R 50.0%
- 2008→2024 swing
- -20.9pp toward R · 2008: 19.9pp · 2024: -1.0pp
- All cycles
- 2024: R+1.0 2020: D+1.0 2016: R+2.0 2012: D+16.9 2008: D+19.9
Not yet ingested
- Civics
- —
Market trends
- HPI YoY
- ▼ -92.73%
- Current HPI
- 211.4408
- Rent YoY
- ▲ 2.97%
- Metro
- Erie, PA
- State GDP YoY
- ▲ 1.68%
- F500 in state
- 34
Industry mix (Fortune 500 HQ in PA)
| Industry | F500 HQs | Revenue |
|---|---|---|
| Healthcare | 2 | $309B |
|
||
| Insurance | 2 | $27B |
|
||
| Telecommunications / Media | 1 | $124B |
|
||
| Industrial Distribution | 1 | $22B |
|
||
| Financial Services | 1 | $20B |
|
||
| Chemicals / Materials | 1 | $18B |
|
||
Price history
+818.4% since first listed11 events — show timeline
- 2026-06-01 Listed $169,900 GEBOR
- 2025-09-17 Listed $169,900 GEBOR
- 2023-10-04 Sold (Public Records) $150,000 Public Records
- 2022-12-22 Sold (Public Records) $20,000 Public Records
- 2022-12-22 Sold (MLS) $20,000 GEBOR
- 2022-12-09 Pending — GEBOR
- 2022-11-28 Price Changed $33,900 GEBOR
- 2022-11-15 Price Changed $39,900 GEBOR
- 2022-11-09 Listed $50,500 GEBOR
- 1993-10-01 Sold (Public Records) $36,900 Public Records
- 1987-04-28 Sold (Public Records) $18,500 Public Records
Property tax history
+1.9%/yrLatest (2026): $2,256 · +3.4% YoY. Source: county tax records.
Cash-flow waterfall
monthlySold comps — $/sqft
last 12 mo · ≤1 miLoading sold comps…