534 Bluebird Dr Unit E. Venture Way Apt 18101 · Chubbuck, ID
Flood risk 1/10 · Minimal
- FEMA flood zone
- X (unshaded)
- Chance of flooding over 30 yrs
- 0.0%
- Est. flood insurance / yr
- $507 – $1,088
Fire risk 6/10 · Moderate
- Est. fire insurance / yr
- $584 – $1,086
Heat risk 3/10 · Minor
- Hot days now (above 93°F)
- 7 days/yr
- Hot days in 30 yrs
- 17 days/yr
Wind risk 1/10 · Minimal
- Chance of severe wind over 30 yrs
- —
Air-quality risk 5/10 · Moderate
- Unhealthy air days now
- 6 days/yr
- Unhealthy air days in 30 yrs
- 6 days/yr
Risk factors via First Street. Map © Google.
Why this score? — see what drove the B- grade
The composite is a weighted blend of 9 inputs, each scored 0–100. Each bar is that input's sub-score; the figure is the points it added to the 100-point composite (weight × sub-score).
- Cash flow +28.0/30.0
- DSCR +9.9/10.0
- 1% rule +7.7/10.0
- ARV discount +7.5/15.0
- Schools +4.3/10.0
- Livability +4.3/5.0
- Rent growth +3.3/5.0
- Condition / age +2.2/5.0
- Appreciation +0.0/10.0
$95,000
🖨 Deal sheet 📄 Offer letter ✓ Due diligence
Key facts
- Garage
- Built 1982
- Listed 12 days
Neighborhood map
What this means for you Summary
Snapshot
- This is a 1-bed/1.0-bath manufactured listed at $95k. Condition is rated fair.
Deal economics
- At list price, monthly cash flow is $294 ($4k/yr) — positive.
- The deal already cash-flows at list — no discount required.
- Meets the 1% rule at list price ($1k rent vs $95k).
Location & tenants
- Location reads 86/100 on livability (#4 in ID, #454 nationally) — a professional / high-income tenant draw. Strengths: commute A+, cost of living A+, housing A+; Watch: crime C-.
- Pocatello District (urban): math 45% / reading 58% proficiency, ranked #26 of 92 in ID (top 28%) — acceptable for families but not a draw, mixed tenant base, ~2y average lease.
- Zoned schools: Chubbuck Elementary School (math 61% / reading 64%, grade B, #53 of 357 statewide, top 15%, 495 students, 34% FRL); Franklin Middle School (math 48% / reading 69%, grade B, #11 of 109 statewide, top 9%, 742 students, 29% FRL); Pocatello High School (math 45% / reading 65%, grade C, #25 of 169 statewide, top 14%, 1,352 students, 28% FRL).
- Market conditions: Rents rising (+3.1%/yr); 212 active listings in the ZIP; 325 units permitted in Bannock County in 2024 (6 in 5+ unit buildings).
Forward outlook
- Local home prices are declining (-3.0%/yr); year-one equity from $657 of loan paydown is wiped out by about $3k of value loss. Plan a longer hold.
- At projected returns (-3.0% appreciation + 3.1% rent growth), your $27k cash investment doubles in ~9 years — after that, you're playing with house money.
Negotiation context
- Only 12 days on market — expect competitive offers; lowballing is unlikely to land.
Risks & watch-outs
- Climate carrying-cost: major wildfire risk — expect insurance premiums to compound above CPI over the hold.
Questions for the listing agent
- Have any recent inspections been done? Can we get a copy of the seller's disclosures and any deferred-maintenance estimates?
- Is there a deadline driving the sale (1031 exchange, divorce, estate, relocation)? That informs how much negotiation room exists.
- Schools are B-rated — typically a magnet for longer-tenancy family renters. What's the average tenant stay here, and is there a school-zone premium baked into asking?
- What's the average days-on-market for RENTAL listings here right now (not sales)? A rising rental-DOM trend means longer vacancies and softer asking-rent achievability than the comps imply.
- What's the recent tenant-quality profile in this submarket — average credit score on applications, eviction rate, late-payment / NSF rate, and stable-employment percentage? A property-management company in the area should have these aggregated.
- How much new for-sale + rental construction is in the pipeline within 1–3 miles? Heavy new supply typically softens prices + rents 12–24 months out; constrained supply supports both.
Investment metrics
- 1% rule
- 1.27% ✓
- Cap rate
- 10.01%
- Cash-on-cash
- 13.28%
- DSCR
- 1.59
- GRM
- 6.6
CMA / ARV
No comps found within radius.
Projected returns pro-forma
-3.0% appreciation · 3.14% rent growth · sell at horizon
- IRR
- 3.4%
- Equity multiple
- 1.13×
- Total profit
- $3,537
- Equity at exit
- $14,165
- IRR
- 13.1%
- Equity multiple
- 2.05×
- Total profit
- $27,988
- Equity at exit
- $8,214
Cash invested: $26,600 (down + closing). Projections, not guarantees.
Landlord ↔ Tenant lean methodology
- Overall (STATE)
- 91 Strongly Landlord-Friendly
- State Idaho
- 91 Strongly Landlord-Friendly · R+18
- County
- — inherits STATE
- City
- — inherits STATE
ZIP-level market 83202
- Rents YoY
- 3.1%
- Active inventory
- 212
- Price-to-rent
- 6.6×
Monthly cashflow live
- Estimated rent
- $1,204 medium interval (Pro) →
- Mortgage (P&I)
- −$498
- Tax est. 1.5%
- −$119 /mo · $1,425/yr
- Insurance
- −$40
- HOA
- −$0
- Vacancy / Maint / Mgmt
- −$253
- Net cashflow
- $294
Break-even live
UW: 25.0% down · 7.5% · 30yr · 1.5% tax · 5.0% vac · 8.0% maint · 8.0% mgmt
Financing live
Cash to close
- Down payment
- $23,750
- Closing costs
- $2,850
- Reserves months
- —
- Total cash needed
- —
Loan-product check · same deal, 3 products live
Conventional
25% down · 7.5% · 30yr
- Down + closing
- —
- Monthly P&I
- —
- Monthly cashflow
- —
- DSCR
- —
- Eligible?
- —
Personal DTI + credit; lowest rate.
DSCR
20% down · 8.5% · 30yr
- Down + closing
- —
- Monthly P&I
- —
- Monthly cashflow
- —
- DSCR
- —
- Eligible?
- —
No personal income docs; deal must DSCR.
Hard money
10% down · 12.0% · 12mo
- Down + closing
- —
- Monthly P&I
- —
- Monthly cashflow
- —
- DSCR
- —
- Eligible?
- —
Short-term bridge; refi at stabilization.
Listing history 2 events
-
2026-04-11status Pending
-
2026-03-30$95,000 Active
ⓘ Source: listings_history table (triggers on properties + properties_extension) + one-shot
backfill from property_details.listing_events for pre-trigger history.
Climate risk First Street
- Flood 1/10 Low FEMA zone X (unshaded) · 0% chance over 30 yrs
- Wildfire 6/10 Major
- Heat 3/10 Moderate 7 d/yr ≥93°F today · 17 d/yr by 30 yrs out
- Wind 1/10 Low
- Air quality 5/10 Major 6 unhealthy d/yr today · 6 by 30 yrs out
Nearby sold comps map
Loading sold comps map…
Walkable amenities ~0.75 mi
Loading nearby amenities…
Taxation est. · year 1
- Rental income
- $14,443
- − Mortgage interest
- −$5,321
- − Property taxes
- −$1,425
- − Insurance
- −$475
- − Repairs & maintenance
- −$1,155
- − Management
- −$1,155
- − Depreciation
- −$2,764
- Taxable income
- $2,147
- Est. tax owed @ 24.0%
- −$515
- After-tax cash flow
- $3,016/yr
For passive investors: Depreciation is non-cash, so a rental often shows a tax loss while cash-flowing — sheltering income. Rental losses are passive: they offset passive income freely, and up to $25,000/yr can offset ordinary (W-2) income if you actively participate and your MAGI is under $100k (phasing out to $0 by $150k); unused losses carry forward. On sale, claimed depreciation is recaptured at up to 25%, and gains may owe capital-gains tax (a 1031 exchange can defer both). Figures are a year-1 estimate at your 24.0% rate — not tax advice; consult a CPA.
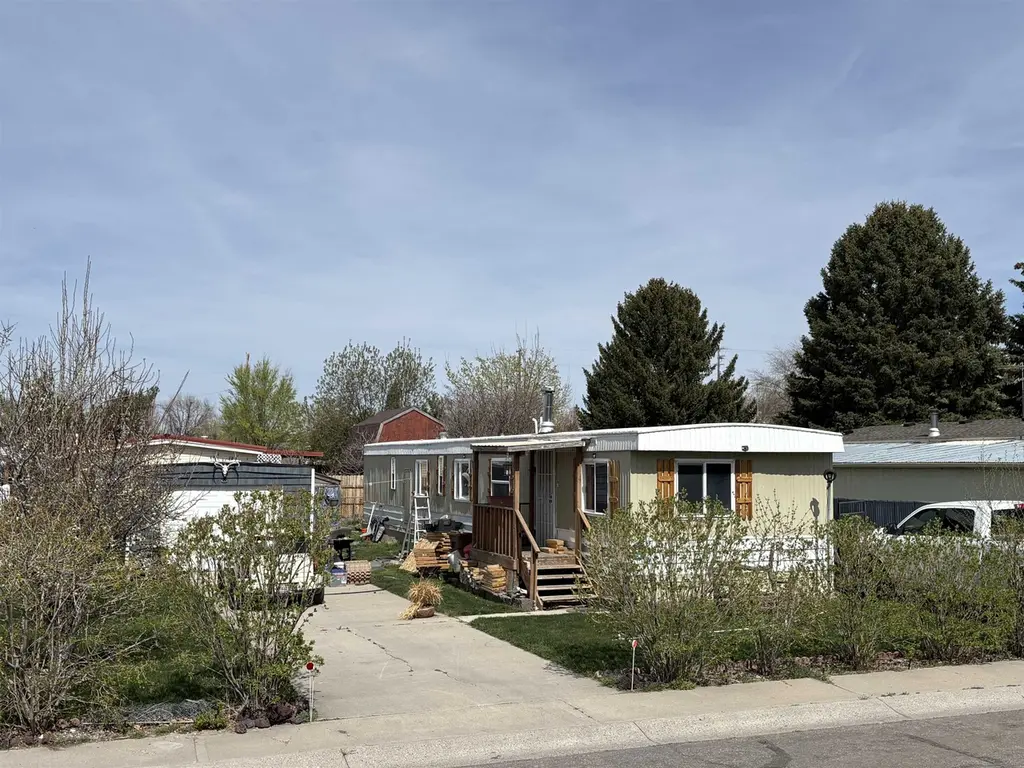
Condition & rehab AI · 13 photos
The home is in fair condition with minor repairs and maintenance needed. Painting and landscaping would significantly enhance its curb appeal and value.
Repairs flagged
- Minor Paint — Interior walls and exterior siding show some wear
- Minor Landscaping — Some overgrowth in landscaping
Value-add opportunities
- Both Paint exterior and interior — Fresh paint enhances curb appeal and interior aesthetics
- Both Landscaping — Well-maintained landscaping improves curb appeal and property value
Renovation cost estimate screening
| Repair item | Severity | Est. cost |
|---|---|---|
| Paint · Interior walls and exterior siding show some wear | Minor | $500–3,000 |
| Landscaping · Some overgrowth in landscaping | Minor | $500–3,000 |
| Total estimated repair cost · 2 items | $1,000–6,000 |
Value-add ROI direction
- Both Paint exterior and interior — Fresh paint enhances curb appeal and interior aesthetics ↑
- Both Landscaping — Well-maintained landscaping improves curb appeal and property value ↑
ⓘ Cost ranges are severity-bucket heuristics (US national rule-of-thumb). Get contractor quotes + a written scope before underwriting a rehab budget.
Schools (NCES district)
- District
- Pocatello District
- NCES district ID
- 1602640
- Math proficiency
- 45% ▼ -6.00%
- Reading proficiency
- 58% ▼ -1.00%
- Median HH income
- $44,478
- Composite
- 43.46/100
- National rank
- #3003
- State rank
- #26 of 92 in ID
Livability — Chubbuck
- Score
- 86/100
- State rank
- #4
- US rank
- #454
Category grades
Schools grade is shown separately in the Schools card above.
Census & demographics
- Census place
- Chubbuck, ID
- County
- Bannock County · 82,995 people
- City population
- 24,513
- Metro
- Pocatello, ID
- Population (ZIP)
- 24,513
- Household income
- $70,423
- Rent vs Own
- Severe rent burden
- 510.0
Population outlook (Bannock County) Hauer SSP2
- Today (2025)
- 86,173 people
- By 2030
- 86,575 · +0.5%
- By 2040
- 86,235 · +0.1%
- By 2050
- 86,090 · -0.1%
- By 2075
- 85,032 · -1.3%
- By 2100
- 85,103 · -1.2%
Race, ethnicity, and origin ACS 2023
- Neighborhood character
- Predominantly White (72%)
- Race & ethnicity
- White 72% Hispanic / Latino 13% Native American 9% Two or more races 6%
- Hispanic origin (detail)
- Mexican 12%
- Common ancestry
- Portuguese 3% Slovak 3% Italian 2%
- Foreign-born
- 2% · Canada
- Languages at home
- 92% English-only · Spanish 6%
Political lean MEDSL · Bannock
- 2024 margin
- Strong R (+25.1) · D 35.8% · R 60.9% · Other 3.3%
- 2008→2024 swing
- -12.1pp toward R · 2008: -13.0pp · 2024: -25.1pp
- All cycles
- 2024: R+25.1 2020: R+21.9 2016: R+20.5 2012: R+22.1 2008: R+13.0
Not yet ingested
- Civics
- —
Market trends
- HPI YoY
- ▼ -140.31%
- Current HPI
- 229.4622
- Rent YoY
- ▲ 3.14%
- Metro
- Pocatello, ID
- State GDP YoY
- ▲ 4.51%
- F500 in state
- 6
Industry mix (Fortune 500 HQ in ID)
| Industry | F500 HQs | Revenue |
|---|---|---|
| Retail | 1 | $79B |
|
||
| Technology | 1 | $25B |
|
||
| Food / Agriculture | 1 | $6B |
|
||
Price history
2 events — show timeline
- 2026-04-11 Pending — PCTMLS
- 2026-03-30 Listed $95,000 PCTMLS
Cash-flow waterfall
monthlySold comps — $/sqft
last 12 mo · ≤1 miLoading sold comps…