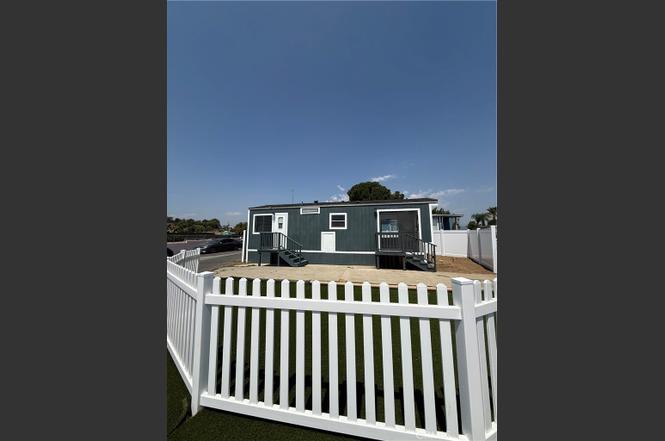
33848 Avenue G #29 · Yucaipa, CA
Flood risk 6/10 · Moderate
- FEMA flood zone
- X (shaded)
- Chance of flooding over 30 yrs
- 0.73%
- Est. flood insurance / yr
- $507 – $1,088
Fire risk 9/10 · Severe
- Est. fire insurance / yr
- $659 – $1,223
Heat risk 7/10 · Major
- Hot days now (above 100°F)
- 7 days/yr
- Hot days in 30 yrs
- 21 days/yr
Wind risk 1/10 · Minimal
- Chance of severe wind over 30 yrs
- —
Air-quality risk 10/10 · Severe
- Unhealthy air days now
- 30 days/yr
- Unhealthy air days in 30 yrs
- 37 days/yr
Risk factors via First Street. Map © Google.
Why this score? — see what drove the B grade
The composite is a weighted blend of 9 inputs, each scored 0–100. Each bar is that input's sub-score; the figure is the points it added to the 100-point composite (weight × sub-score).
- Cash flow +30.0/30.0
- 1% rule +10.0/10.0
- DSCR +10.0/10.0
- ARV discount +9.5/15.0
- Schools +3.8/10.0
- Condition / age +3.8/5.0
- Livability +3.3/5.0
- Rent growth +2.2/5.0
- Appreciation +0.0/10.0
$69,900
🖨 Deal sheet 📄 Offer letter ✓ Due diligence
Listing remarks
Beautiful and efficient home in the very well kept Las Casitas community. This cozy manufactured home offers a bright living area, functional kitchen, and comfortable bedroom, along with space for small outdoor seating or storage. This home offers thoughtful upgrades providing great comfort and value. With its low overall cost, this home can be a smarter alternative to renting, letting you build equity! Conveniently located near shopping, schools, and freeway access, it’s a great opportunity to step into homeownership at a hard to beat value. Schedule your showing today, this home won't last!
Key facts
- Functional kitchen
- Comfortable bedroom
- Bright living area
Tags
Property features AI
Finance
- Other: Manager approval required for residency
- HOA & community: Land lease required: $807 (land lease property)
Exterior
- Parking: Park parking (see park rules/management)
- Utilities: Public water; No sewer connection (Sewer or Septic - None listed)
- Home design: Single-story mobile home; Entry on the front side
- Construction: Mobile home approximately 12 ft by 35 ft; Year built reported by seller
- Exterior features: Community pool; Mountainous community setting; Located in a mobile home park (Las Casitas MHP)
Interior
- Bathrooms: 1 full bathroom
- Interior features: Front entrance; Single-level home
- Laundry & utility: No laundry on site
Neighborhood map
What this means for you Summary
Snapshot
- This is a 1-bed/1.0-bath manufactured listed at $70k. Condition is rated good.
Deal economics
- At list price, monthly cash flow is $638 ($8k/yr) — positive.
- The deal already cash-flows at list — no discount required.
- Meets the 1% rule at list price ($1k rent vs $70k).
- Cap rate 17.3% vs local median 2.7% in Yucaipa — top-decile yield for the area; either an underpriced asset or a hidden risk that comps aren't pricing in. Stress-test before assuming the spread holds.
Location & tenants
- Location reads 66/100 on livability (#334 in CA) — a middle-class / working-renter tenant base. Strengths: housing A+, employment B+; Watch: schools D, health & safety D, amenities F.
- Yucaipa-Calimesa Joint Unified (suburban): math 32% / reading 55% proficiency, ranked #195 of 517 in CA (top 38%) — families likely to look elsewhere, expect single-tenant / working-renter base with shorter leases.
- Market conditions: Rents soft (-1.3%/yr); 205 active listings in the ZIP; 1 comparable units currently listed for rent nearby; solid renter incomes; 5,458 units permitted in San Bernardino County in 2024 (1,500 in 5+ unit buildings).
Forward outlook
- Local home prices are declining (-3.0%/yr); year-one equity from $483 of loan paydown is wiped out by about $2k of value loss. Plan a longer hold.
- San Bernardino County population projected at +15% by 2050 — modest demand growth; plan on rents tracking national, not racing it.
- At projected returns (-3.0% appreciation + 0.0% rent growth), your $20k cash investment doubles in ~4 years — after that, you're playing with house money.
Negotiation context
- Only 8 days on market — expect competitive offers; lowballing is unlikely to land.
Risks & watch-outs
- Climate carrying-cost: major flood risk; severe wildfire risk; extreme-heat days projected 7→21/yr by 2055 (HVAC capex compounding) — expect insurance premiums to compound above CPI over the hold.
Questions for the listing agent
- Is there a deadline driving the sale (1031 exchange, divorce, estate, relocation)? That informs how much negotiation room exists.
- Schools are D-rated, which usually means shorter tenancies and higher turnover. Who's the typical renter profile here, and what's been the actual vacancy rate?
- What's the average days-on-market for RENTAL listings here right now (not sales)? A rising rental-DOM trend means longer vacancies and softer asking-rent achievability than the comps imply.
- What's the recent tenant-quality profile in this submarket — average credit score on applications, eviction rate, late-payment / NSF rate, and stable-employment percentage? A property-management company in the area should have these aggregated.
- How much new for-sale + rental construction is in the pipeline within 1–3 miles? Heavy new supply typically softens prices + rents 12–24 months out; constrained supply supports both.
Investment metrics
- 1% rule
- 2.03% ✓
- Cap rate
- 17.25%
- Cash-on-cash
- 39.14%
- DSCR
- 2.74
- GRM
- 4.1
CMA / ARV
- ARV (on-the-fly)
- $73,080
- Comps found
- 2
Show comp detail 2 sales within ~0.75 mi
| Address | Dist | Beds/Ba | Sqft | Sold | Price | $/sf | Match |
|---|---|---|---|---|---|---|---|
| 33848 Avenue G #51 | 0.05mi | 1/1.0 | 400 (-5%) | 13mo | $65,000 | $163 | 79 |
| 33848 Avenue G #14 | 0.00mi | 1/1.0 | 360 (-14%) | 3mo | $62,500 | $174 | 73 |
Match score weights: distance 35% · size 25% · config 20% · recency 20%. Top-matched comps best support the ARV.
Projected returns pro-forma
-3.0% appreciation · 0.0% rent growth · sell at horizon
- IRR
- 31.9%
- Equity multiple
- 2.29×
- Total profit
- $25,192
- Equity at exit
- $10,422
- IRR
- 37.3%
- Equity multiple
- 3.98×
- Total profit
- $58,300
- Equity at exit
- $6,044
Cash invested: $19,572 (down + closing). Projections, not guarantees.
Landlord ↔ Tenant lean methodology
- Overall (STATE)
- 18 Strongly Tenant-Friendly
- State California
- 18 Strongly Tenant-Friendly · D+13
- County
- — inherits STATE
- City
- — inherits STATE
ZIP-level market 92399
- Rents YoY
- -1.3%
- Active inventory
- 205
- Price-to-rent
- 4.1×
Monthly cashflow live
- Estimated rent
- $1,420 medium interval (Pro) →
- Mortgage (P&I)
- −$367
- Tax est. 1.5%
- −$87 /mo · $1,048/yr
- Insurance
- −$29
- HOA
- −$0
- Vacancy / Maint / Mgmt
- −$298
- Net cashflow
- $638
Break-even live
UW: 25.0% down · 7.5% · 30yr · 1.5% tax · 5.0% vac · 8.0% maint · 8.0% mgmt
Financing live
Cash to close
- Down payment
- $17,475
- Closing costs
- $2,097
- Reserves months
- —
- Total cash needed
- —
Loan-product check · same deal, 3 products live
Conventional
25% down · 7.5% · 30yr
- Down + closing
- —
- Monthly P&I
- —
- Monthly cashflow
- —
- DSCR
- —
- Eligible?
- —
Personal DTI + credit; lowest rate.
DSCR
20% down · 8.5% · 30yr
- Down + closing
- —
- Monthly P&I
- —
- Monthly cashflow
- —
- DSCR
- —
- Eligible?
- —
No personal income docs; deal must DSCR.
Hard money
10% down · 12.0% · 12mo
- Down + closing
- —
- Monthly P&I
- —
- Monthly cashflow
- —
- DSCR
- —
- Eligible?
- —
Short-term bridge; refi at stabilization.
Rent comps 1 comps
| Address | Beds | Baths | Sqft | Rent | $/sqft | DOM | Units | Dist |
|---|---|---|---|---|---|---|---|---|
| 12710 3rd St Unit 101 Yucaipa, CA | 1.0 | 1.0 | 336 | $1,375 | $4.09 | 4d | 1 | 1.20mi |
Listing history 8 events
-
2026-06-18days on market $69,900 Active 8 DOM
-
2026-06-17remarks 599-char remark
-
2026-06-17days on market $69,900 Active 7 DOM
-
2026-06-16days on market $69,900 Active 6 DOM
-
2026-06-15days on market $69,900 Active 5 DOM
-
2026-06-13days on market $69,900 Active 3 DOM
-
2026-06-13remarks 595-char remark
-
2026-06-13$69,900 Active 2 DOM
ⓘ Source: listings_history table (triggers on properties + properties_extension) + one-shot
backfill from property_details.listing_events for pre-trigger history.
Climate risk First Street
- Flood 6/10 Major FEMA zone X (shaded) · 73% chance over 30 yrs
- Wildfire 9/10 Extreme
- Heat 7/10 Severe 7 d/yr ≥100°F today · 21 d/yr by 30 yrs out
- Wind 1/10 Low
- Air quality 10/10 Extreme 30 unhealthy d/yr today · 37 by 30 yrs out
Nearby sold comps map
Loading sold comps map…
Walkable amenities ~0.75 mi
Loading nearby amenities…
Taxation est. · year 1
- Rental income
- $17,034
- − Mortgage interest
- −$3,915
- − Property taxes
- −$1,048
- − Insurance
- −$350
- − Repairs & maintenance
- −$1,363
- − Management
- −$1,363
- − Depreciation
- −$2,033
- Taxable income
- $6,962
- Est. tax owed @ 24.0%
- −$1,671
- After-tax cash flow
- $5,990/yr
For passive investors: Depreciation is non-cash, so a rental often shows a tax loss while cash-flowing — sheltering income. Rental losses are passive: they offset passive income freely, and up to $25,000/yr can offset ordinary (W-2) income if you actively participate and your MAGI is under $100k (phasing out to $0 by $150k); unused losses carry forward. On sale, claimed depreciation is recaptured at up to 25%, and gains may owe capital-gains tax (a 1031 exchange can defer both). Figures are a year-1 estimate at your 24.0% rate — not tax advice; consult a CPA.
Condition & rehab AI · 2 photos
This manufactured home in Yucaipa, CA is in good condition with cosmetic updates needed. It offers a bright living area and is located in a well-maintained community. Painting the exterior and improving landscaping would significantly increase its value.
Value-add opportunities
- Both Paint the exterior — Enhances curb appeal and property value
- Both Landscaping improvements — Enhances curb appeal and property value
Renovation cost estimate screening
Value-add ROI direction
- Both Paint the exterior — Enhances curb appeal and property value ↑
- Both Landscaping improvements — Enhances curb appeal and property value ↑
ⓘ Cost ranges are severity-bucket heuristics (US national rule-of-thumb). Get contractor quotes + a written scope before underwriting a rehab budget.
Schools (NCES district)
- District
- Yucaipa-Calimesa Joint Unified
- NCES district ID
- 0643560
- Math proficiency
- 32% ▼ -4.00%
- Reading proficiency
- 55% ▲ 6.00%
- Median HH income
- $58,243
- Composite
- 38.09/100
- National rank
- #4277
- State rank
- #195 of 517 in CA
Livability — Yucaipa
- Score
- 66/100
- State rank
- #334
- US rank
- #11542
Category grades
Schools grade is shown separately in the Schools card above.
Census & demographics
- Census place
- Yucaipa, CA
- County
- San Bernardino County · 2,030,291 people
- City population
- 55,366
- Metro
- Riverside-San Bernardino-Ontario, CA
- Population (ZIP)
- 55,366
- Household income
- $92,440
- Rent vs Own
- Severe rent burden
- 1110.0
Population outlook (San Bernardino County) Hauer SSP2
- Today (2025)
- 2,300,329 people
- By 2030
- 2,378,907 · +3.4%
- By 2040
- 2,523,137 · +9.7%
- By 2050
- 2,642,388 · +14.9%
- By 2075
- 2,880,769 · +25.2%
- By 2100
- 2,909,436 · +26.5%
Race, ethnicity, and origin ACS 2023
- Neighborhood character
- Diverse neighborhood (Simpson 0.57)
- Race & ethnicity
- White 55% Hispanic / Latino 36% Two or more races 15% Asian 3% Black 2%
- Hispanic origin (detail)
- Mexican 31%
- Common ancestry
- Italian 4% Iranian 2% Lithuanian 2%
- Foreign-born
- 10% · Canada
- Languages at home
- 77% English-only · Spanish 19% Other Indo-European 1% Other Asian/Pacific 1%
Political lean MEDSL · San Bernardino
- 2024 margin
- Toss-up / Even · D 47.5% · R 49.7% · Other 2.8%
- 2008→2024 swing
- -8.5pp toward R · 2008: 6.3pp · 2024: -2.1pp
- All cycles
- 2024: R+2.1 2020: D+10.7 2016: D+9.8 2012: D+5.4 2008: D+6.3
Not yet ingested
- Civics
- —
Market trends
- HPI YoY
- ▼ -632.71%
- Current HPI
- 353.4762
- Rent YoY
- ▼ -1.27%
- Metro
- Riverside-San Bernardino-Ontario, CA
- State GDP YoY
- ▲ 3.21%
- F500 in state
- 116
Industry mix (Fortune 500 HQ in CA)
| Industry | F500 HQs | Revenue |
|---|---|---|
| Technology | 27 | $1,492B |
|
||
| Financial Services | 3 | $174B |
|
||
| Retail | 3 | $44B |
|
||
| Insurance | 3 | $26B |
|
||
| Media / Entertainment | 2 | $115B |
|
||
| Pharmaceuticals / Biotech | 2 | $62B |
|
||
Price history
1 event — show timeline
- 2026-06-10 Listed $69,900 CRMLS
Cash-flow waterfall
monthlySold comps — $/sqft
last 12 mo · ≤1 miLoading sold comps…