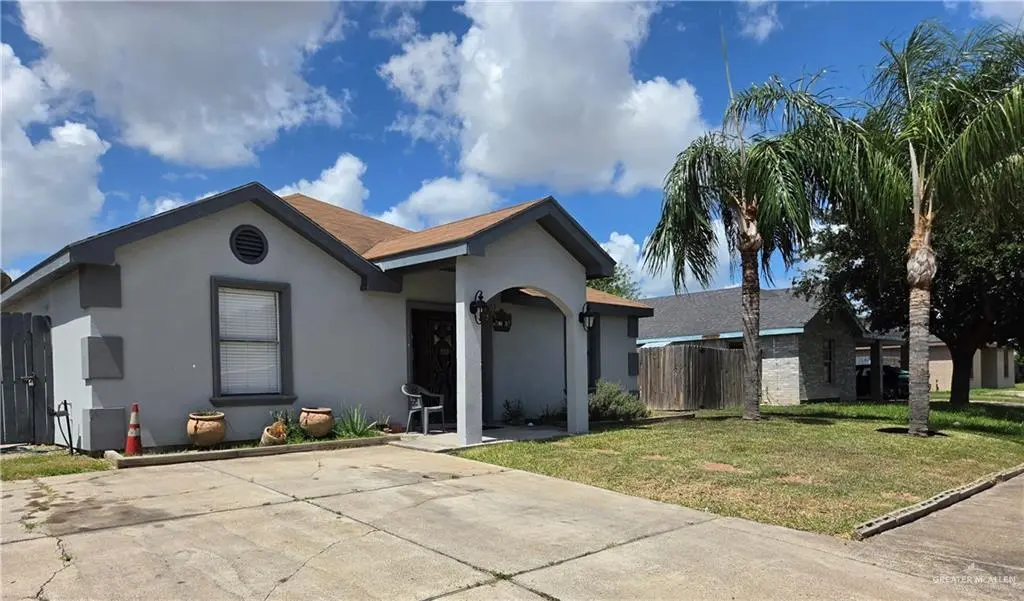
811 W Falcon Ave · Pharr, TX
Flood risk 1/10 · Minimal
- FEMA flood zone
- X (shaded)
- Chance of flooding over 30 yrs
- 0.0%
- Est. flood insurance / yr
- $507 – $1,088
Fire risk 7/10 · Major
- Est. fire insurance / yr
- $1,222 – $2,270
Heat risk 9/10 · Severe
- Hot days now (above 111°F)
- 7 days/yr
- Hot days in 30 yrs
- 22 days/yr
Wind risk 8/10 · Major
- Chance of severe wind over 30 yrs
- 99.0%
Air-quality risk 1/10 · Minimal
- Unhealthy air days now
- 0 days/yr
- Unhealthy air days in 30 yrs
- 0 days/yr
Risk factors via First Street. Map © Google.
Why this score? — see what drove the D- grade
The composite is a weighted blend of 9 inputs, each scored 0–100. Each bar is that input's sub-score; the figure is the points it added to the 100-point composite (weight × sub-score).
- ARV discount +15.0/15.0
- Cash flow +8.1/30.0
- 1% rule +4.2/10.0
- Livability +3.6/5.0
- Condition / age +2.5/5.0
- Rent growth +2.4/5.0
- DSCR +2.1/10.0
- Schools +2.0/10.0
- Appreciation +0.0/10.0
$158,000
🖨 Deal sheet 📄 Offer letter ✓ Due diligence
Listing remarks MLS
This well-kept 4 bedroom, 2 bathroom home won't last long! Located in Pharr, TX, this is the perfect opportunity for a first-time buyer to achieve the dream of homeownership. It could also be a great investment opportunity as a rental property. The home features well-sized bedrooms and a covered patio, great for entertaining. Schedule a private tour today!
Key facts
- Large concrete patio
- Side entrance
- Metal roof
Tags
Property features AI
Finance
- HOA & community: No association
Exterior
- Parking: 2 total parking spaces; 2 covered spaces; 2-car carport; Garage faces side
- Utilities: Public water; City sewer; Electric service
- Home design: Stucco exterior; Shingle roof; Slab foundation
- Construction: Stucco construction; Slab foundation; Shingle roof
- Exterior features: Mature trees; Covered patio; Patio slab; Wood fencing; Paved road access
Interior
- Kitchen: Electric water heater; No conveying appliances
- Bedrooms: Living area(s) includes bedroom-adjacent living space
- Flooring: Tile
- Bathrooms: 2 full bathrooms
- Heating & cooling: Central heating; Central air conditioning
- Interior features: Granite and solid surface countertops; Ceiling fan(s); No window coverings
- Laundry & utility: Laundry area
Neighborhood map
What this means for you Summary
Snapshot
- This is a 3-bed/1.0-bath single-family listed at $158k.
Deal economics
- At list price, monthly cash flow is $-157 ($-2k/yr) — negative.
- To cash-flow at today's rent, offer at most $130k (17.6% below list).
- To meet the 1% rule (rent ≥ 1% of price), the offer needs to be $145k (8.3% below list).
- Recommended offer: $130k (17.6% below list) — sets the bar for cash-flow.
- Cap rate 5.1% vs local median 3.4% in Pharr — top-decile yield for the area; either an underpriced asset or a hidden risk that comps aren't pricing in. Stress-test before assuming the spread holds.
Location & tenants
- Location reads 72/100 on livability (#245 in TX) — a middle-class / working-renter tenant base. Strengths: cost of living A+, housing A+, health & safety A+; Watch: amenities F, commute F, employment F.
- Pharr-San Juan-Alamo ISD (suburban): math 18% / reading 30% proficiency, ranked #740 of 826 in TX (top 90%) — low school quality limits family demand, transient renter base, plan for 1-2y turnover; 72% free/reduced lunch — lower-income household profile, screen leases tightly.
- Zoned schools: Graciela Garcia El (math 17% / reading 22%, grade F, #3,583 of 4,322 statewide, top 86%, 402 students, 93% FRL); Kennedy Middle (math 22% / reading 27%, grade F, #1,279 of 1,662 statewide, top 78%, 580 students, 94% FRL); Psja Southwest Early College H S (math 18% / reading 37%, grade F, #1,183 of 1,632 statewide, top 73%, 1,692 students, 98% FRL) — zoned schools average 95% FRL vs 72% district-wide (23 pts higher); higher-poverty schools than district average — tighter screening recommended.
- Market conditions: Rents soft (-0.2%/yr); 451 active listings in the ZIP; 5 comparable units currently listed for rent nearby; rentals at typical pace (median 14d on market — plan ~3-4 weeks tenant-placement turnaround); 7,378 units permitted in Hidalgo County in 2024 (641 in 5+ unit buildings).
- This rent runs 33% of the median local income ($53k/yr) — at the standard rent-burdened threshold; future hikes will face affordability resistance.
Forward outlook
- Local home prices are declining (-3.0%/yr); year-one equity from $1k of loan paydown is wiped out by about $5k of value loss. Plan a longer hold.
- Hidalgo County population projected at +28% by 2050 — long-run rental-demand tailwind backs the buy-and-hold thesis.
Negotiation context
- Only 6 days on market — expect competitive offers; lowballing is unlikely to land.
- 2 sale attempts since 5y ago with the ask held roughly flat each time — persistent listings suggest the price (not the market) is what's stuck; bring a comps-based counter.
Risks & watch-outs
- Watch-outs: property tax is 3.1% of price.
- Climate carrying-cost: severe wind risk, 99% chance of damaging wind over 30y; major wildfire risk; extreme-heat days projected 7→22/yr by 2055 (HVAC capex compounding) — expect insurance premiums to compound above CPI over the hold.
Questions for the listing agent
- What do current leases actually rent for vs. the listed asking? Can we see a recent rent roll and the last 12 months of T-12 income?
- Property tax is high relative to price — has the assessment been appealed recently, and will the sale trigger a re-assessment?
- Is there a deadline driving the sale (1031 exchange, divorce, estate, relocation)? That informs how much negotiation room exists.
- Schools are D-rated, which usually means shorter tenancies and higher turnover. Who's the typical renter profile here, and what's been the actual vacancy rate?
- The area grade is low — what's the realistic commute time and amenity access for the typical tenant pool here? Any planned neighborhood developments (good or bad) we should know about?
- What's the average days-on-market for RENTAL listings here right now (not sales)? A rising rental-DOM trend means longer vacancies and softer asking-rent achievability than the comps imply.
- What's the recent tenant-quality profile in this submarket — average credit score on applications, eviction rate, late-payment / NSF rate, and stable-employment percentage? A property-management company in the area should have these aggregated.
- How much new for-sale + rental construction is in the pipeline within 1–3 miles? Heavy new supply typically softens prices + rents 12–24 months out; constrained supply supports both.
Investment metrics
- 1% rule
- 0.92% ✗
- Cap rate
- 5.10%
- Cash-on-cash
- -4.26%
- DSCR
- 0.81
- GRM
- 9.1
CMA / ARV
- ARV (on-the-fly)
- $208,656
- Comps found
- 12
Show comp detail 12 sales within ~0.75 mi
| Address | Dist | Beds/Ba | Sqft | Sold | Price | $/sf | Match |
|---|---|---|---|---|---|---|---|
| 903 W La Quinta Ave | 0.16mi | 3/2.0 | 1,587 (-4%) | 3mo | $250,000 | $158 | 79 |
| 903 W Eagle Ave | 0.14mi | 3/2.5 | 1,607 (-3%) | 17mo | $220,000 | $137 | 69 |
| 711 W Dipper Ave | 0.17mi | 4/2.0 (+1) | 1,472 (-11%) | 6mo | $174,000 | $118 | 59 |
| 5605 South Tikal Ln | 0.40mi | 3/2.0 | 1,577 (-5%) | 13mo | $166,900 | $106 | 59 |
| 503 W Green Jay Ave | 0.37mi | 3/2.0 | 1,480 (-11%) | 6mo | $142,000 | $96 | 56 |
| 6706 Primavera St | 0.72mi | 3/2.0 | 1,588 (-4%) | 5mo | $195,000 | $123 | 51 |
| 509 W Starr Ave | 0.51mi | 4/2.5 (+1) | 1,500 (-9%) | 3mo | $189,000 | $126 | 47 |
| 409 W Flores St | 0.67mi | 3/2.0 | 1,500 (-9%) | 4mo | $145,000 | $97 | 45 |
| 6707 S Amarillo Ln | 0.61mi | 3/2.0 | 1,407 (-15%) | 3mo | $235,000 | $167 | 40 |
| 6703 S Amarillo Ln S | 0.59mi | 3/2.5 | 1,500 (-9%) | 12mo | $174,500 | $116 | 40 |
| 6706 S Azul Ln | 0.53mi | 3/2.0 | 1,439 (-13%) | 17mo | $219,000 | $152 | 36 |
| 1402 W Longoria St | 0.73mi | 3/2.0 | 1,464 (-12%) | 13mo | $215,000 | $147 | 32 |
Match score weights: distance 35% · size 25% · config 20% · recency 20%. Top-matched comps best support the ARV.
Projected returns pro-forma
-3.0% appreciation · 0.0% rent growth · sell at horizon
- IRR
- -27.6%
- Equity multiple
- 0.10×
- Total profit
- $-39,706
- Equity at exit
- $23,558
- IRR
- -47.1%
- Equity multiple
- -0.43×
- Total profit
- $-63,260
- Equity at exit
- $13,661
Cash invested: $44,240 (down + closing). Projections, not guarantees.
Landlord ↔ Tenant lean methodology
- Overall (STATE)
- 87 Strongly Landlord-Friendly
- State Texas
- 87 Strongly Landlord-Friendly · R+5
- County
- — inherits STATE
- City
- — inherits STATE
ZIP-level market 78577
- Home prices YoY
- -8.1%
- Rents YoY
- -0.2%
- Active inventory
- 451
- Price-to-rent
- 9.1×
Monthly cashflow live
- Estimated rent
- $1,449 high interval (Pro) →
- Mortgage (P&I)
- −$829
- Tax from tax record
- −$408 /mo · $4,891/yr
- Insurance
- −$66
- HOA
- −$0
- Vacancy / Maint / Mgmt
- −$304
- Net cashflow
- $-157
Break-even live
UW: 25.0% down · 7.5% · 30yr · 1.5% tax · 5.0% vac · 8.0% maint · 8.0% mgmt
Financing live
Cash to close
- Down payment
- $39,500
- Closing costs
- $4,740
- Reserves months
- —
- Total cash needed
- —
Loan-product check · same deal, 3 products live
Conventional
25% down · 7.5% · 30yr
- Down + closing
- —
- Monthly P&I
- —
- Monthly cashflow
- —
- DSCR
- —
- Eligible?
- —
Personal DTI + credit; lowest rate.
DSCR
20% down · 8.5% · 30yr
- Down + closing
- —
- Monthly P&I
- —
- Monthly cashflow
- —
- DSCR
- —
- Eligible?
- —
No personal income docs; deal must DSCR.
Hard money
10% down · 12.0% · 12mo
- Down + closing
- —
- Monthly P&I
- —
- Monthly cashflow
- —
- DSCR
- —
- Eligible?
- —
Short-term bridge; refi at stabilization.
Rent comps 5 comps
| Address | Beds | Baths | Sqft | Rent | $/sqft | DOM | Units | Dist |
|---|---|---|---|---|---|---|---|---|
| 6703 S Oro Ln Pharr, TX | 4.0 | 2.5 | 1786 | $1,700 | $0.95 | 14d | 1 | 0.51mi |
| 6707 S Rios St Pharr, TX | 2.0 | 2.0 | 1545 | $1,200 | $0.78 | 14d | 1 | 0.54mi |
| 719 Sherryl Ave Pharr, TX | 3.0 | 2.0 | 1524 | $1,500 | $0.98 | 14d | 1 | 1.09mi |
| 321 E Greg Dr Pharr, TX | 3.0 | 2.0 | 1368 | $1,500 | $1.10 | 44d | 1 | 1.29mi |
| 901 E Thomas Dr Pharr, TX | 3.0 | 2.0 | 1100 | $1,295 | $1.18 | 23d | 1 | 1.44mi |
Listing history 6 events
-
2026-06-18days on market $158,000 Active 6 DOM
-
2026-06-17days on market $158,000 Active 5 DOM
-
2026-06-16days on market $158,000 Active 4 DOM
-
2026-06-15days on market $158,000 Active 3 DOM
-
2026-06-13remarks 699-char remark
-
2026-06-13$158,000 Active 1 DOM
ⓘ Source: listings_history table (triggers on properties + properties_extension) + one-shot
backfill from property_details.listing_events for pre-trigger history.
Tax reassessment forecast TX · Resets to sale price
- Current annual tax
- $4,891 · $408/mo
- Projected year-2 tax
- $4,891 · $408/mo
- Expected delta
- $0/yr ($0/mo · 0.0%)
ⓘ Screening estimate from a state-policy table — verify with the county assessor before closing.
Climate risk First Street
- Flood 1/10 Low FEMA zone X (shaded) · 0% chance over 30 yrs
- Wildfire 7/10 Severe
- Heat 9/10 Extreme 7 d/yr ≥111°F today · 22 d/yr by 30 yrs out
- Wind 8/10 Severe 99% chance of damaging wind over 30 yrs
- Air quality 1/10 Low 0 unhealthy d/yr today · 0 by 30 yrs out
Nearby sold comps map
Loading sold comps map…
Walkable amenities ~0.75 mi
Loading nearby amenities…
Taxation est. · year 1
- Rental income
- $17,391
- − Mortgage interest
- −$8,850
- − Property taxes
- −$4,891
- − Insurance
- −$790
- − Repairs & maintenance
- −$1,391
- − Management
- −$1,391
- − Depreciation
- −$4,596
- Taxable loss
- −$4,520
- Est. tax savings @ 24.0%
- +$1,085
- After-tax cash flow
- $-801/yr
For passive investors: Depreciation is non-cash, so a rental often shows a tax loss while cash-flowing — sheltering income. Rental losses are passive: they offset passive income freely, and up to $25,000/yr can offset ordinary (W-2) income if you actively participate and your MAGI is under $100k (phasing out to $0 by $150k); unused losses carry forward. On sale, claimed depreciation is recaptured at up to 25%, and gains may owe capital-gains tax (a 1031 exchange can defer both). Figures are a year-1 estimate at your 24.0% rate — not tax advice; consult a CPA.
Schools (NCES district)
- District
- Pharr-San Juan-Alamo ISD
- NCES district ID
- 4834860
- Math proficiency
- 18% ▼ -34.00%
- Reading proficiency
- 30% ▼ -11.00%
- Median HH income
- $33,757
- Composite
- 19.63/100
- National rank
- #8744
- State rank
- #740 of 826 in TX
Livability — Pharr
- Score
- 72/100
- State rank
- #245
- US rank
- #5852
Category grades
Schools grade is shown separately in the Schools card above.
Census & demographics
- Census place
- Pharr, TX
- County
- Hidalgo County · 623,128 people
- City population
- 80,540
- Metro
- McAllen-Edinburg-Mission, TX
- Population (ZIP)
- 80,540
- Household income
- $52,770
- Rent vs Own
- Severe rent burden
- 2161.0
Population outlook (Hidalgo County) Hauer SSP2
- Today (2025)
- 955,232 people
- By 2030
- 1,009,774 · +5.7%
- By 2040
- 1,120,332 · +17.3%
- By 2050
- 1,225,036 · +28.2%
- By 2075
- 1,439,189 · +50.7%
- By 2100
- 1,533,429 · +60.5%
Race, ethnicity, and origin ACS 2023
- Neighborhood character
- Predominantly Hispanic (95%)
- Race & ethnicity
- Hispanic / Latino 95% Two or more races 45% White 5%
- Hispanic origin (detail)
- Mexican 92%
- Foreign-born
- 29% · Canada
- Languages at home
- 18% English-only · Spanish 81%
Political lean MEDSL · Hidalgo
- 2024 margin
- Toss-up / Even · D 48.1% · R 51.0%
- 2008→2024 swing
- -41.6pp toward R · 2008: 38.7pp · 2024: -2.9pp
- All cycles
- 2024: R+2.9 2020: D+17.1 2016: D+40.5 2012: D+41.8 2008: D+38.7
Not yet ingested
- Civics
- —
Market trends
- HPI YoY
- ▼ -23.00%
- Current HPI
- 261.1606
- Rent YoY
- ▼ -0.24%
- Metro
- McAllen-Edinburg-Mission, TX
- State GDP YoY
- ▲ 3.95%
- F500 in state
- 110
Industry mix (Fortune 500 HQ in TX)
| Industry | F500 HQs | Revenue |
|---|---|---|
| Energy | 16 | $1,198B |
|
||
| Technology | 5 | $198B |
|
||
| Engineering / Construction | 4 | $72B |
|
||
| Energy Services | 3 | $60B |
|
||
| Utilities | 3 | $41B |
|
||
| Healthcare | 2 | $330B |
|
||
Price history
+15.3% since first listed7 events — show timeline
- 2026-06-12 Listed $158,000 MCALLENMLS
- 2021-06-17 Sold (Public Records) — Public Records
- 2021-06-14 Sold (MLS) — MCALLENMLS
- 2021-05-27 Pending — MCALLENMLS
- 2021-05-10 Pending — MCALLENMLS
- 2021-04-29 Contingent — MCALLENMLS
- 2021-04-07 Listed $137,000 MCALLENMLS
Property tax history
+6.7%/yrLatest (2025): $4,891 · +1.5% YoY. Source: county tax records.
Cash-flow waterfall
monthlySold comps — $/sqft
last 12 mo · ≤1 miLoading sold comps…