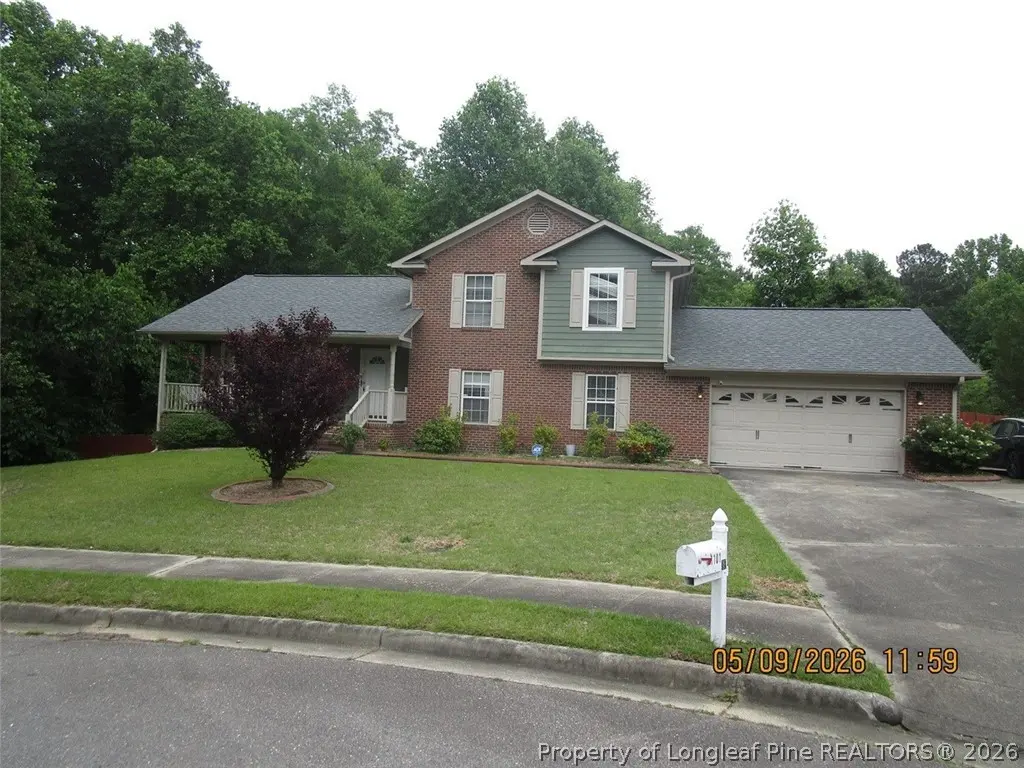
1101 Artemis Dr · Fayetteville, NC
Flood risk 1/10 · Minimal
- FEMA flood zone
- X (unshaded)
- Chance of flooding over 30 yrs
- 0.0%
- Est. flood insurance / yr
- $507 – $1,088
Fire risk 6/10 · Moderate
- Est. fire insurance / yr
- $906 – $1,684
Heat risk 7/10 · Major
- Hot days now (above 105°F)
- 7 days/yr
- Hot days in 30 yrs
- 16 days/yr
Wind risk 6/10 · Moderate
- Chance of severe wind over 30 yrs
- 69.0%
Air-quality risk 1/10 · Minimal
- Unhealthy air days now
- 0 days/yr
- Unhealthy air days in 30 yrs
- 0 days/yr
Risk factors via First Street. Map © Google.
Why this score? — see what drove the D+ grade
The composite is a weighted blend of 9 inputs, each scored 0–100. Each bar is that input's sub-score; the figure is the points it added to the 100-point composite (weight × sub-score).
- Cash flow +13.6/30.0
- ARV discount +11.7/15.0
- DSCR +4.1/10.0
- Livability +3.8/5.0
- 1% rule +3.2/10.0
- Rent growth +3.2/5.0
- Schools +3.1/10.0
- Condition / age +2.5/5.0
- Appreciation +0.0/10.0
$239,500
🖨 Deal sheet (PDF) 📄 Offer letter ✓ Due diligence
Listing remarks MLS
Great area! Convenient to Fort Bragg, Restaurants, New Highway 295, Schools and Churches! This 4 bedroom has over an acre settled at the end of a cul-de-sac featuring New Beautiful Laminate flooring in Living Room, Dining Room and entrance foyer and New Carpet. 2 Master Baths one with double vanities. Very desired neighborhood right off Andrews Road.
Key facts
- 2 garage spots
- Built 2002
- Listed 22 days
Property features AI
Finance
- HOA & community: Community sidewalks
Exterior
- Parking: Attached 2-car garage; Two covered parking spaces
- Utilities: Public water; Public sewer
- Home design: Single-family residence; Multi/split levels; Brick veneer construction; PND (Planned Neighborhood) zoning; Subdivision: KAMENBURY
- Construction: Brick veneer exterior
- Exterior features: Deck; Porch with front porch; Back yard fencing; Located on a cul-de-sac; Sidewalks in the community
Interior
- Kitchen: Dishwasher; Microwave; Range
- Flooring: Carpet; Tile; Other
- Bathrooms: Three full bathrooms
- Heating & cooling: Heat pump heating; Central electric air conditioning; Ceiling fans for additional cooling
- Interior features: Ceiling fans; Double vanity; Eat-in kitchen; Living room fireplace
- Laundry & utility: In-unit laundry with washer hookup; Crawl space basement
Neighborhood map
What this means for you Summary
Snapshot
- This is a 4-bed/4.0-bath single-family listed at $240k.
Deal economics
- At list price, monthly cash flow is $12 ($147/yr) — positive.
- The deal already cash-flows at list — no discount required.
- To meet the 1% rule (rent ≥ 1% of price), the offer needs to be $196k (18.0% below list).
- Recommended offer: $196k (18.0% below list) — sets the bar for 1% rule.
- Cap rate 6.4% vs local median 4.8% in Fayetteville — top-decile yield for the area; either an underpriced asset or a hidden risk that comps aren't pricing in. Stress-test before assuming the spread holds.
Location & tenants
- Location reads 75/100 on livability (#45 in NC, #4,031 nationally) — a middle-class / working-renter tenant base. Strengths: commute A+, cost of living A+, housing A+; Watch: crime F, employment D-.
- Cumberland County Schools (urban): math 32% / reading 41% proficiency, ranked #126 of 178 in NC (top 71%) — families likely to look elsewhere, expect single-tenant / working-renter base with shorter leases.
- Zoned schools: Howard L Hall Elementary (math 40% / reading 49%, grade F, #574 of 1,410 statewide, top 43%, 600 students, 100% FRL); Pine Forest Middle (math 38% / reading 49%, grade D, #182 of 475 statewide, top 40%, 738 students, 56% FRL); Pine Forest High (math 73% / reading 51%, grade B-, #184 of 535 statewide, top 37%, 1,572 students, 62% FRL) — zoned schools average 73% FRL vs 55% district-wide (18 pts higher); higher-poverty schools than district average — tighter screening recommended.
- Zoned-school proficiency averages 50% at this address vs 36% district-wide (+14 pts) — the actual schools serving this property are materially stronger than the Cumberland County Schools average implies; a family-tenant draw the district grade alone would hide.
- Market conditions: Rents rising (+2.8%/yr); 363 active listings in the ZIP; 9 comparable units currently listed for rent nearby; rentals at typical pace (median 26d on market — plan ~3-4 weeks tenant-placement turnaround); 1,125 units permitted in Cumberland County in 2024 (104 in 5+ unit buildings).
- This rent runs 38% of the median local income ($62k/yr) — at the standard rent-burdened threshold; future hikes will face affordability resistance.
Forward outlook
- Local home prices are declining (-3.0%/yr); year-one equity from $2k of loan paydown is wiped out by about $7k of value loss. Plan a longer hold.
Negotiation context
- It's been on market 22 days — a 2% lower offer ($236k) is reasonable based on typical stale-listing flexibility.
- 3 sale attempts since 6y ago with the ask held roughly flat each time — persistent listings suggest the price (not the market) is what's stuck; bring a comps-based counter.
- Current owner paid $189k; 27% above their basis — modest negotiation headroom, anchor on the comps not their cost.
Risks & watch-outs
- Climate carrying-cost: major wind risk, 69% chance of damaging wind over 30y; major wildfire risk; extreme-heat days projected 7→16/yr by 2055 (HVAC capex compounding) — expect insurance premiums to compound above CPI over the hold.
Questions for the listing agent
- Is there a deadline driving the sale (1031 exchange, divorce, estate, relocation)? That informs how much negotiation room exists.
- Crime grade is F in this area — have there been break-ins, vandalism, or insurance claims at this property in the last 3 years? What carrier currently insures it and at what premium?
- The area grade is low — what's the realistic commute time and amenity access for the typical tenant pool here? Any planned neighborhood developments (good or bad) we should know about?
- What's the average days-on-market for RENTAL listings here right now (not sales)? A rising rental-DOM trend means longer vacancies and softer asking-rent achievability than the comps imply.
- What's the recent tenant-quality profile in this submarket — average credit score on applications, eviction rate, late-payment / NSF rate, and stable-employment percentage? A property-management company in the area should have these aggregated.
- How much new for-sale + rental construction is in the pipeline within 1–3 miles? Heavy new supply typically softens prices + rents 12–24 months out; constrained supply supports both.
Investment metrics
- 1% rule
- 0.82% ✗
- Cap rate
- 6.35%
- Cash-on-cash
- 0.22%
- DSCR
- 1.01
- GRM
- 10.2
CMA / ARV
- ARV (on-the-fly)
- $263,836
- Comps found
- 12
Show comp detail 12 sales within ~0.75 mi
| Address | Dist | Beds/Ba | Sqft | Sold | Price | $/sf | Match |
|---|---|---|---|---|---|---|---|
| 1114 Reflex St | 0.06mi | 4/2.5 | 1,758 (-5%) | 10mo | $249,900 | $142 | 74 |
| 1216 Artemis Dr | 0.22mi | 4/2.5 | 1,960 (+6%) | 1mo | $275,000 | $140 | 74 |
| 1214 Andrews Rd | 0.27mi | 3/2.0 (-1) | 1,818 (-2%) | 8mo | $252,000 | $139 | 64 |
| 3401 Connection Dr | 0.25mi | 4/2.5 | 2,023 (+9%) | 6mo | $275,000 | $136 | 62 |
| 3507 Connection Dr | 0.17mi | 4/2.0 | 1,960 (+6%) | 18mo | $290,000 | $148 | 60 |
| 899 De Paul Dr | 0.51mi | 4/2.0 | 1,816 (-2%) | 13mo | $249,900 | $138 | 53 |
| 856 Ronald Reagan Dr | 0.37mi | 3/2.0 (-1) | 1,987 (+7%) | 6mo | $317,000 | $160 | 53 |
| 6601 Wofford Ct | 0.34mi | 3/2.0 (-1) | 1,638 (-12%) | 1mo | $170,000 | $104 | 50 |
| 940 Carnegie Dr | 0.27mi | 3/2.0 (-1) | 1,595 (-14%) | 3mo | $233,000 | $146 | 48 |
| 3416 Connection Dr | 0.20mi | 5/2.5 (+1) | 2,092 (+13%) | 13mo | $325,000 | $155 | 48 |
| 941 Kensington Park Rd | 0.43mi | 3/2.5 (-1) | 1,774 (-4%) | 17mo | $250,000 | $141 | 47 |
| 3505 Kennicot Ct | 0.40mi | 4/2.5 | 2,098 (+13%) | 12mo | $339,000 | $162 | 44 |
Match score weights: distance 35% · size 25% · config 20% · recency 20%. Top-matched comps best support the ARV.
Projected returns pro-forma
-3.0% appreciation · 2.82% rent growth · sell at horizon
- IRR
- -16.2%
- Equity multiple
- 0.43×
- Total profit
- $-38,424
- Equity at exit
- $35,710
- IRR
- -8.2%
- Equity multiple
- 0.49×
- Total profit
- $-34,072
- Equity at exit
- $20,708
Cash invested: $67,060 (down + closing). Projections, not guarantees.
Landlord ↔ Tenant lean methodology
- Overall (STATE)
- 85 Strongly Landlord-Friendly
- State North Carolina
- 85 Strongly Landlord-Friendly · R+3
- County
- — inherits STATE
- City
- — inherits STATE
ZIP-level market 28311
- Home prices YoY
- -18.4%
- Rents YoY
- 2.8%
- Active inventory
- 363
- Price-to-rent
- 10.2×
Monthly cashflow live
- Estimated rent
- $1,965 high interval (Pro) →
- Mortgage (P&I)
- −$1,256
- Tax from tax record
- −$184 /mo · $2,208/yr
- Insurance
- −$100
- HOA
- −$0
- Vacancy / Maint / Mgmt
- −$413
- Net cashflow
- $12
Break-even live
Sensitivity live
| Price | -10% $148 | -5% $80 | +0% $12 | +5% $-56 | +10% $-123 |
|---|---|---|---|---|---|
| Rent | -10% $-143 | -5% $-65 | +0% $12 | +5% $90 | +10% $167 |
| Rate | -1.0pp $133 | -0.5pp $73 | base $12 | +0.5pp $-50 | +1.0pp $-113 |
UW: 25.0% down · 7.5% · 30yr · 1.5% tax · 5.0% vac · 8.0% maint · 8.0% mgmt
Financing live
Cash to close
- Down payment
- $59,875
- Closing costs
- $7,185
- Reserves months
- —
- Total cash needed
- —
Loan-product check · same deal, 3 products live
Conventional
25% down · 7.5% · 30yr
- Down + closing
- —
- Monthly P&I
- —
- Monthly cashflow
- —
- DSCR
- —
- Eligible?
- —
Personal DTI + credit; lowest rate.
DSCR
20% down · 8.5% · 30yr
- Down + closing
- —
- Monthly P&I
- —
- Monthly cashflow
- —
- DSCR
- —
- Eligible?
- —
No personal income docs; deal must DSCR.
Hard money
10% down · 12.0% · 12mo
- Down + closing
- —
- Monthly P&I
- —
- Monthly cashflow
- —
- DSCR
- —
- Eligible?
- —
Short-term bridge; refi at stabilization.
Rent comps 9 comps
| Address | Beds | Baths | Sqft | Rent | $/sqft | DOM | Units | Dist |
|---|---|---|---|---|---|---|---|---|
| 3401 Connection Dr Fayetteville, NC | 4.0 | 2.5 | 2023 | $2,295 | $1.13 | 25d | 1 | 0.26mi |
| 1009 Louisburg Pl Fayetteville, NC | 3.0 | 2.0 | 1362 | $1,550 | $1.14 | 25d | 1 | 0.39mi |
| 1017 Xavier Ct Fayetteville, NC | 3.0 | 2.0 | 1401 | $1,595 | $1.14 | 25d | 1 | 0.42mi |
| 452 Clover Hill Pl Fayetteville, NC | 3.0 | 2.0 | 1701 | $1,700 | $1.00 | 15d | 1 | 0.85mi |
| 5327 Chesapeake Rd Fayetteville, NC | 3.0 | 2.0 | 1400 | $1,600 | $1.14 | 15d | 1 | 1.14mi |
| 515 Carteret Pl Fayetteville, NC | 3.0 | 2.0 | 1554 | $1,800 | $1.16 | 25d | 1 | 1.22mi |
| 3763 Glencourse Way Fayetteville, NC | 4.0 | 2.5 | 2200 | $2,250 | $1.02 | 25d | 1 | 1.27mi |
| 425 Dunblane Way Fayetteville, NC | 4.0 | 2.5 | 2100 | $1,975 | $0.94 | 25d | 1 | 1.27mi |
| 475 Albemarle Dr Fayetteville, NC | 3.0 | 2.0 | 1606 | $1,650 | $1.03 | 15d | 1 | 1.42mi |
Listing history 16 events
-
2026-06-21days on market $239,500 Active 22 DOM
-
2026-06-18days on market $239,500 Active 19 DOM
-
2026-06-17days on market $239,500 Active 18 DOM
-
2026-06-16days on market $239,500 Active 17 DOM
-
2026-06-15days on market $239,500 Active 16 DOM
-
2026-06-14days on market $239,500 Active 14 DOM
-
2026-06-13days on market $239,500 Active 13 DOM
-
2026-06-10days on market $239,500 Active 11 DOM
-
2026-06-09days on market $239,500 Active 10 DOM
-
2026-06-08days on market $239,500 Active 9 DOM
-
2026-06-07days on market $239,500 Active 8 DOM
-
2026-06-03days on market $239,500 Active 4 DOM
-
2026-06-02days on market $239,500 Active 3 DOM
-
2026-06-01days on market $239,500 Active 2 DOM
-
2026-05-31remarks 561-char remark
-
2026-05-31$239,500 Active 1 DOM
ⓘ Source: listings_history table (triggers on properties + properties_extension) + one-shot
backfill from property_details.listing_events for pre-trigger history.
Tax reassessment forecast NC · Resets to sale price
- Current annual tax
- $2,208 · $184/mo
- Projected year-2 tax
- $2,208 · $184/mo
- Expected delta
- $0/yr ($0/mo · 0.0%)
ⓘ Screening estimate from a state-policy table — verify with the county assessor before closing.
Climate risk First Street
- Flood 1/10 Low FEMA zone X (unshaded) · 0% chance over 30 yrs
- Wildfire 6/10 Major
- Heat 7/10 Severe 7 d/yr ≥105°F today · 16 d/yr by 30 yrs out
- Wind 6/10 Major 69% chance of damaging wind over 30 yrs
- Air quality 1/10 Low 0 unhealthy d/yr today · 0 by 30 yrs out
Nearby sold comps map
Loading sold comps map…
Walkable amenities ~0.75 mi
Loading nearby amenities…
Taxation est. · year 1
- Rental income
- $23,575
- − Mortgage interest
- −$13,416
- − Property taxes
- −$2,208
- − Insurance
- −$1,198
- − Repairs & maintenance
- −$1,886
- − Management
- −$1,886
- − Depreciation
- −$6,967
- Taxable loss
- −$3,985
- Est. tax savings @ 24.0%
- +$956
- After-tax cash flow
- $1,104/yr
For passive investors: Depreciation is non-cash, so a rental often shows a tax loss while cash-flowing — sheltering income. Rental losses are passive: they offset passive income freely, and up to $25,000/yr can offset ordinary (W-2) income if you actively participate and your MAGI is under $100k (phasing out to $0 by $150k); unused losses carry forward. On sale, claimed depreciation is recaptured at up to 25%, and gains may owe capital-gains tax (a 1031 exchange can defer both). Figures are a year-1 estimate at your 24.0% rate — not tax advice; consult a CPA.
Schools (NCES district)
- District
- Cumberland County Schools
- NCES district ID
- 3700011
- Math proficiency
- 32% ▼ -2.00%
- Reading proficiency
- 41% ▼ -1.00%
- Median HH income
- $44,168
- Composite
- 31.0/100
- National rank
- #6096
- State rank
- #126 of 178 in NC
Livability — Fayetteville
- Score
- 75/100
- State rank
- #45
- US rank
- #4031
Category grades
Schools grade is shown separately in the Schools card above.
Census & demographics
- County
- Cumberland County · 265,314 people
- City population
- 226,118
- Metro
- Fayetteville, NC
- Population (ZIP)
- 36,629
- Household income
- $62,170
- Rent vs Own
- Severe rent burden
- 1645.0
Population outlook (Cumberland County) Hauer SSP2
- Today (2025)
- 330,855 people
- By 2030
- 333,523 · +0.8%
- By 2040
- 335,583 · +1.4%
- By 2050
- 335,325 · +1.4%
- By 2075
- 342,853 · +3.6%
- By 2100
- 340,698 · +3.0%
Race, ethnicity, and origin ACS 2023
- Neighborhood character
- Diverse neighborhood (Simpson 0.67)
- Race & ethnicity
- Black 42% White 38% Hispanic / Latino 9% Two or more races 8% Asian 3% Native American 1%
- Hispanic origin (detail)
- Mexican 3% Puerto Rican 4%
- Common ancestry
- Slovak 1% Lithuanian 1% Italian 1%
- Foreign-born
- 7% · Canada, South Korea, Jamaica
- Languages at home
- 89% English-only · Spanish 6% German/W. Germanic 1% Other Indo-European 1%
Political lean MEDSL · Cumberland
- 2024 margin
- D (+13.4) · D 56.1% · R 42.7% · Other 1.2%
- 2008→2024 swing
- -4.3pp toward R · 2008: 17.7pp · 2024: 13.4pp
- All cycles
- 2024: D+13.4 2020: D+16.6 2016: D+16.0 2012: D+19.7 2008: D+17.7
Not yet ingested
- Civics
- —
Market trends
- HPI YoY
- ▼ -45.88%
- Current HPI
- 203.0731
- Rent YoY
- ▲ 2.82%
- Metro
- Fayetteville, NC
- State GDP YoY
- ▲ 3.28%
- F500 in state
- 26
Industry mix (Fortune 500 HQ in NC)
| Industry | F500 HQs | Revenue |
|---|---|---|
| Financial Services | 2 | $213B |
|
||
| Retail | 2 | $95B |
|
||
| Industrial Conglomerate | 1 | $38B |
|
||
| Metals / Steel | 1 | $35B |
|
||
| Utilities | 1 | $30B |
|
||
| Industrial Machinery | 1 | $19B |
|
||
Price history
+25.0% since first listed6 events — show timeline
- 2026-05-30 Listed $239,500 LPRMLS
- 2020-07-07 Sold (Public Records) $189,000 Public Records
- 2020-07-07 Sold (MLS) $189,000 LPRMLS
- 2020-07-07 Sold (MLS) $189,000 TMLS
- 2020-01-11 Listed $191,650 LPRMLS
- 2020-01-11 Listed $191,650 TMLS
Property tax history
+2.0%/yrLatest (2025): $2,208 · +21.2% YoY. Source: county tax records.
Cash-flow waterfall
monthlySold comps — $/sqft
last 12 mo · ≤1 miLoading sold comps…