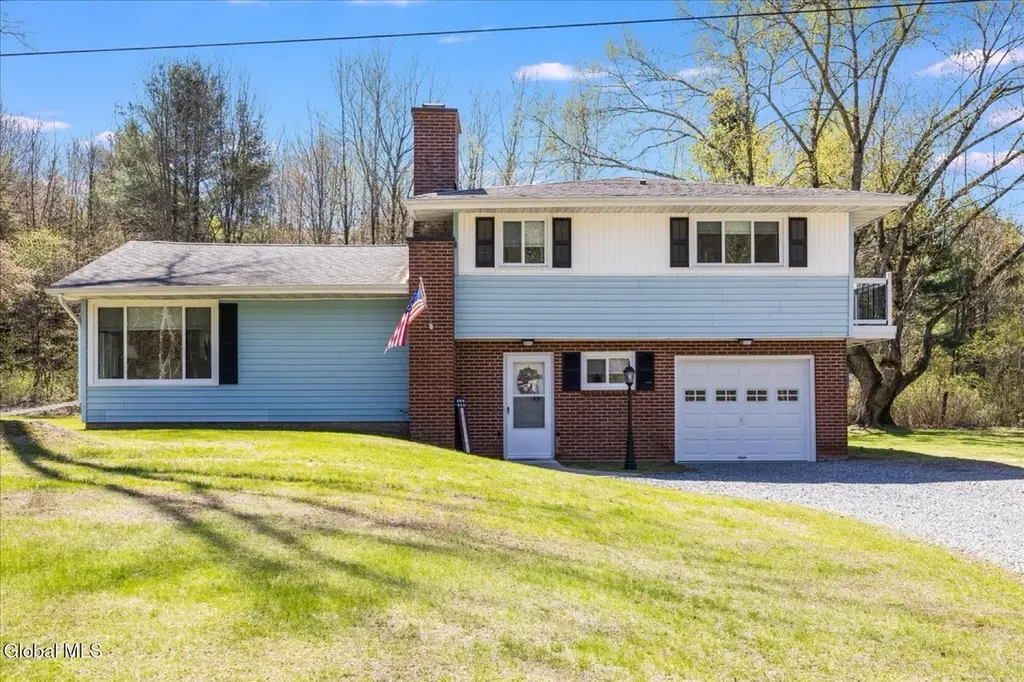
20 Clark Rd · West Glens Falls, NY
Flood risk 1/10 · Minimal
- FEMA flood zone
- X
- Chance of flooding over 30 yrs
- 0.0%
- Est. flood insurance / yr
- $473 – $860
Fire risk 3/10 · Minor
- Est. fire insurance / yr
- $691 – $1,283
Heat risk 3/10 · Minor
- Hot days now (above 97°F)
- 7 days/yr
- Hot days in 30 yrs
- 16 days/yr
Wind risk 2/10 · Minimal
- Chance of severe wind over 30 yrs
- 4.0%
Air-quality risk 1/10 · Minimal
- Unhealthy air days now
- 0 days/yr
- Unhealthy air days in 30 yrs
- 0 days/yr
Risk factors via First Street. Map © Google.
Why this score? — see what drove the D grade
The composite is a weighted blend of 9 inputs, each scored 0–100. Each bar is that input's sub-score; the figure is the points it added to the 100-point composite (weight × sub-score).
- Cash flow +11.7/30.0
- ARV discount +10.9/15.0
- Schools +4.7/10.0
- Livability +3.6/5.0
- DSCR +3.4/10.0
- 1% rule +3.0/10.0
- Rent growth +2.5/5.0
- Condition / age +2.5/5.0
- Appreciation +0.0/10.0
$359,900
🖨 Deal sheet (PDF) 📄 Offer letter ✓ Due diligence
Listing remarks
You won't want to miss this beautifully maintained and thoughtfully updated split-level home on Clark Road! Offering 1,788 sq. ft. , three bedrooms, and one and a half bathrooms, this home has been meticulously cared for and is truly move-in ready. The heart of the home is the spacious, sun-drenched kitchen-featuring abundant cabinetry, stainless steel appliances, generous counter space, and plenty of room for gathering. Natural light pours in, creating a warm and inviting atmosphere that flows seamlessly into the main living areas. The cozy living room is anchored by a stunning corner fireplace, adding charm and comfort year-round. Step outside and enjoy the home's outdoor living spaces, i
Key facts
- Large back deck
- Split-level home
- Private setting
Tags
Property features AI
Exterior
- Parking: Attached garage (1 garage space); Driveway parking, total of 6 parking spaces
- Utilities: Septic tank
- Home design: Single family residence; Updated/remodeled condition
- Construction: Brick and vinyl siding exterior; Block foundation; Asphalt roof; Built/finished living area approximately 1,788
- Exterior features: Deck; Private, landscaped lot
Interior
- Kitchen: Dishwasher; Gas oven; Microwave; Refrigerator
- Bedrooms: Primary bedroom on the second floor; Additional bedrooms on the second floor
- Flooring: Ceramic tile; Laminate
- Bathrooms: One full bathroom on the second floor; One half bathroom on the first floor
- Heating & cooling: Forced air heating (propane); Central air conditioning
- Interior features: 9 total rooms; Updated/remodeled interior; Double pane windows; Wood-burning fireplace in the living room
- Laundry & utility: Washer and dryer; Laundry located in the basement (common area)
Neighborhood map
What this means for you Summary
Snapshot
- This is a 3-bed/1.5-bath single-family listed at $360k.
Deal economics
- At list price, monthly cash flow is $-107 ($-1k/yr) — negative.
- To cash-flow at today's rent, offer at most $341k (5.2% below list).
- To meet the 1% rule (rent ≥ 1% of price), the offer needs to be $287k (20.2% below list).
- Recommended offer: $287k (20.2% below list) — sets the bar for 1% rule.
- Cap rate 5.9% vs local median 2.4% in West Glens Falls — top-decile yield for the area; either an underpriced asset or a hidden risk that comps aren't pricing in. Stress-test before assuming the spread holds.
Location & tenants
- Location reads 71/100 on livability (#388 in NY) — a middle-class / working-renter tenant base. Strengths: employment A+, housing A+, health & safety A+; Watch: crime C-, cost of living C-, amenities F.
- South Glens Falls Central School District (suburban): math 49% / reading 59% proficiency, ranked #307 of 590 in NY (top 52%) — acceptable for families but not a draw, mixed tenant base, ~2y average lease.
- Zoned schools: Ballard Elementary School (math 52% / reading 52%, grade C-, #988 of 2,108 statewide, top 49%, 309 students, 32% FRL); Oliver W Winch Middle School (math 32% / reading 50%, grade F, #402 of 729 statewide, top 56%, 668 students, 37% FRL); South Glens Falls Senior High School (math 92% / reading 91%, grade A+, #197 of 1,100 statewide, top 18%, 908 students, 36% FRL).
- Market conditions: 115 active listings in the ZIP; solid renter incomes; 1,132 units permitted in Saratoga County in 2024 (378 in 5+ unit buildings).
- This rent runs 34% of the median local income ($100k/yr) — at the standard rent-burdened threshold; future hikes will face affordability resistance.
Forward outlook
- Local home prices are declining (-3.0%/yr); year-one equity from $2k of loan paydown is wiped out by about $11k of value loss. Plan a longer hold.
- Saratoga County population projected at +4% by 2050 — modest demand growth; plan on rents tracking national, not racing it.
Negotiation context
- Only 2 days on market — expect competitive offers; lowballing is unlikely to land.
- 4 sale attempts since 24y ago with the ask held roughly flat each time — persistent listings suggest the price (not the market) is what's stuck; bring a comps-based counter.
Questions for the listing agent
- What do current leases actually rent for vs. the listed asking? Can we see a recent rent roll and the last 12 months of T-12 income?
- Built in 1962 — when were the roof, HVAC, electrical panel, plumbing, and water heater last replaced?
- Is there a deadline driving the sale (1031 exchange, divorce, estate, relocation)? That informs how much negotiation room exists.
- Schools are F-rated, which usually means shorter tenancies and higher turnover. Who's the typical renter profile here, and what's been the actual vacancy rate?
- The area grade is low — what's the realistic commute time and amenity access for the typical tenant pool here? Any planned neighborhood developments (good or bad) we should know about?
- What's the average days-on-market for RENTAL listings here right now (not sales)? A rising rental-DOM trend means longer vacancies and softer asking-rent achievability than the comps imply.
- What's the recent tenant-quality profile in this submarket — average credit score on applications, eviction rate, late-payment / NSF rate, and stable-employment percentage? A property-management company in the area should have these aggregated.
- How much new for-sale + rental construction is in the pipeline within 1–3 miles? Heavy new supply typically softens prices + rents 12–24 months out; constrained supply supports both.
Investment metrics
- 1% rule
- 0.80% ✗
- Cap rate
- 5.94%
- Cash-on-cash
- -1.27%
- DSCR
- 0.94
- GRM
- 10.4
CMA / ARV
- ARV (median comp)
- $389,307
- List price
- $359,900
- Delta
- -7.55%
- Verdict
- FAIR
- Comps
- 7 within 1.0 mi
Show comp detail 1 sale within ~0.75 mi
| Address | Dist | Beds/Ba | Sqft | Sold | Price | $/sf | Match |
|---|---|---|---|---|---|---|---|
| 20 Clark Rd | 0.00mi | 3/1.5 | 1,788 (0%) | 0mo | $389,000 | $218 | 100 |
Match score weights: distance 35% · size 25% · config 20% · recency 20%. Top-matched comps best support the ARV.
Projected returns pro-forma
-3.0% appreciation · 3.0% rent growth · sell at horizon
- IRR
- -18.4%
- Equity multiple
- 0.35×
- Total profit
- $-65,154
- Equity at exit
- $53,662
- IRR
- -10.8%
- Equity multiple
- 0.35×
- Total profit
- $-65,607
- Equity at exit
- $31,118
Cash invested: $100,772 (down + closing). Projections, not guarantees.
Landlord ↔ Tenant lean methodology
- Overall (STATE)
- 15 Strongly Tenant-Friendly
- State New York
- 15 Strongly Tenant-Friendly · D+10
- County
- — inherits STATE
- City
- — inherits STATE
ZIP-level market 12831
- Home prices YoY
- -12.8%
- Active inventory
- 115
- Price-to-rent
- 10.4×
Monthly cashflow live
- Estimated rent
- $2,871 medium interval (Pro) →
- Mortgage (P&I)
- −$1,887
- Tax from tax record
- −$338 /mo · $4,055/yr
- Insurance
- −$150
- HOA
- −$0
- Vacancy / Maint / Mgmt
- −$603
- Net cashflow
- $-107
Break-even live
Sensitivity live
| Price | -10% $97 | -5% $-5 | +0% $-107 | +5% $-209 | +10% $-311 |
|---|---|---|---|---|---|
| Rent | -10% $-334 | -5% $-220 | +0% $-107 | +5% $7 | +10% $120 |
| Rate | -1.0pp $74 | -0.5pp $-15 | base $-107 | +0.5pp $-200 | +1.0pp $-295 |
UW: 25.0% down · 7.5% · 30yr · 1.5% tax · 5.0% vac · 8.0% maint · 8.0% mgmt
Financing live
Cash to close
- Down payment
- $89,975
- Closing costs
- $10,797
- Reserves months
- —
- Total cash needed
- —
Loan-product check · same deal, 3 products live
Conventional
25% down · 7.5% · 30yr
- Down + closing
- —
- Monthly P&I
- —
- Monthly cashflow
- —
- DSCR
- —
- Eligible?
- —
Personal DTI + credit; lowest rate.
DSCR
20% down · 8.5% · 30yr
- Down + closing
- —
- Monthly P&I
- —
- Monthly cashflow
- —
- DSCR
- —
- Eligible?
- —
No personal income docs; deal must DSCR.
Hard money
10% down · 12.0% · 12mo
- Down + closing
- —
- Monthly P&I
- —
- Monthly cashflow
- —
- DSCR
- —
- Eligible?
- —
Short-term bridge; refi at stabilization.
Listing history 10 events
-
2026-05-03status Pending 1360-char remark
-
2026-05-01$359,900 Active 1360-char remark
-
2019-03-01historical
-
2014-06-02historical
-
2013-06-06$185,900
-
2013-06-06$185,900
-
2002-07-19soldstatus $135,000
-
2002-07-09soldstatus $135,000
-
2002-06-11historical
-
2002-05-23$139,333
ⓘ Source: listings_history table (triggers on properties + properties_extension) + one-shot
backfill from property_details.listing_events for pre-trigger history.
Tax reassessment forecast NY · Partial reset (capped growth)
- Current annual tax
- $4,055 · $338/mo
- Projected year-2 tax
- $5,069 · $422/mo
- Expected delta
- +$1,014/yr (+$84/mo · 25.0%)
ⓘ Screening estimate from a state-policy table — verify with the county assessor before closing.
Climate risk First Street
- Flood 1/10 Low FEMA zone X · 0% chance over 30 yrs
- Wildfire 3/10 Moderate
- Heat 3/10 Moderate 7 d/yr ≥97°F today · 16 d/yr by 30 yrs out
- Wind 2/10 Low 4% chance of damaging wind over 30 yrs
- Air quality 1/10 Low 0 unhealthy d/yr today · 0 by 30 yrs out
Nearby sold comps map
Loading sold comps map…
Walkable amenities ~0.75 mi
Loading nearby amenities…
Taxation est. · year 1
- Rental income
- $34,455
- − Mortgage interest
- −$20,160
- − Property taxes
- −$4,055
- − Insurance
- −$1,800
- − Repairs & maintenance
- −$2,756
- − Management
- −$2,756
- − Depreciation
- −$10,470
- Taxable loss
- −$7,542
- Est. tax savings @ 24.0%
- +$1,810
- After-tax cash flow
- $527/yr
For passive investors: Depreciation is non-cash, so a rental often shows a tax loss while cash-flowing — sheltering income. Rental losses are passive: they offset passive income freely, and up to $25,000/yr can offset ordinary (W-2) income if you actively participate and your MAGI is under $100k (phasing out to $0 by $150k); unused losses carry forward. On sale, claimed depreciation is recaptured at up to 25%, and gains may owe capital-gains tax (a 1031 exchange can defer both). Figures are a year-1 estimate at your 24.0% rate — not tax advice; consult a CPA.
Schools (NCES district)
- District
- South Glens Falls Central School District
- NCES district ID
- 3627240
- Math proficiency
- 49% ▼ -9.00%
- Reading proficiency
- 59% ▲ 12.00%
- Median HH income
- $59,015
- Composite
- 46.93/100
- National rank
- #2363
- State rank
- #307 of 590 in NY
Livability — West Glens Falls
- Score
- 71/100
- State rank
- #388
- US rank
- #6663
Category grades
Schools grade is shown separately in the Schools card above.
Census & demographics
- County
- Saratoga County · 166,192 people
- Metro
- Albany-Schenectady-Troy, NY
- Population (ZIP)
- 18,025
- Household income
- $100,024
- Rent vs Own
- Severe rent burden
- 497.0
Population outlook (Saratoga County) Hauer SSP2
- Today (2025)
- 238,889 people
- By 2030
- 243,681 · +2.0%
- By 2040
- 249,118 · +4.3%
- By 2050
- 248,638 · +4.1%
- By 2075
- 241,675 · +1.2%
- By 2100
- 213,150 · -10.8%
Race, ethnicity, and origin ACS 2023
- Neighborhood character
- Predominantly White (92%)
- Race & ethnicity
- White 92% Hispanic / Latino 3% Two or more races 3% Asian 1%
- Common ancestry
- Lithuanian 11% Romanian 4% Iranian 2%
- Foreign-born
- 3% · Canada
- Languages at home
- 95% English-only · Spanish 2% Russian/Polish/Slavic 1% Other Indo-European 1%
Political lean MEDSL · Saratoga
- 2024 margin
- Toss-up / Even · D 50.9% · R 49.1%
- 2008→2024 swing
- -1.6pp toward R · 2008: 3.4pp · 2024: 1.8pp
- All cycles
- 2024: D+1.8 2020: D+5.4 2016: R+4.4 2012: D+2.1 2008: D+3.4
Not yet ingested
- Civics
- —
Market trends
- HPI YoY
- ▼ -51.79%
- Current HPI
- 351.6972
- Rent YoY
- —
- Metro
- Albany-Schenectady-Troy, NY
- State GDP YoY
- ▲ 2.60%
- F500 in state
- 92
Industry mix (Fortune 500 HQ in NY)
| Industry | F500 HQs | Revenue |
|---|---|---|
| Financial Services | 10 | $950B |
|
||
| Consumer Goods | 9 | $162B |
|
||
| Insurance | 4 | $225B |
|
||
| Telecommunications | 2 | $144B |
|
||
| Pharmaceuticals | 2 | $112B |
|
||
| Media / Entertainment | 2 | $69B |
|
||
Price history
+179.2% since first listed11 events — show timeline
- 2026-06-17 Sold (MLS) $389,000 Global MLS
- 2026-05-03 Pending — Global MLS
- 2026-05-01 Listed $359,900 Global MLS
- 2019-03-01 Listing Removed — Global MLS
- 2014-06-02 Listing Removed — Global MLS
- 2013-06-06 Listed $185,900 Global MLS
- 2013-06-06 Listed $185,900 Global MLS
- 2002-07-19 Sold (Public Records) $135,000 Public Records
- 2002-07-09 Sold (MLS) $135,000 Global MLS
- 2002-06-11 Listing Removed — Global MLS
- 2002-05-23 Listed $139,333 Global MLS
Property tax history
+5.4%/yrLatest (2025): $4,055 · +1.1% YoY. Source: county tax records.
Cash-flow waterfall
monthlySold comps — $/sqft
last 12 mo · ≤1 miLoading sold comps…