 🏷️ Likely Rental
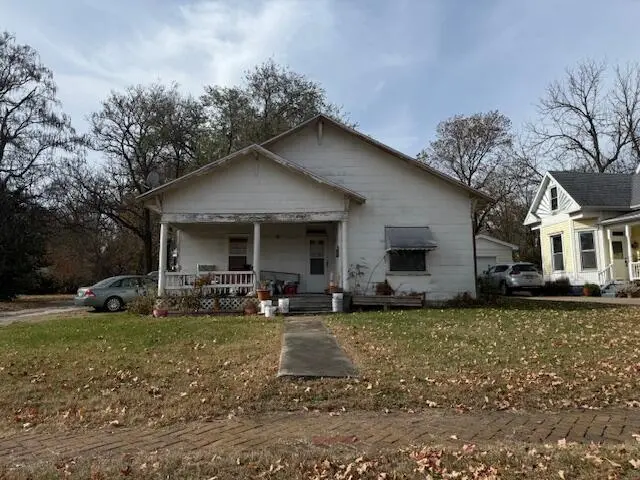
2023 N Robberson Ave · Springfield, MO
Flood risk 1/10 · Minimal
- FEMA flood zone
- X (unshaded)
- Chance of flooding over 30 yrs
- 0.0%
- Est. flood insurance / yr
- $507 – $1,088
Fire risk 1/10 · Minimal
- Est. fire insurance / yr
- $1,054 – $1,958
Heat risk 5/10 · Moderate
- Hot days now (above 105°F)
- 7 days/yr
- Hot days in 30 yrs
- 18 days/yr
Wind risk 2/10 · Minimal
- Chance of severe wind over 30 yrs
- 0.0%
Air-quality risk 2/10 · Minimal
- Unhealthy air days now
- 1 days/yr
- Unhealthy air days in 30 yrs
- 2 days/yr
Risk factors via First Street. Map © Google.
Why this score? — see what drove the B- grade
The composite is a weighted blend of 9 inputs, each scored 0–100. Each bar is that input's sub-score; the figure is the points it added to the 100-point composite (weight × sub-score).
- Cash flow +25.7/30.0
- ARV discount +15.0/15.0
- DSCR +8.6/10.0
- 1% rule +5.7/10.0
- Livability +3.8/5.0
- Rent growth +3.6/5.0
- Schools +3.2/10.0
- Condition / age +2.5/5.0
- Appreciation +0.0/10.0
$90,000
🖨 Deal sheet 📄 Offer letter ✓ Due diligence
Listing remarks MLS
2023 N Robberson has been a wonderful rental for many years, and it is ready to move to a new investor's portfolio. It has a long-term tenant currently residing in the home for the past 8+ years. The home features off street parking and a large backyard for a family to enjoy. It is also within walking distance of a park for an added bonus to families looking to settle down!
Key facts
- Off street parking
- Large backyard
- 0.27 acre lot
Tags
Neighborhood map
What this means for you Summary
Snapshot
- This is a 1-bed/1.0-bath single-family listed at $90k.
Deal economics
- At list price, monthly cash flow is $217 ($3k/yr) — positive.
- The deal already cash-flows at list — no discount required.
- Meets the 1% rule at list price ($965 rent vs $90k).
- Recommended offer: $89k (1.5% below list) — sets the bar for market timing.
- Cap rate 9.2% vs local median 4.6% in Springfield — top-decile yield for the area; either an underpriced asset or a hidden risk that comps aren't pricing in. Stress-test before assuming the spread holds.
Location & tenants
- Location reads 75/100 on livability (#57 in MO, #4,121 nationally) — a middle-class / working-renter tenant base. Strengths: commute A+, cost of living A+, housing A+; Watch: crime F, employment F.
- Springfield R-XII (urban): math 32% / reading 46% proficiency, ranked #174 of 324 in MO (top 54%) — families likely to look elsewhere, expect single-tenant / working-renter base with shorter leases.
- Market conditions: Rents rising fast (+4.2%/yr); 394 active listings in the ZIP; 28 comparable units currently listed for rent nearby; rentals at typical pace (median 24d on market — plan ~3-4 weeks tenant-placement turnaround); 1,302 units permitted in Greene County in 2024 (250 in 5+ unit buildings).
Forward outlook
- Local home prices are declining (-3.0%/yr); year-one equity from $622 of loan paydown is wiped out by about $3k of value loss. Plan a longer hold.
- Greene County population projected at +25% by 2050 — long-run rental-demand tailwind backs the buy-and-hold thesis.
- At projected returns (-3.0% appreciation + 4.2% rent growth), your $25k cash investment doubles in ~10 years — after that, you're playing with house money.
Negotiation context
- It's been on market 29 days — a 2% lower offer ($89k) is reasonable based on typical stale-listing flexibility.
- 3 sale attempts since 4y ago with the ask held roughly flat each time — persistent listings suggest the price (not the market) is what's stuck; bring a comps-based counter.
Risks & watch-outs
- Watch-outs: built in 1907 — expect roof / HVAC / electrical / plumbing capex.
- Climate carrying-cost: extreme-heat days projected 7→18/yr by 2055 (HVAC capex compounding) — expect insurance premiums to compound above CPI over the hold.
Questions for the listing agent
- Built in 1907 — when were the roof, HVAC, electrical panel, plumbing, and water heater last replaced?
- Is there a deadline driving the sale (1031 exchange, divorce, estate, relocation)? That informs how much negotiation room exists.
- Crime grade is F in this area — have there been break-ins, vandalism, or insurance claims at this property in the last 3 years? What carrier currently insures it and at what premium?
- What's the average days-on-market for RENTAL listings here right now (not sales)? A rising rental-DOM trend means longer vacancies and softer asking-rent achievability than the comps imply.
- What's the recent tenant-quality profile in this submarket — average credit score on applications, eviction rate, late-payment / NSF rate, and stable-employment percentage? A property-management company in the area should have these aggregated.
- How much new for-sale + rental construction is in the pipeline within 1–3 miles? Heavy new supply typically softens prices + rents 12–24 months out; constrained supply supports both.
Investment metrics
- 1% rule
- 1.07% ✓
- Cap rate
- 9.19%
- Cash-on-cash
- 10.33%
- DSCR
- 1.46
- GRM
- 7.8
CMA / ARV
- ARV (on-the-fly)
- $147,960
- Comps found
- 12
Show comp detail 12 sales within ~0.75 mi
| Address | Dist | Beds/Ba | Sqft | Sold | Price | $/sf | Match |
|---|---|---|---|---|---|---|---|
| 1890 N Douglas Ave | 0.47mi | 2/2.0 (+1) | 1,250 (+1%) | 4mo | $174,900 | $140 | 63 |
| 1607 N Washington Ave | 0.52mi | 2/1.0 (+1) | 1,195 (-3%) | 6mo | $164,500 | $138 | 61 |
| 2015 N Benton Ave | 0.18mi | 2/2.0 (+1) | 1,080 (-12%) | 3mo | $129,900 | $120 | 60 |
| 424 E Locust St | 0.49mi | 2/2.0 (+1) | 1,256 (+2%) | 6mo | $159,900 | $127 | 60 |
| 1863 N Grant Ave | 0.45mi | 2/1.0 (+1) | 1,140 (-8%) | 2mo | $149,900 | $131 | 60 |
| 2160 N Campbell Ave | 0.23mi | 2/1.0 (+1) | 1,144 (-7%) | 20mo | $125,000 | $109 | 56 |
| 2427 N Boonville Ave | 0.53mi | 2/1.5 (+1) | 1,188 (-4%) | 8mo | $139,900 | $118 | 56 |
| 2243 N Missouri Ave | 0.64mi | 2/1.5 (+1) | 1,315 (+7%) | 4mo | $135,000 | $103 | 48 |
| 2125 N Travis Ave | 0.68mi | 2/1.0 (+1) | 1,184 (-4%) | 14mo | $125,000 | $106 | 45 |
| 519 E Atlantic St | 0.25mi | 2/1.5 (+1) | 1,080 (-12%) | 19mo | $159,900 | $148 | 45 |
| 1017 E Commercial St | 0.68mi | 2/1.0 (+1) | 1,142 (-7%) | 16mo | $30,000 | $26 | 38 |
| 2518 N Main Ave | 0.69mi | 2/1.0 (+1) | 1,092 (-11%) | 17mo | $44,900 | $41 | 30 |
Match score weights: distance 35% · size 25% · config 20% · recency 20%. Top-matched comps best support the ARV.
Projected returns pro-forma
-3.0% appreciation · 4.24% rent growth · sell at horizon
- IRR
- 0.4%
- Equity multiple
- 1.02×
- Total profit
- $418
- Equity at exit
- $13,419
- IRR
- 11.2%
- Equity multiple
- 1.92×
- Total profit
- $23,150
- Equity at exit
- $7,782
Cash invested: $25,200 (down + closing). Projections, not guarantees.
Landlord ↔ Tenant lean methodology
- Overall (STATE)
- 81 Strongly Landlord-Friendly
- State Missouri
- 81 Strongly Landlord-Friendly · R+10
- County
- — inherits STATE
- City
- — inherits STATE
ZIP-level market 65803
- Home prices YoY
- -29.8%
- Rents YoY
- 4.2%
- Active inventory
- 394
- Price-to-rent
- 7.8×
Monthly cashflow live
- Estimated rent
- $965 high interval (Pro) →
- Mortgage (P&I)
- −$472
- Tax from tax record
- −$36 /mo · $427/yr
- Insurance
- −$38
- HOA
- −$0
- Vacancy / Maint / Mgmt
- −$203
- Net cashflow
- $217
Break-even live
UW: 25.0% down · 7.5% · 30yr · 1.5% tax · 5.0% vac · 8.0% maint · 8.0% mgmt
Financing live
Cash to close
- Down payment
- $22,500
- Closing costs
- $2,700
- Reserves months
- —
- Total cash needed
- —
Loan-product check · same deal, 3 products live
Conventional
25% down · 7.5% · 30yr
- Down + closing
- —
- Monthly P&I
- —
- Monthly cashflow
- —
- DSCR
- —
- Eligible?
- —
Personal DTI + credit; lowest rate.
DSCR
20% down · 8.5% · 30yr
- Down + closing
- —
- Monthly P&I
- —
- Monthly cashflow
- —
- DSCR
- —
- Eligible?
- —
No personal income docs; deal must DSCR.
Hard money
10% down · 12.0% · 12mo
- Down + closing
- —
- Monthly P&I
- —
- Monthly cashflow
- —
- DSCR
- —
- Eligible?
- —
Short-term bridge; refi at stabilization.
Rent comps 28 comps
| Address | Beds | Baths | Sqft | Rent | $/sqft | DOM | Units | Dist |
|---|---|---|---|---|---|---|---|---|
| 407 E Dale St Apt B Springfield, MO | 2.0 | 1.0 | 720 | $795 | $1.10 | 13d | 1 | 0.16mi |
| 317 E Chase St Springfield, MO | 2.0 | 2.0 | 915 | $1,100 | $1.20 | 44d | 1 | 0.18mi |
| 2230 N Campbell Ave Springfield, MO | 2.0 | 1.0 | 1084 | $1,095 | $1.01 | 44d | 1 | 0.29mi |
| 203 W Commercial St Unit 2F Springfield, MO | 2.0 | 1.0 | 1000 | $1,150 | $1.15 | 21d | 1 | 0.30mi |
| 2034 N Washington Ave Springfield, MO | 2.0 | 1.0 | 800 | $875 | $1.09 | 44d | 1 | 0.33mi |
| 1623 N Jefferson Ave Unit B Springfield, MO | 1.0 | 1.0 | 750 | $950 | $1.27 | 44d | 1 | 0.41mi |
| 805 E Garfield St Springfield, MO | 2.0 | 1.0 | 950 | $950 | $1.00 | 13d | 1 | 0.47mi |
| 603 W Division St Springfield, MO | 2.0 | 1.0 | 816 | $995 | $1.22 | 13d | 1 | 0.62mi |
| 716 E Locust St Unit A Springfield, MO | 2.0 | 1.0 | 915 | $850 | $0.93 | 23d | 1 | 0.64mi |
| 1409 N Washington Ave Springfield, MO | 2.0 | 1.0 | 839 | $1,405 | $1.67 | 13d | 2 | 0.73mi |
| 2234 N Travis Ave Springfield, MO | 1.0 | 1.0 | 890 | $750 | $0.84 | 44d | 1 | 0.76mi |
| 2120 N Johnston Ave Springfield, MO | 2.0 | 1.0 | 880 | $925 | $1.05 | 44d | 1 | 0.78mi |
| 1112 E Locust St Springfield, MO | 2.0 | 1.0 | 840 | $945 | $1.12 | 23d | 1 | 0.94mi |
| 616 W Webster St Springfield, MO | 2.0 | 1.5 | 1178 | $1,050 | $0.89 | 13d | 1 | 0.96mi |
| 2337 N Ramsey Ave Springfield, MO | 2.0 | 1.0 | 882 | $875 | $0.99 | 13d | 1 | 1.03mi |
| 2850 N Campbell Ave Apt S Springfield, MO | 1.0 | 1.0 | 727 | $750 | $1.03 | 44d | 1 | 1.06mi |
| 1306 N Frisco Ave Apt A Springfield, MO | 2.0 | 1.5–2.0 | 970 | $995 | $1.03 | 13d | 19 | 1.06mi |
| 2054 N Rogers Ave Springfield, MO | 2.0 | 1.0 | 888 | $925 | $1.04 | 13d | 1 | 1.10mi |
| 2345 N Prospect Ave Springfield, MO | 2.0 | 1.0 | 792 | $850 | $1.07 | 13d | 1 | 1.10mi |
| 2313 N Rogers Ave Unit 1 Springfield, MO | 2.0 | 2.0 | 882 | $950 | $1.08 | 13d | 1 | 1.13mi |
| 815 N Grant Ave Unit A Springfield, MO | 2.0 | 1.0 | 801 | $625 | $0.78 | 44d | 1 | 1.25mi |
| 2126 N Lexington Ave Springfield, MO | 2.0 | 1.0 | 990 | $895 | $0.90 | 13d | 1 | 1.27mi |
| 1447 E Oakwood Ln Springfield, MO | 2.0 | 2.0 | 982 | $1,395 | $1.42 | 44d | 1 | 1.28mi |
| 1406 W Calhoun St Unit B Springfield, MO | 2.0 | 1.0 | 885 | $865 | $0.98 | 23d | 1 | 1.30mi |
| 1501 E Blaine St Springfield, MO | 2.0 | 1.0 | 958 | $695 | $0.73 | 23d | 1 | 1.32mi |
| 1529 N Weller Ave Springfield, MO | 2.0 | 1.0 | 870 | $995 | $1.14 | 23d | 1 | 1.34mi |
| 2940 N East Ave Springfield, MO | 2.0 | 2.0 | 915 | $700 | $0.77 | 13d | 1 | 1.35mi |
| 2337 N Delaware Ave Springfield, MO | 2.0 | 1.0 | 876 | $1,195 | $1.36 | 44d | 1 | 1.40mi |
Listing history 18 events
-
2026-06-18days on market $90,000 Active 29 DOM
-
2026-06-17days on market $90,000 Active 28 DOM
-
2026-06-16days on market $90,000 Active 27 DOM
-
2026-06-15days on market $90,000 Active 26 DOM
-
2026-06-14days on market $90,000 Active 24 DOM
-
2026-06-10days on market $90,000 Active 21 DOM
-
2026-06-09days on market $90,000 Active 20 DOM
-
2026-06-08days on market $90,000 Active 19 DOM
-
2026-06-07days on market $90,000 Active 18 DOM
-
2026-06-03days on market $90,000 Active 14 DOM
-
2026-06-02days on market $90,000 Active 13 DOM
-
2026-06-01days on market $90,000 Active 12 DOM
-
2026-05-31days on market $90,000 Active 11 DOM
-
2026-05-30days on market $90,000 Active 10 DOM
-
2026-05-20$90,000 Active 376-char remark
Show marketing remark (376 chars)
2023 N Robberson has been a wonderful rental for many years, and it is ready to move to a new investor's portfolio. It has a long-term tenant currently residing in the home for the past 8+ years. The home features off street parking and a large backyard for a family to enjoy. It is also within walking distance of a park for an added bonus to families looking to settle down!
-
2026-04-01price $90,000
-
2025-11-19$100,000 Active
-
2022-05-06$90,000 Active
ⓘ Source: listings_history table (triggers on properties + properties_extension) + one-shot
backfill from property_details.listing_events for pre-trigger history.
Tax reassessment forecast MO · Resets to sale price
- Current annual tax
- $427 · $36/mo
- Projected year-2 tax
- $873 · $73/mo
- Expected delta
- +$446/yr (+$37/mo · 104.5%)
ⓘ Screening estimate from a state-policy table — verify with the county assessor before closing.
Climate risk First Street
- Flood 1/10 Low FEMA zone X (unshaded) · 0% chance over 30 yrs
- Wildfire 1/10 Low
- Heat 5/10 Major 7 d/yr ≥105°F today · 18 d/yr by 30 yrs out
- Wind 2/10 Low 0% chance of damaging wind over 30 yrs
- Air quality 2/10 Low 1 unhealthy d/yr today · 2 by 30 yrs out
Nearby sold comps map
Loading sold comps map…
Walkable amenities ~0.75 mi
Loading nearby amenities…
Taxation est. · year 1
- Rental income
- $11,574
- − Mortgage interest
- −$5,041
- − Property taxes
- −$427
- − Insurance
- −$450
- − Repairs & maintenance
- −$926
- − Management
- −$926
- − Depreciation
- −$2,618
- Taxable income
- $1,186
- Est. tax owed @ 24.0%
- −$285
- After-tax cash flow
- $2,319/yr
For passive investors: Depreciation is non-cash, so a rental often shows a tax loss while cash-flowing — sheltering income. Rental losses are passive: they offset passive income freely, and up to $25,000/yr can offset ordinary (W-2) income if you actively participate and your MAGI is under $100k (phasing out to $0 by $150k); unused losses carry forward. On sale, claimed depreciation is recaptured at up to 25%, and gains may owe capital-gains tax (a 1031 exchange can defer both). Figures are a year-1 estimate at your 24.0% rate — not tax advice; consult a CPA.
Schools (NCES district)
- District
- Springfield R-XII
- NCES district ID
- 2928860
- Math proficiency
- 32% ▼ -2.00%
- Reading proficiency
- 46% ▼ -3.00%
- Median HH income
- $37,886
- Composite
- 32.45/100
- National rank
- #5717
- State rank
- #174 of 324 in MO
Livability — Springfield
- Score
- 75/100
- State rank
- #57
- US rank
- #4121
Category grades
Schools grade is shown separately in the Schools card above.
Census & demographics
- Census place
- Springfield, MO
- County
- Greene County · 244,327 people
- City population
- 223,044
- Metro
- Springfield, MO
- Population (ZIP)
- 42,882
- Household income
- $50,572
- Rent vs Own
- Severe rent burden
- 1305.0
Population outlook (Greene County) Hauer SSP2
- Today (2025)
- 319,054 people
- By 2030
- 335,135 · +5.0%
- By 2040
- 366,186 · +14.8%
- By 2050
- 397,431 · +24.6%
- By 2075
- 477,035 · +49.5%
- By 2100
- 520,828 · +63.2%
Race, ethnicity, and origin ACS 2023
- Neighborhood character
- Predominantly White (82%)
- Race & ethnicity
- White 82% Two or more races 9% Hispanic / Latino 6% Black 4%
- Hispanic origin (detail)
- Mexican 2% Puerto Rican 2%
- Common ancestry
- Lithuanian 2% Italian 2% Iranian 2%
- Foreign-born
- 3% · Canada
- Languages at home
- 95% English-only · Spanish 3%
Political lean MEDSL · Greene
- 2024 margin
- Strong R (+20.8) · D 38.9% · R 59.7% · Other 1.4%
- 2008→2024 swing
- -5.0pp toward R · 2008: -15.8pp · 2024: -20.8pp
- All cycles
- 2024: R+20.8 2020: R+20.1 2016: R+27.4 2012: R+24.4 2008: R+15.8
Not yet ingested
- Civics
- —
Market trends
- HPI YoY
- ▼ -87.08%
- Current HPI
- 205.0439
- Rent YoY
- ▲ 4.24%
- Metro
- Springfield, MO
- State GDP YoY
- ▲ 1.84%
- F500 in state
- 20
Industry mix (Fortune 500 HQ in MO)
| Industry | F500 HQs | Revenue |
|---|---|---|
| Healthcare | 1 | $163B |
|
||
| Insurance | 1 | $21B |
|
||
| Industrial Technology | 1 | $17B |
|
||
| Retail | 1 | $16B |
|
||
| Industrial Distribution | 1 | $10B |
|
||
| Utilities | 1 | $9B |
|
||
Price history
+0.0% since first listed4 events — show timeline
- 2026-05-20 Listed $90,000 SOMO
- 2026-04-01 Price Changed $90,000 SOMO
- 2025-11-19 Listed $100,000 SOMO
- 2022-05-06 Listed $90,000 SOMO
Property tax history
+1.3%/yrLatest (2025): $427 · -12.1% YoY. Source: county tax records.
Cash-flow waterfall
monthlySold comps — $/sqft
last 12 mo · ≤1 miLoading sold comps…