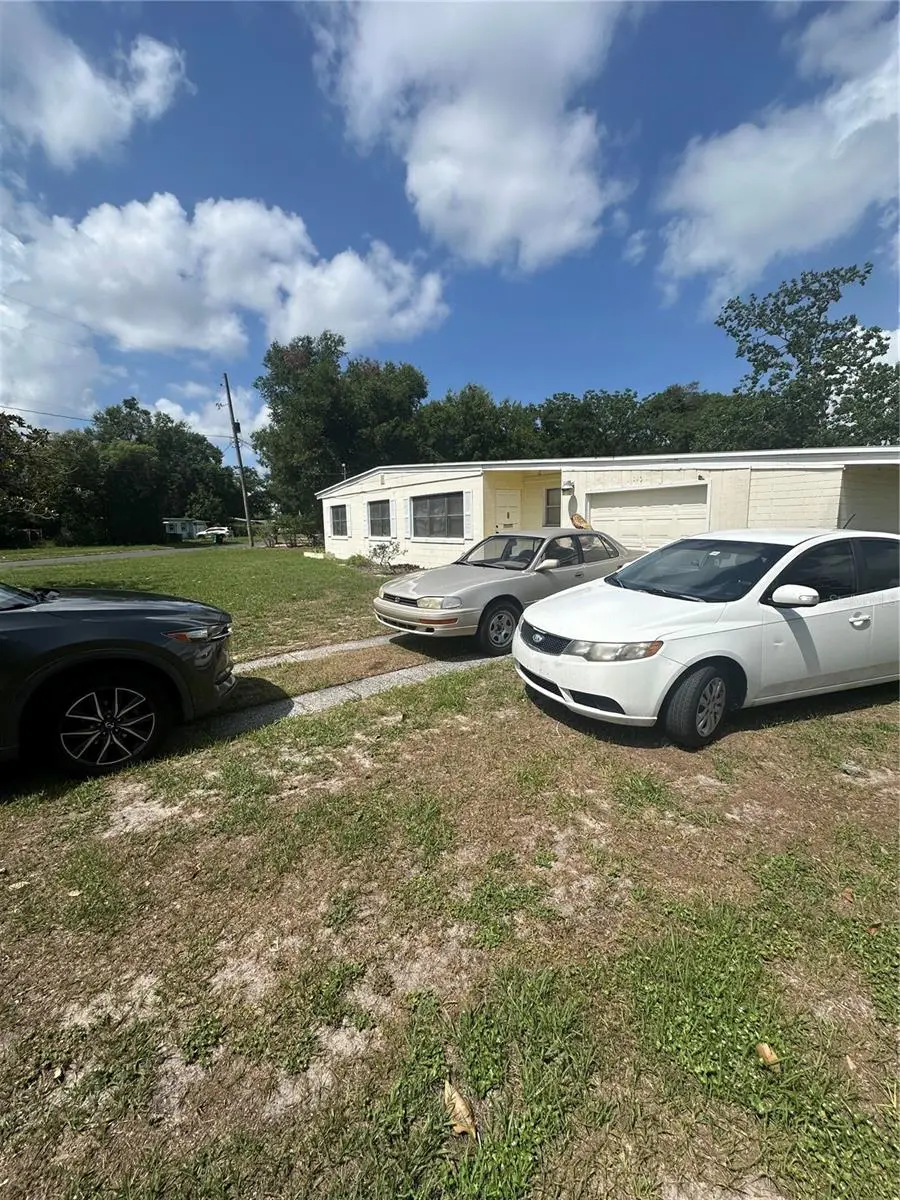
140 Lantana Dr · Azalea Park, FL
Flood risk 1/10 · Minimal
- FEMA flood zone
- X (unshaded)
- Chance of flooding over 30 yrs
- 0.0%
- Est. flood insurance / yr
- $507 – $1,088
Fire risk 1/10 · Minimal
- Est. fire insurance / yr
- $947 – $1,759
Heat risk 9/10 · Severe
- Hot days now (above 108°F)
- 7 days/yr
- Hot days in 30 yrs
- 21 days/yr
Wind risk 9/10 · Severe
- Chance of severe wind over 30 yrs
- 99.0%
Air-quality risk 2/10 · Minimal
- Unhealthy air days now
- 1 days/yr
- Unhealthy air days in 30 yrs
- 1 days/yr
Risk factors via First Street. Map © Google.
Why this score? — see what drove the C+ grade
The composite is a weighted blend of 9 inputs, each scored 0–100. Each bar is that input's sub-score; the figure is the points it added to the 100-point composite (weight × sub-score).
- Cash flow +19.4/30.0
- ARV discount +15.0/15.0
- DSCR +6.1/10.0
- 1% rule +5.9/10.0
- Schools +4.1/10.0
- Livability +4.0/5.0
- Rent growth +3.2/5.0
- Condition / age +2.5/5.0
- Appreciation +0.0/10.0
$190,000
🖨 Deal sheet 📄 Offer letter ✓ Due diligence
Listing remarks
Investor Special
Key facts
- 0.29 acre lot
- Garage
- Built 1952
Property features AI
Finance
- Other: Zoned R-1A
- HOA & community: No association information listed
Exterior
- Parking: Driveway; Attached garage (1 car)
- Utilities: Public water; Public sewer; Electricity available; Sewer connected
- Home design: Single family residence; Residential property; Fixer condition; Two levels; Facing southeast
- Construction: Concrete construction; Other roof type; Slab foundation; Built on a 0.29-acre lot (approx. 1/4 to less than 1/2 acre)
- Exterior features: Lighting; Sidewalk
Interior
- Kitchen: No appliances listed
- Bedrooms: 3 bedrooms
- Flooring: Carpet; Laminate; Other
- Bathrooms: 1 full bathroom
- Heating & cooling: Central heating; Central air conditioning
- Interior features: Ceiling fans
- Laundry & utility: Laundry: other (unspecified)
Neighborhood map
What this means for you Summary
Snapshot
- This is a 3-bed/1.0-bath single-family listed at $190k.
Deal economics
- At list price, monthly cash flow is $211 ($3k/yr) — positive.
- The deal already cash-flows at list — no discount required.
- Meets the 1% rule at list price ($2k rent vs $190k).
- Cap rate 7.6% vs local median 4.0% in Azalea Park — top-decile yield for the area; either an underpriced asset or a hidden risk that comps aren't pricing in. Stress-test before assuming the spread holds.
Location & tenants
- Location reads 79/100 on livability (#144 in FL, #2,148 nationally) — a middle-class / working-renter tenant base. Strengths: commute A+, cost of living A+, housing A+; Watch: amenities F, employment D-.
- Orange (suburban): math 46% / reading 51% proficiency, ranked #43 of 73 in FL (top 59%) — families likely to look elsewhere, expect single-tenant / working-renter base with shorter leases.
- Market conditions: Rents rising (+2.6%/yr); 172 active listings in the ZIP; 40 comparable units currently listed for rent nearby; rentals at typical pace (median 20d on market — plan ~3-4 weeks tenant-placement turnaround); 8,053 units permitted in Orange County in 2024 (3,133 in 5+ unit buildings).
- This rent runs 42% of the median local income ($60k/yr) — at the standard rent-burdened threshold; future hikes will face affordability resistance.
Forward outlook
- Local home prices are declining (-3.0%/yr); year-one equity from $1k of loan paydown is wiped out by about $6k of value loss. Plan a longer hold.
- Orange County population projected at +52% by 2050 — long-run rental-demand tailwind backs the buy-and-hold thesis.
Negotiation context
- Only 1 days on market — expect competitive offers; lowballing is unlikely to land.
Risks & watch-outs
- Watch-outs: built in 1952 — expect roof / HVAC / electrical / plumbing capex.
- Climate carrying-cost: severe wind risk, 99% chance of damaging wind over 30y; extreme-heat days projected 7→21/yr by 2055 (HVAC capex compounding) — expect insurance premiums to compound above CPI over the hold.
Questions for the listing agent
- Built in 1952 — when were the roof, HVAC, electrical panel, plumbing, and water heater last replaced?
- Is there a deadline driving the sale (1031 exchange, divorce, estate, relocation)? That informs how much negotiation room exists.
- Schools are B-rated — typically a magnet for longer-tenancy family renters. What's the average tenant stay here, and is there a school-zone premium baked into asking?
- What's the average days-on-market for RENTAL listings here right now (not sales)? A rising rental-DOM trend means longer vacancies and softer asking-rent achievability than the comps imply.
- What's the recent tenant-quality profile in this submarket — average credit score on applications, eviction rate, late-payment / NSF rate, and stable-employment percentage? A property-management company in the area should have these aggregated.
- How much new for-sale + rental construction is in the pipeline within 1–3 miles? Heavy new supply typically softens prices + rents 12–24 months out; constrained supply supports both.
Investment metrics
- 1% rule
- 1.09% ✓
- Cap rate
- 7.62%
- Cash-on-cash
- 4.75%
- DSCR
- 1.21
- GRM
- 7.6
CMA / ARV
- ARV (on-the-fly)
- $319,224
- Comps found
- 10
Show comp detail 10 sales within ~0.75 mi
| Address | Dist | Beds/Ba | Sqft | Sold | Price | $/sf | Match |
|---|---|---|---|---|---|---|---|
| 5873 Camellia Dr | 0.20mi | 3/1.0 | 1,059 (-6%) | 0mo | $299,000 | $282 | 80 |
| 312 Verbena Dr | 0.67mi | 3/1.0 | 1,150 (+2%) | 13mo | $320,000 | $278 | 55 |
| 120 Japonica Dr | 0.47mi | 3/1.0 | 975 (-14%) | 8mo | $210,000 | $215 | 48 |
| 5990 Hibiscus Rd | 0.41mi | 2/1.0 (-1) | 989 (-13%) | 14mo | $271,000 | $274 | 43 |
| 536 Southern Charm Dr | 0.68mi | 3/2.0 | 1,056 (-7%) | 13mo | $340,000 | $322 | 42 |
| 5730 Crane Pl | 0.53mi | 3/2.0 | 1,248 (+10%) | 15mo | $350,000 | $280 | 42 |
| 532 Yucatan Dr | 0.47mi | 3/1.5 | 989 (-13%) | 18mo | $297,500 | $301 | 40 |
| 45 S Solandra Dr | 0.54mi | 3/1.0 | 1,277 (+13%) | 22mo | $340,000 | $266 | 35 |
| 6728 Peony Ln | 0.58mi | 3/1.0 | 1,000 (-12%) | 23mo | $314,000 | $314 | 34 |
| 537 Hibiscus Way Unit 6C | 0.57mi | 3/2.0 | 996 (-12%) | 19mo | $290,000 | $291 | 34 |
Match score weights: distance 35% · size 25% · config 20% · recency 20%. Top-matched comps best support the ARV.
Projected returns pro-forma
-3.0% appreciation · 2.6% rent growth · sell at horizon
- IRR
- -9.3%
- Equity multiple
- 0.66×
- Total profit
- $-18,093
- Equity at exit
- $28,330
- IRR
- -0.4%
- Equity multiple
- 0.97×
- Total profit
- $-1,437
- Equity at exit
- $16,428
Cash invested: $53,200 (down + closing). Projections, not guarantees.
Landlord ↔ Tenant lean methodology
- Overall (STATE)
- 87 Strongly Landlord-Friendly
- State Florida
- 87 Strongly Landlord-Friendly · R+3
- County
- — inherits STATE
- City
- — inherits STATE
ZIP-level market 32807
- Home prices YoY
- -20.1%
- Rents YoY
- 2.6%
- Active inventory
- 172
- Price-to-rent
- 7.6×
Monthly cashflow live
- Estimated rent
- $2,078 high interval (Pro) →
- Mortgage (P&I)
- −$996
- Tax from tax record
- −$356 /mo · $4,268/yr
- Insurance
- −$79
- HOA
- −$0
- Vacancy / Maint / Mgmt
- −$436
- Net cashflow
- $211
Break-even live
UW: 25.0% down · 7.5% · 30yr · 1.5% tax · 5.0% vac · 8.0% maint · 8.0% mgmt
Financing live
Cash to close
- Down payment
- $47,500
- Closing costs
- $5,700
- Reserves months
- —
- Total cash needed
- —
Loan-product check · same deal, 3 products live
Conventional
25% down · 7.5% · 30yr
- Down + closing
- —
- Monthly P&I
- —
- Monthly cashflow
- —
- DSCR
- —
- Eligible?
- —
Personal DTI + credit; lowest rate.
DSCR
20% down · 8.5% · 30yr
- Down + closing
- —
- Monthly P&I
- —
- Monthly cashflow
- —
- DSCR
- —
- Eligible?
- —
No personal income docs; deal must DSCR.
Hard money
10% down · 12.0% · 12mo
- Down + closing
- —
- Monthly P&I
- —
- Monthly cashflow
- —
- DSCR
- —
- Eligible?
- —
Short-term bridge; refi at stabilization.
Rent comps 40 comps
| Address | Beds | Baths | Sqft | Rent | $/sqft | DOM | Units | Dist |
|---|---|---|---|---|---|---|---|---|
| 160 Palmyra Dr Orlando, FL | 2.0 | 1.0 | 850 | $3,000 | $3.53 | 21d | 1 | 0.20mi |
| 5885 Dahlia Dr Orlando, FL | 2.0 | 1.0 | 830 | $1,348 | $1.62 | 4d | 2 | 0.35mi |
| 5856 Dahlia Dr Azalea Park, FL | 1.0–2.0 | 1.0 | 815 | $1,525 | $1.87 | 7d | 5 | 0.37mi |
| 5885 Dahlia Dr Unit 106/9 Orlando, FL | 2.0 | 1.0 | 830 | $1,350 | $1.63 | 23d | 1 | 0.38mi |
| 5885 Dahlia Dr Unit 216 Orlando, FL | 2.0 | 1.0 | 830 | $1,500 | $1.81 | 20d | 1 | 0.38mi |
| 502 Engel Dr Orlando, FL | 2.0 | 1.0 | 850 | $2,250 | $2.65 | 23d | 1 | 0.38mi |
| 5719 Camellia Dr Orlando, FL | 4.0 | 3.5 | 1315 | $2,475 | $1.88 | 23d | 1 | 0.41mi |
| 511 Carr St Orlando, FL | 4.0 | 2.0 | 1209 | $2,500 | $2.07 | 4d | 1 | 0.48mi |
| 247 Cocos Dr Orlando, FL | 3.0 | 1.0 | 916 | $1,950 | $2.13 | 7d | 1 | 0.48mi |
| 529 Hibiscus Way Orlando, FL | 3.0 | 2.0 | 1458 | $2,150 | $1.47 | 7d | 1 | 0.51mi |
| 536 Hibiscus Way Unit 7B Orlando, FL | 3.0 | 2.0 | 1113 | $3,977 | $3.57 | 20d | 1 | 0.56mi |
| 6635 Breeze Way Orlando, FL | 1.0–2.0 | 1.0–2.0 | 855 | $1,550 | $1.81 | 4d | 1 | 0.63mi |
| 619 Santa Fe Ln Orlando, FL | 3.0 | 1.5 | 1168 | $2,025 | $1.73 | 21d | 1 | 0.70mi |
| 5520 Lake Underhill Rd Unit 105 Orlando, FL | 3.0 | 2.0 | 1050 | $1,795 | $1.71 | 23d | 1 | 0.70mi |
| 5520 Lake Underhill Rd Unit 203 Orlando, FL | 3.0 | 2.0 | 1050 | $1,695 | $1.61 | 21d | 1 | 0.70mi |
| 712 Saint Lucie Ln Orlando, FL | 3.0 | 1.5 | 1212 | $2,000 | $1.65 | 23d | 1 | 0.76mi |
| 6003 Oleander Dr Orlando, FL | 2.0 | 1.5 | 900 | $1,700 | $1.89 | 23d | 1 | 0.77mi |
| 5801 Shenandoah Way Orlando, FL | 1.0–3.0 | 1.0–2.0 | 999 | $1,800 | $1.80 | 14d | 3 | 0.79mi |
| 5730 Oleander Dr Orlando, FL | 3.0 | 2.0 | 1447 | $2,200 | $1.52 | 4d | 1 | 0.81mi |
| 31 Tuscany Pointe Ave Orlando, FL | 3.0 | 2.0 | 1302 | $2,295 | $1.76 | 21d | 1 | 0.91mi |
| 917 S Alder Ave Orlando, FL | 3.0 | 2.0 | 1014 | $2,050 | $2.02 | 23d | 1 | 0.94mi |
| 846 Grenadier Dr Orlando, FL | 4.0 | 2.0 | 1271 | $2,349 | $1.85 | 23d | 1 | 0.96mi |
| 215 Seville Pointe Ave Orlando, FL | 3.0 | 2.0 | 1496 | $1,100 | $0.74 | 21d | 1 | 0.97mi |
| 1124 Crosstown Way Orlando, FL | 1.0–3.0 | 1.0–2.0 | 1104 | $2,730 | $2.47 | 1d | 10 | 0.99mi |
| 1198 Calanda Ave Orlando, FL | 3.0 | 2.0 | 1151 | $2,390 | $2.08 | 23d | 1 | 1.01mi |
| 654 Caladesi Trl Orlando, FL | 3.0 | 2.0 | 1273 | $2,025 | $1.59 | 20d | 1 | 1.01mi |
| 908 Tucker Ave Orlando, FL | 2.0 | 1.0 | 912 | $1,550 | $1.70 | 7d | 1 | 1.02mi |
| 5835 La Costa Dr #104 Orlando, FL | 2.0 | 2.0 | 1115 | $1,600 | $1.43 | 23d | 1 | 1.05mi |
| 720 Faber Dr Orlando, FL | 3.0 | 1.0 | 996 | $2,050 | $2.06 | 14d | 1 | 1.07mi |
| 1303 Candlewyck Dr Orlando, FL | 2.0 | 1.0 | 904 | $1,500 | $1.66 | 23d | 1 | 1.08mi |
| 1382 Hendren Dr Orlando, FL | 3.0 | 2.0 | 1175 | $2,150 | $1.83 | 23d | 1 | 1.14mi |
| 7325 Goldenpointe Blvd Orlando, FL | 1.0–3.0 | 1.0–2.0 | 1050 | $1,979 | $1.88 | 7d | 9 | 1.17mi |
| 572 Santiago Ave Orlando, FL | 4.0 | 2.0 | 1407 | $2,300 | $1.63 | 21d | 1 | 1.22mi |
| 7595 Sun Tree Cir Orlando, FL | 1.0–2.0 | 1.0–2.0 | 744 | $1,844 | $2.48 | 1d | 13 | 1.24mi |
| 1600 Bending Brook Way Orlando, FL | 2.0 | 2.5 | 1227 | $1,695 | $1.38 | 13d | 1 | 1.29mi |
| 1600 Bending Brook Way Orlando, FL | 2.0 | 2.5 | 1227 | $1,745 | $1.42 | 20d | 1 | 1.29mi |
| 1450 Terre Cia Ave Orlando, FL | 3.0 | 2.0 | 1166 | $2,095 | $1.80 | 4d | 1 | 1.31mi |
| 1001 Shoreview Dr Orlando, FL | 2.0 | 1.0–2.0 | 823 | $1,860 | $2.26 | 1d | 25 | 1.32mi |
| 1610 Little River Dr #20 Orlando, FL | 3.0 | 2.5 | 1307 | $1,800 | $1.38 | 23d | 1 | 1.33mi |
| 5122 Old Cheney Hwy Orlando, FL | 2.0 | 1.0 | 1236 | $1,649 | $1.33 | 19d | 1 | 1.36mi |
Tax reassessment forecast FL · Resets to sale price
- Current annual tax
- $4,268 · $356/mo
- Projected year-2 tax
- $4,268 · $356/mo
- Expected delta
- $0/yr ($0/mo · 0.0%)
ⓘ Screening estimate from a state-policy table — verify with the county assessor before closing.
Climate risk First Street
- Flood 1/10 Low FEMA zone X (unshaded) · 0% chance over 30 yrs
- Wildfire 1/10 Low
- Heat 9/10 Extreme 7 d/yr ≥108°F today · 21 d/yr by 30 yrs out
- Wind 9/10 Extreme 99% chance of damaging wind over 30 yrs
- Air quality 2/10 Low 1 unhealthy d/yr today · 1 by 30 yrs out
Nearby sold comps map
Loading sold comps map…
Walkable amenities ~0.75 mi
Loading nearby amenities…
Taxation est. · year 1
- Rental income
- $24,942
- − Mortgage interest
- −$10,643
- − Property taxes
- −$4,268
- − Insurance
- −$950
- − Repairs & maintenance
- −$1,995
- − Management
- −$1,995
- − Depreciation
- −$5,527
- Taxable loss
- −$437
- Est. tax savings @ 24.0%
- +$105
- After-tax cash flow
- $2,634/yr
For passive investors: Depreciation is non-cash, so a rental often shows a tax loss while cash-flowing — sheltering income. Rental losses are passive: they offset passive income freely, and up to $25,000/yr can offset ordinary (W-2) income if you actively participate and your MAGI is under $100k (phasing out to $0 by $150k); unused losses carry forward. On sale, claimed depreciation is recaptured at up to 25%, and gains may owe capital-gains tax (a 1031 exchange can defer both). Figures are a year-1 estimate at your 24.0% rate — not tax advice; consult a CPA.
Schools (NCES district)
- District
- Orange
- NCES district ID
- 1201440
- Math proficiency
- 46% ▼ -9.00%
- Reading proficiency
- 51% ▼ -2.00%
- Median HH income
- $49,350
- Composite
- 41.47/100
- National rank
- #3461
- State rank
- #43 of 73 in FL
Livability — Azalea Park
- Score
- 79/100
- State rank
- #144
- US rank
- #2148
Category grades
Schools grade is shown separately in the Schools card above.
Census & demographics
- Census place
- Azalea Park, FL
- County
- Orange County · 1,471,359 people
- City population
- 34,933
- Metro
- Orlando-Kissimmee-Sanford, FL
- Population (ZIP)
- 34,456
- Household income
- $59,971
- Rent vs Own
- Severe rent burden
- 1566.0
Population outlook (Orange County) Hauer SSP2
- Today (2025)
- 1,618,226 people
- By 2030
- 1,787,404 · +10.5%
- By 2040
- 2,125,621 · +31.4%
- By 2050
- 2,454,016 · +51.6%
- By 2075
- 3,173,711 · +96.1%
- By 2100
- 3,607,781 · +122.9%
Race, ethnicity, and origin ACS 2023
- Neighborhood character
- Majority Hispanic (62%)
- Race & ethnicity
- Hispanic / Latino 62% White 25% Two or more races 24% Black 6% Asian 4%
- Hispanic origin (detail)
- Mexican 6% Puerto Rican 28% Cuban 7% Dominican 5%
- Common ancestry
- Romanian 1% Slovak 1% Lithuanian 1%
- Foreign-born
- 26% · Canada, Jamaica, Vietnam
- Languages at home
- 44% English-only · Spanish 52% Vietnamese 2% Other Indo-European 1%
Political lean MEDSL · Orange
- 2024 margin
- D (+13.6) · D 56.1% · R 42.5% · Other 1.3%
- 2008→2024 swing
- -5.0pp toward R · 2008: 18.6pp · 2024: 13.6pp
- All cycles
- 2024: D+13.6 2020: D+23.1 2016: D+24.6 2012: D+18.2 2008: D+18.6
Not yet ingested
- Civics
- —
Market trends
- HPI YoY
- ▼ -97.72%
- Current HPI
- 388.4089
- Rent YoY
- ▲ 2.60%
- Metro
- Orlando-Kissimmee-Sanford, FL
- State GDP YoY
- ▲ 3.28%
- F500 in state
- 36
Industry mix (Fortune 500 HQ in FL)
| Industry | F500 HQs | Revenue |
|---|---|---|
| Industrial Technology | 2 | $29B |
|
||
| Insurance | 2 | $17B |
|
||
| Retail | 1 | $60B |
|
||
| Technology Distribution | 1 | $58B |
|
||
| Homebuilding | 1 | $35B |
|
||
| Technology Manufacturing | 1 | $35B |
|
||
Price history
2 events — show timeline
- 2026-05-29 Pending — Stellar MLS as Distributed by MLS Grid
- 2026-05-29 Listed $190,000 Stellar MLS as Distributed by MLS Grid
Property tax history
+15.7%/yrLatest (2025): $4,268 · +8.9% YoY. Source: county tax records.
Cash-flow waterfall
monthlySold comps — $/sqft
last 12 mo · ≤1 miLoading sold comps…