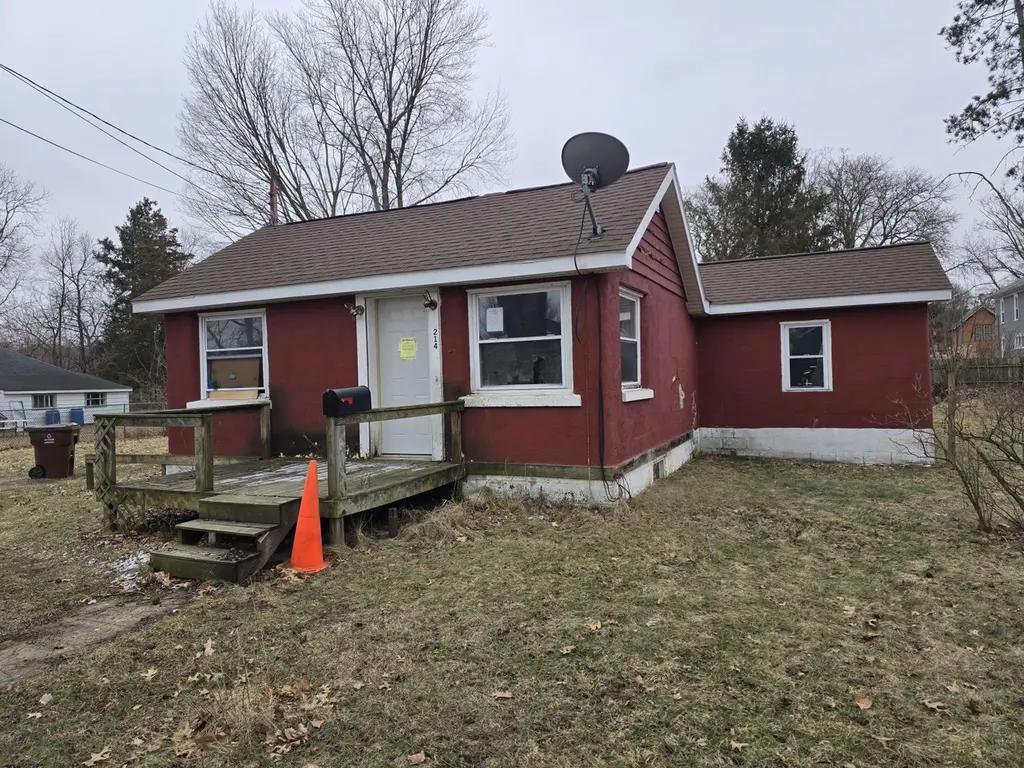
214 E Walnut St · Albion, MI
Flood risk 1/10 · Minimal
- FEMA flood zone
- X (unshaded)
- Chance of flooding over 30 yrs
- 0.0%
- Est. flood insurance / yr
- $473 – $860
Fire risk 1/10 · Minimal
- Est. fire insurance / yr
- $784 – $1,456
Heat risk 2/10 · Minimal
- Hot days now (above 97°F)
- 7 days/yr
- Hot days in 30 yrs
- 16 days/yr
Wind risk 2/10 · Minimal
- Chance of severe wind over 30 yrs
- —
Air-quality risk 2/10 · Minimal
- Unhealthy air days now
- 1 days/yr
- Unhealthy air days in 30 yrs
- 2 days/yr
Risk factors via First Street. Map © Google.
Why this score? — see what drove the B- grade
The composite is a weighted blend of 9 inputs, each scored 0–100. Each bar is that input's sub-score; the figure is the points it added to the 100-point composite (weight × sub-score).
- Cash flow +26.4/30.0
- ARV discount +15.0/15.0
- DSCR +9.0/10.0
- 1% rule +6.2/10.0
- Livability +3.5/5.0
- Schools +3.1/10.0
- Rent growth +2.5/5.0
- Condition / age +2.5/5.0
- Appreciation +0.0/10.0
$78,900
🖨 Deal sheet 📄 Offer letter ✓ Due diligence
Listing remarks MLS
This 2-bedroom, 1-bath home is a true blank canvas needing significant work throughout and is being sold as-is. It is an ideal project for those looking to build immediate sweat equity or add to a rental portfolio. The location offers practical convenience, situated near a local park and within walking distance to the downtown Albion business district. The property includes a small storage shed for tools or equipment. Whether you are looking for a renovation project or a deep-discount entry point into the market, this home is priced to move. Bring your contractor and your vision--this one is ready for a complete overhaul!
Key facts
- Small storage shed
- 0.24 acre lot
- Built 1963
Tags
Neighborhood map
What this means for you Summary
Snapshot
- This is a 2-bed/1.0-bath single-family listed at $79k.
Deal economics
- At list price, monthly cash flow is $206 ($2k/yr) — positive.
- The deal already cash-flows at list — no discount required.
- Meets the 1% rule at list price ($886 rent vs $79k).
- Recommended offer: $72k (9.0% below list) — sets the bar for market timing.
Location & tenants
- Location reads 70/100 on livability (#328 in MI) — a middle-class / working-renter tenant base. Strengths: cost of living A+, housing A+, health & safety A+; Watch: commute C-, amenities D+, schools F.
- Marshall Public Schools (town): math 28% / reading 44% proficiency, ranked #268 of 540 in MI (top 50%) — families likely to look elsewhere, expect single-tenant / working-renter base with shorter leases.
- Market conditions: 134 active listings in the ZIP; 2 comparable units currently listed for rent nearby; 132 units permitted in Calhoun County in 2024 (0 in 5+ unit buildings).
Forward outlook
- Local home prices are declining (-3.0%/yr); year-one equity from $545 of loan paydown is wiped out by about $2k of value loss. Plan a longer hold.
- Calhoun County population projected at -16% by 2050 — secular population decline; favor cash flow + early exit over multi-decade hold.
- At projected returns (-3.0% appreciation + 3.0% rent growth), your $22k cash investment doubles in ~10 years — after that, you're playing with house money.
Negotiation context
- It's been on market 98 days — a 9% lower offer ($72k) is reasonable based on typical stale-listing flexibility.
- 13 sale attempts since 14y ago with the ask held roughly flat each time — persistent listings suggest the price (not the market) is what's stuck; bring a comps-based counter.
- Current owner paid $38k; list at $79k implies a 108% gain — meaningful room to come down on a strong offer.
Questions for the listing agent
- It's been on market 98 days. Have you received any prior offers? Is the seller open to a 9% concession, seller financing, or rate buy-down credit?
- Built in 1963 — when were the roof, HVAC, electrical panel, plumbing, and water heater last replaced?
- Why hasn't it sold? Are there any deal-killer items the seller is aware of (foundation, flood, title, zoning, code violations)?
- Is there a deadline driving the sale (1031 exchange, divorce, estate, relocation)? That informs how much negotiation room exists.
- Schools are F-rated, which usually means shorter tenancies and higher turnover. Who's the typical renter profile here, and what's been the actual vacancy rate?
- Crime grade is F in this area — have there been break-ins, vandalism, or insurance claims at this property in the last 3 years? What carrier currently insures it and at what premium?
- What's the average days-on-market for RENTAL listings here right now (not sales)? A rising rental-DOM trend means longer vacancies and softer asking-rent achievability than the comps imply.
- What's the recent tenant-quality profile in this submarket — average credit score on applications, eviction rate, late-payment / NSF rate, and stable-employment percentage? A property-management company in the area should have these aggregated.
- How much new for-sale + rental construction is in the pipeline within 1–3 miles? Heavy new supply typically softens prices + rents 12–24 months out; constrained supply supports both.
Investment metrics
- 1% rule
- 1.12% ✓
- Cap rate
- 9.42%
- Cash-on-cash
- 11.16%
- DSCR
- 1.50
- GRM
- 7.4
CMA / ARV
- ARV (median comp)
- $100,049
- List price
- $78,900
- Delta
- -21.14%
- Verdict
- UNDERPRICED
- Comps
- 20 within 1.0 mi
Show comp detail 7 sales within ~0.75 mi
| Address | Dist | Beds/Ba | Sqft | Sold | Price | $/sf | Match |
|---|---|---|---|---|---|---|---|
| 1105 S Eaton St | 0.38mi | 2/1.0 | 864 (-9%) | 4mo | $155,000 | $179 | 63 |
| 204 W Walnut St | 0.23mi | 3/1.0 (+1) | 840 (-12%) | 2mo | $100,000 | $119 | 62 |
| 811 S Clinton St | 0.21mi | 3/1.0 (+1) | 912 (-4%) | 20mo | $112,000 | $123 | 61 |
| 812 S Clinton St | 0.24mi | 2/1.0 | 842 (-12%) | 12mo | $75,000 | $89 | 60 |
| 509 Irwin Ave | 0.52mi | 2/1.5 | 896 (-6%) | 7mo | $89,900 | $100 | 58 |
| 306 W Erie St | 0.37mi | 3/1.0 (+1) | 864 (-9%) | 21mo | $140,000 | $162 | 45 |
| 710 N Ionia St | 0.72mi | 2/1.0 | 1,008 (+6%) | 22mo | $115,000 | $114 | 39 |
Match score weights: distance 35% · size 25% · config 20% · recency 20%. Top-matched comps best support the ARV.
Projected returns pro-forma
-3.0% appreciation · 3.0% rent growth · sell at horizon
- IRR
- 0.3%
- Equity multiple
- 1.01×
- Total profit
- $288
- Equity at exit
- $11,764
- IRR
- 10.0%
- Equity multiple
- 1.77×
- Total profit
- $17,035
- Equity at exit
- $6,822
Cash invested: $22,092 (down + closing). Projections, not guarantees.
Landlord ↔ Tenant lean methodology
- Overall (STATE)
- 62 Landlord-Friendly
- State Michigan
- 62 Landlord-Friendly · EVEN
- County
- — inherits STATE
- City
- — inherits STATE
ZIP-level market 49224
- Home prices YoY
- -24.9%
- Active inventory
- 134
- Price-to-rent
- 7.4×
Monthly cashflow live
- Estimated rent
- $886 medium interval (Pro) →
- Mortgage (P&I)
- −$414
- Tax from tax record
- −$48 /mo · $577/yr
- Insurance
- −$33
- HOA
- −$0
- Vacancy / Maint / Mgmt
- −$186
- Net cashflow
- $206
Break-even live
UW: 25.0% down · 7.5% · 30yr · 1.5% tax · 5.0% vac · 8.0% maint · 8.0% mgmt
Financing live
Cash to close
- Down payment
- $19,725
- Closing costs
- $2,367
- Reserves months
- —
- Total cash needed
- —
Loan-product check · same deal, 3 products live
Conventional
25% down · 7.5% · 30yr
- Down + closing
- —
- Monthly P&I
- —
- Monthly cashflow
- —
- DSCR
- —
- Eligible?
- —
Personal DTI + credit; lowest rate.
DSCR
20% down · 8.5% · 30yr
- Down + closing
- —
- Monthly P&I
- —
- Monthly cashflow
- —
- DSCR
- —
- Eligible?
- —
No personal income docs; deal must DSCR.
Hard money
10% down · 12.0% · 12mo
- Down + closing
- —
- Monthly P&I
- —
- Monthly cashflow
- —
- DSCR
- —
- Eligible?
- —
Short-term bridge; refi at stabilization.
Rent comps 2 comps
| Address | Beds | Baths | Sqft | Rent | $/sqft | DOM | Units | Dist |
|---|---|---|---|---|---|---|---|---|
| 313 E North St Albion, MI | 2.0 | 1.0 | 820 | $895 | $1.09 | 44d | 1 | 1.00mi |
| 205 E Watson St Albion, MI | 1.0 | 1.0 | 825 | $875 | $1.06 | 44d | 1 | 1.33mi |
Listing history 45 events
-
2026-06-19days on market $78,900 Active 98 DOM
-
2026-06-18days on market $78,900 Active 97 DOM
-
2026-06-17days on market $78,900 Active 96 DOM
-
2026-06-16days on market $78,900 Active 95 DOM
-
2026-06-15days on market $78,900 Active 94 DOM
-
2026-06-14days on market $78,900 Active 92 DOM
-
2026-06-13days on market $78,900 Active 91 DOM
-
2026-06-10days on market $78,900 Active 89 DOM
-
2026-06-09days on market $78,900 Active 88 DOM
-
2026-06-08days on market $78,900 Active 87 DOM
-
2026-06-07days on market $78,900 Active 86 DOM
-
2026-06-05days on market $78,900 Active 83 DOM
-
2026-06-03days on market $78,900 Active 82 DOM
-
2026-06-02days on market $78,900 Active 81 DOM
-
2026-06-01days on market $78,900 Active 80 DOM
-
2026-05-31days on market $78,900 Active 79 DOM
-
2026-05-30days on market $78,900 Active 78 DOM
-
2026-03-13$78,900 Active 632-char remark
Show marketing remark (629 chars)
This 2-bedroom, 1-bath home is a true blank canvas needing significant work throughout and is being sold as-is. It is an ideal project for those looking to build immediate sweat equity or add to a rental portfolio. The location offers practical convenience, situated near a local park and within walking distance to the downtown Albion business district. The property includes a small storage shed for tools or equipment. Whether you are looking for a renovation project or a deep-discount entry point into the market, this home is priced to move. Bring your contractor and your vision--this one is ready for a complete overhaul!
-
2026-03-13$78,900 Active 629-char remark
Show marketing remark (629 chars)
This 2-bedroom, 1-bath home is a true blank canvas needing significant work throughout and is being sold as-is. It is an ideal project for those looking to build immediate sweat equity or add to a rental portfolio. The location offers practical convenience, situated near a local park and within walking distance to the downtown Albion business district. The property includes a small storage shed for tools or equipment. Whether you are looking for a renovation project or a deep-discount entry point into the market, this home is priced to move. Bring your contractor and your vision--this one is ready for a complete overhaul!
-
2026-03-13$78,900 Active
Show marketing remark (629 chars)
This 2-bedroom, 1-bath home is a true blank canvas needing significant work throughout and is being sold as-is. It is an ideal project for those looking to build immediate sweat equity or add to a rental portfolio. The location offers practical convenience, situated near a local park and within walking distance to the downtown Albion business district. The property includes a small storage shed for tools or equipment. Whether you are looking for a renovation project or a deep-discount entry point into the market, this home is priced to move. Bring your contractor and your vision--this one is ready for a complete overhaul!
-
2021-07-23historical
-
2016-11-25soldstatus $38,000
-
2016-11-25soldstatus $38,000 Sold
-
2016-10-27status Pending
-
2016-06-14$38,900 Active
-
2016-06-14$38,900
-
2016-04-01historical
-
2016-03-31historical
-
2016-03-21price $38,900
-
2016-02-26$40,900 Active
-
2016-02-26$38,900
-
2016-02-14historical
-
2016-02-13historical
-
2016-02-02price $40,900
-
2015-12-30price $42,900
-
2015-11-30price $44,900
-
2015-11-05price $46,900
-
2015-09-29status Active
-
2015-09-18historical
-
2015-09-04$54,900 Active
-
2015-08-13$40,900
-
2013-02-18$39,900
-
2013-02-15historical
-
2012-10-22$39,900
-
2012-10-22$39,900
ⓘ Source: listings_history table (triggers on properties + properties_extension) + one-shot
backfill from property_details.listing_events for pre-trigger history.
Tax reassessment forecast MI · Partial reset (capped growth)
- Current annual tax
- $577 · $48/mo
- Projected year-2 tax
- $896 · $75/mo
- Expected delta
- +$319/yr (+$27/mo · 55.3%)
ⓘ Screening estimate from a state-policy table — verify with the county assessor before closing.
Climate risk First Street
- Flood 1/10 Low FEMA zone X (unshaded) · 0% chance over 30 yrs
- Wildfire 1/10 Low
- Heat 2/10 Low 7 d/yr ≥97°F today · 16 d/yr by 30 yrs out
- Wind 2/10 Low
- Air quality 2/10 Low 1 unhealthy d/yr today · 2 by 30 yrs out
Nearby sold comps map
Loading sold comps map…
Walkable amenities ~0.75 mi
Loading nearby amenities…
Taxation est. · year 1
- Rental income
- $10,637
- − Mortgage interest
- −$4,420
- − Property taxes
- −$577
- − Insurance
- −$394
- − Repairs & maintenance
- −$851
- − Management
- −$851
- − Depreciation
- −$2,295
- Taxable income
- $1,249
- Est. tax owed @ 24.0%
- −$300
- After-tax cash flow
- $2,167/yr
For passive investors: Depreciation is non-cash, so a rental often shows a tax loss while cash-flowing — sheltering income. Rental losses are passive: they offset passive income freely, and up to $25,000/yr can offset ordinary (W-2) income if you actively participate and your MAGI is under $100k (phasing out to $0 by $150k); unused losses carry forward. On sale, claimed depreciation is recaptured at up to 25%, and gains may owe capital-gains tax (a 1031 exchange can defer both). Figures are a year-1 estimate at your 24.0% rate — not tax advice; consult a CPA.
Schools (NCES district)
- District
- Marshall Public Schools
- NCES district ID
- 2622970
- Math proficiency
- 28% ▼ -4.00%
- Reading proficiency
- 44% ▼ -2.00%
- Median HH income
- $48,020
- Composite
- 30.93/100
- National rank
- #6112
- State rank
- #268 of 540 in MI
Livability — Albion
- Score
- 70/100
- State rank
- #328
- US rank
- #8096
Category grades
Schools grade is shown separately in the Schools card above.
Census & demographics
- Census place
- Albion, MI
- Population (ZIP)
- 13,309
Population outlook (Calhoun County) Hauer SSP2
- Today (2025)
- 130,157 people
- By 2030
- 126,691 · -2.7%
- By 2040
- 118,517 · -8.9%
- By 2050
- 109,855 · -15.6%
- By 2075
- 90,486 · -30.5%
- By 2100
- 70,766 · -45.6%
Race, ethnicity, and origin ACS 2023
- Neighborhood character
- Predominantly White (69%)
- Race & ethnicity
- White 69% Black 20% Two or more races 6% Hispanic / Latino 5%
- Common ancestry
- Romanian 3% Lithuanian 1% Iranian 1%
- Foreign-born
- 1% · Canada
- Languages at home
- 96% English-only · Spanish 2% Arabic 1% German/W. Germanic 1%
Political lean MEDSL · Calhoun
- 2024 margin
- R (+14.1) · D 42.3% · R 56.4% · Other 1.3%
- 2008→2024 swing
- -23.4pp toward R · 2008: 9.4pp · 2024: -14.1pp
- All cycles
- 2024: R+14.1 2020: R+11.1 2016: R+12.5 2012: D+1.6 2008: D+9.4
Not yet ingested
- Civics
- —
Market trends
- HPI YoY
- ▼ -67.85%
- Current HPI
- 205.078
- Rent YoY
- —
- Metro
- —
- State GDP YoY
- ▲ 1.37%
- F500 in state
- 28
Industry mix (Fortune 500 HQ in MI)
| Industry | F500 HQs | Revenue |
|---|---|---|
| Automotive Parts | 3 | $48B |
|
||
| Automotive | 2 | $372B |
|
||
| Chemicals | 1 | $45B |
|
||
| Automotive Retail | 1 | $29B |
|
||
| Healthcare / Medical Devices | 1 | $23B |
|
||
| Automotive Technology | 1 | $20B |
|
||
Price history
+97.7% since first listed28 events — show timeline
- 2026-03-13 Listed $78,900 REALCOMP
- 2026-03-13 Listed $78,900 MiRealSource-MiMLS
- 2026-03-13 Listed $78,900 SW Michigan MLS
- 2021-07-23 Listing Removed — SW Michigan MLS
- 2016-11-25 Sold (MLS) $38,000 SW Michigan MLS
- 2016-11-25 Sold (MLS) $38,000 REALCOMP
- 2016-10-27 Pending — SW Michigan MLS
- 2016-06-14 Listed $38,900 SW Michigan MLS
- 2016-06-14 Listed $38,900 REALCOMP
- 2016-04-01 Listing Removed — SW Michigan MLS
- 2016-03-31 Listing Removed — REALCOMP
- 2016-03-21 Price Changed $38,900 SW Michigan MLS
- 2016-02-26 Listed $40,900 SW Michigan MLS
- 2016-02-26 Listed $38,900 REALCOMP
- 2016-02-14 Listing Removed — SW Michigan MLS
- 2016-02-13 Listing Removed — REALCOMP
- 2016-02-02 Price Changed $40,900 SW Michigan MLS
- 2015-12-30 Price Changed $42,900 SW Michigan MLS
- 2015-11-30 Price Changed $44,900 SW Michigan MLS
- 2015-11-05 Price Changed $46,900 SW Michigan MLS
- 2015-09-29 Relisted — SW Michigan MLS
- 2015-09-18 Listing Removed — SW Michigan MLS
- 2015-09-04 Listed $54,900 SW Michigan MLS
- 2015-08-13 Listed $40,900 REALCOMP
- 2013-02-18 Listed $39,900 REALCOMP
- 2013-02-15 Listing Removed — REALCOMP
- 2012-10-22 Listed $39,900 REALCOMP
- 2012-10-22 Listed $39,900 SW Michigan MLS
Property tax history
-9.9%/yrLatest (2025): $577 · -50.5% YoY. Source: county tax records.
Cash-flow waterfall
monthlySold comps — $/sqft
last 12 mo · ≤1 miLoading sold comps…