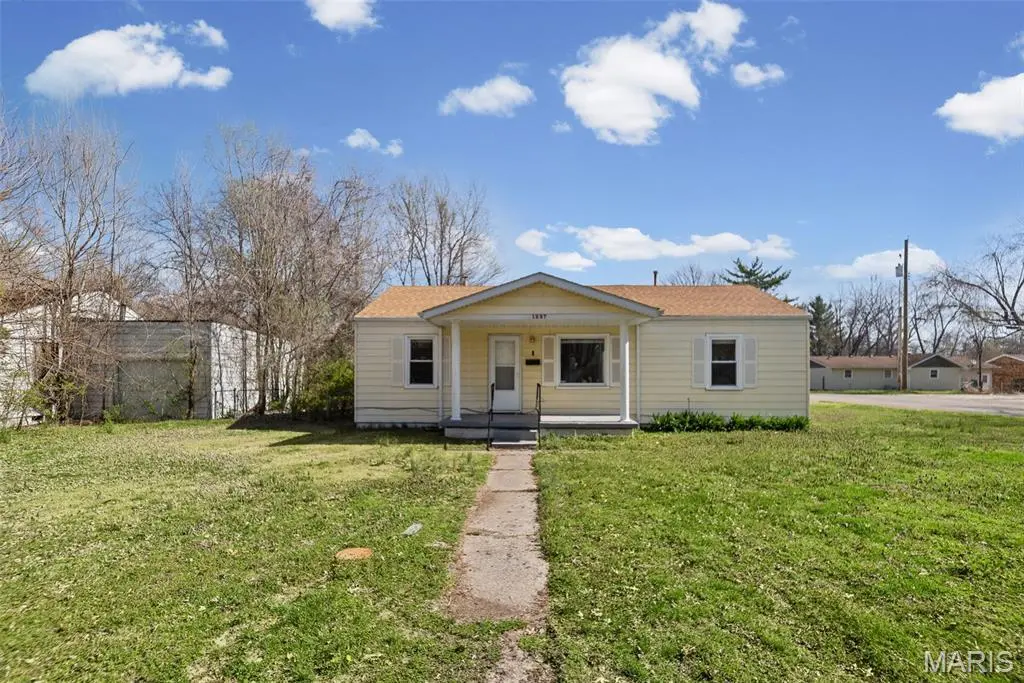
1227 Williams St · Cahokia Heights, IL
Flood risk 1/10 · Minimal
- FEMA flood zone
- X (shaded)
- Chance of flooding over 30 yrs
- 0.0%
- Est. flood insurance / yr
- $507 – $1,088
Fire risk 1/10 · Minimal
- Est. fire insurance / yr
- $804 – $1,492
Heat risk 5/10 · Moderate
- Hot days now (above 107°F)
- 7 days/yr
- Hot days in 30 yrs
- 21 days/yr
Wind risk 2/10 · Minimal
- Chance of severe wind over 30 yrs
- 1.0%
Air-quality risk 3/10 · Minor
- Unhealthy air days now
- 3 days/yr
- Unhealthy air days in 30 yrs
- 4 days/yr
Risk factors via First Street. Map © Google.
Why this score? — see what drove the B- grade
The composite is a weighted blend of 9 inputs, each scored 0–100. Each bar is that input's sub-score; the figure is the points it added to the 100-point composite (weight × sub-score).
- Cash flow +30.0/30.0
- ARV discount +10.2/15.0
- 1% rule +10.0/10.0
- DSCR +10.0/10.0
- Rent growth +2.5/5.0
- Livability +2.5/5.0
- Condition / age +2.5/5.0
- Schools +0.6/10.0
- Appreciation +0.0/10.0
$69,900
🖨 Deal sheet 📄 Offer letter ✓ Due diligence
Listing remarks MLS
Turnkey cash-flow opportunity with immediate income in place! This professionally managed 3-bedroom, 1-bath ranch has just been leased at $850/month with a tenant scheduled to move in on 6/22, making this an ideal low-hassle addition to any investment portfolio. Major capital improvements have already been completed, including a brand-new furnace, new A/C unit, and a new water heater being installed this week. The roof is only two years old, significantly reducing near-term maintenance concerns and helping protect long-term returns. The City of Cahokia has already granted the occupancy certificate, offering additional peace of mind for the next owner. The home features a functional layout with a spacious living area, eat-in kitchen, and a large detached garage that adds strong tenant appeal through additional storage, workshop potential, or secure parking. Situated on a generous lot, the property offers the kind of practical features renters consistently seek, supporting long-term occupancy and stable performance. Investors will appreciate the combination of immediate cash flow, professional management already in place through Christone Property Management, and recent mechanical updates that help minimize deferred maintenance expenses. Properties in this price range continue to see strong rental demand, making this an attractive option for both seasoned investors and those looking to enter the rental market with a stabilized asset. Conveniently located near major roadways, shopping, and everyday amenities, this property checks the boxes for affordability, functionality, and dependable income potential.
Key facts
- Generous lot
- Eat-in kitchen
- Secure parking
Tags
Neighborhood map
What this means for you Summary
Snapshot
- This is a 3-bed/2.0-bath single-family listed at $70k.
Deal economics
- At list price, monthly cash flow is $577 ($7k/yr) — positive.
- The deal already cash-flows at list — no discount required.
- Meets the 1% rule at list price ($1k rent vs $70k).
- Recommended offer: $66k (6.0% below list) — sets the bar for market timing.
Location & tenants
- Location reads: area grade B — affects rentability + tenant quality, not the cash-flow math above.
- Cahokia CUSD 187 (suburban): math 3% / reading 5% proficiency, ranked #864 of 919 in IL (top 94%) — low school quality limits family demand, transient renter base, plan for 1-2y turnover; 85% free/reduced lunch — lower-income household profile, screen leases tightly.
- Market conditions: 153 active listings in the ZIP; 34 comparable units currently listed for rent nearby; rentals at typical pace (median 22d on market — plan ~3-4 weeks tenant-placement turnaround); lower-income renter base — watch delinquency; 783 units permitted in St. Clair County in 2024 (378 in 5+ unit buildings).
- At $1,342/mo this rent would consume 48% of the median local household income ($34k/yr) (locally 729% of renters already pay >50% of income on rent) — very limited rent-growth headroom before tenants either downsize or default.
Forward outlook
- Local home prices are declining (-3.0%/yr); year-one equity from $483 of loan paydown is wiped out by about $2k of value loss. Plan a longer hold.
- St. Clair County population projected at -23% by 2050 — secular population decline; favor cash flow + early exit over multi-decade hold.
- At projected returns (-3.0% appreciation + 3.0% rent growth), your $20k cash investment doubles in ~4 years — after that, you're playing with house money.
Negotiation context
- It's been on market 85 days — a 6% lower offer ($66k) is reasonable based on typical stale-listing flexibility.
- 2 sale attempts with the ask held roughly flat each time — persistent listings suggest the price (not the market) is what's stuck; bring a comps-based counter.
- Current owner paid $52k; 34% above their basis — modest negotiation headroom, anchor on the comps not their cost.
Risks & watch-outs
- Watch-outs: built in 1953 — expect roof / HVAC / electrical / plumbing capex.
- Climate carrying-cost: extreme-heat days projected 7→21/yr by 2055 (HVAC capex compounding) — expect insurance premiums to compound above CPI over the hold.
Questions for the listing agent
- It's been on market 85 days. Have you received any prior offers? Is the seller open to a 6% concession, seller financing, or rate buy-down credit?
- Built in 1953 — when were the roof, HVAC, electrical panel, plumbing, and water heater last replaced?
- Why hasn't it sold? Are there any deal-killer items the seller is aware of (foundation, flood, title, zoning, code violations)?
- Is there a deadline driving the sale (1031 exchange, divorce, estate, relocation)? That informs how much negotiation room exists.
- What's the average days-on-market for RENTAL listings here right now (not sales)? A rising rental-DOM trend means longer vacancies and softer asking-rent achievability than the comps imply.
- What's the recent tenant-quality profile in this submarket — average credit score on applications, eviction rate, late-payment / NSF rate, and stable-employment percentage? A property-management company in the area should have these aggregated.
- How much new for-sale + rental construction is in the pipeline within 1–3 miles? Heavy new supply typically softens prices + rents 12–24 months out; constrained supply supports both.
Investment metrics
- 1% rule
- 1.92% ✓
- Cap rate
- 16.20%
- Cash-on-cash
- 35.39%
- DSCR
- 2.57
- GRM
- 4.3
CMA / ARV
- ARV (median comp)
- $74,427
- List price
- $69,900
- Delta
- -6.08%
- Verdict
- FAIR
- Comps
- 20 within 1.0 mi
Show comp detail 12 sales within ~0.75 mi
| Address | Dist | Beds/Ba | Sqft | Sold | Price | $/sf | Match |
|---|---|---|---|---|---|---|---|
| 1408 Williams St | 0.23mi | 3/1.0 | 936 (-2%) | 1mo | $80,000 | $85 | 80 |
| 1106 Saint Benedict Dr | 0.37mi | 3/1.0 | 957 (-0%) | 2mo | $74,500 | $78 | 76 |
| 1426 Richard Dr | 0.34mi | 3/1.5 | 912 (-5%) | 2mo | $80,000 | $88 | 72 |
| 1313 Saint Raphael St | 0.22mi | 3/1.0 | 864 (-10%) | 1mo | $105,000 | $122 | 68 |
| 1115 Saint Michael Dr | 0.36mi | 3/1.0 | 1,017 (+6%) | 1mo | $82,500 | $81 | 68 |
| 1114 Saint Helena Dr | 0.35mi | 3/1.0 | 875 (-9%) | 1mo | $82,500 | $94 | 64 |
| 945 Howell Ave | 0.34mi | 3/1.0 | 1,084 (+13%) | 0mo | $35,000 | $32 | 58 |
| 1109 Saint Helena Dr | 0.36mi | 3/1.0 | 825 (-14%) | 1mo | $75,000 | $91 | 55 |
| 1745 Harvest Ave | 0.54mi | 3/1.0 | 872 (-9%) | 2mo | $105,000 | $120 | 54 |
| 103 Kenneth Ave | 0.61mi | 3/1.0 | 864 (-10%) | 1mo | $105,000 | $122 | 50 |
| 1936 Doris | 0.74mi | 2/1.0 (-1) | 887 (-8%) | 1mo | $32,500 | $37 | 43 |
| 1511 Andrews Dr | 0.70mi | 3/1.5 | 1,092 (+14%) | 2mo | $105,000 | $96 | 41 |
Match score weights: distance 35% · size 25% · config 20% · recency 20%. Top-matched comps best support the ARV.
Projected returns pro-forma
-3.0% appreciation · 3.0% rent growth · sell at horizon
- IRR
- 31.0%
- Equity multiple
- 2.30×
- Total profit
- $25,458
- Equity at exit
- $10,422
- IRR
- 38.2%
- Equity multiple
- 4.56×
- Total profit
- $69,592
- Equity at exit
- $6,044
Cash invested: $19,572 (down + closing). Projections, not guarantees.
Landlord ↔ Tenant lean methodology
- Overall (STATE)
- 43 Moderately Tenant-Leaning
- State Illinois
- 43 Moderately Tenant-Leaning · D+7
- County
- — inherits STATE
- City
- — inherits STATE
ZIP-level market 62206
- Home prices YoY
- -20.2%
- Active inventory
- 153
- Price-to-rent
- 4.3×
Monthly cashflow live
- Estimated rent
- $1,342 high interval (Pro) →
- Mortgage (P&I)
- −$367
- Tax est. 1.5%
- −$87 /mo · $1,048/yr
- Insurance
- −$29
- HOA
- −$0
- Vacancy / Maint / Mgmt
- −$282
- Net cashflow
- $577
Break-even live
UW: 25.0% down · 7.5% · 30yr · 1.5% tax · 5.0% vac · 8.0% maint · 8.0% mgmt
Financing live
Cash to close
- Down payment
- $17,475
- Closing costs
- $2,097
- Reserves months
- —
- Total cash needed
- —
Loan-product check · same deal, 3 products live
Conventional
25% down · 7.5% · 30yr
- Down + closing
- —
- Monthly P&I
- —
- Monthly cashflow
- —
- DSCR
- —
- Eligible?
- —
Personal DTI + credit; lowest rate.
DSCR
20% down · 8.5% · 30yr
- Down + closing
- —
- Monthly P&I
- —
- Monthly cashflow
- —
- DSCR
- —
- Eligible?
- —
No personal income docs; deal must DSCR.
Hard money
10% down · 12.0% · 12mo
- Down + closing
- —
- Monthly P&I
- —
- Monthly cashflow
- —
- DSCR
- —
- Eligible?
- —
Short-term bridge; refi at stabilization.
Rent comps 34 comps
| Address | Beds | Baths | Sqft | Rent | $/sqft | DOM | Units | Dist |
|---|---|---|---|---|---|---|---|---|
| 1220 Williams St East Saint Louis, IL | 3.0 | 1.0 | 876 | $1,500 | $1.71 | 15d | 1 | 0.08mi |
| 1308 Saint Stephens Dr Cahokia Heights, IL | 2.0 | 1.0 | 864 | $875 | $1.01 | 16d | 1 | 0.12mi |
| 1308 Saint Stephens Dr Cahokia Heights, IL | 2.0 | 1.0 | 864 | $875 | $1.01 | 15d | 1 | 0.12mi |
| 1405 Williams St Cahokia Heights, IL | 3.0 | 1.0 | 900 | $1,500 | $1.67 | 44d | 1 | 0.18mi |
| 1417 Richard Dr East Saint Louis, IL | 3.0 | 1.0 | 936 | $1,400 | $1.50 | 22d | 1 | 0.25mi |
| 1421 Richard Dr East Saint Louis, IL | 3.0 | 1.0 | 936 | $1,100 | $1.18 | 2d | 1 | 0.27mi |
| 818 La Salle Dr East Saint Louis, IL | 3.0 | 1.0 | 1106 | $1,300 | $1.18 | 24d | 1 | 0.33mi |
| 1716 # E Unit Loretta Ave unit East St Louis, IL | 2.0 | 1.0 | 720 | $1,000 | $1.39 | 44d | 1 | 0.36mi |
| 1713 Loretta Ave East Saint Louis, IL | 3.0 | 1.0 | 944 | $1,095 | $1.16 | 44d | 1 | 0.37mi |
| 1109 Saint Helena Dr Cahokia Heights, IL | 3.0 | 1.0 | 825 | $1,400 | $1.70 | 3d | 1 | 0.38mi |
| 819 Mildred Ave East Saint Louis, IL | 3.0 | 1.0 | 936 | $1,250 | $1.34 | 22d | 1 | 0.45mi |
| 1808 Mullens Ave Cahokia Heights, IL | 3.0 | 1.0 | 992 | $1,500 | $1.51 | 3d | 1 | 0.47mi |
| 850 Saint Bartholomew Dr Cahokia, IL | 3.0 | 1.0 | 1050 | $1,285 | $1.22 | 16d | 1 | 0.54mi |
| 1162 Smith St East Saint Louis, IL | 3.0 | 1.0 | 988 | $1,295 | $1.31 | 22d | 1 | 0.65mi |
| 1150 Price St Cahokia, IL | 3.0 | 1.0 | 864 | $1,400 | $1.62 | 3d | 1 | 0.79mi |
| 142 Saint Barbara Ln East Saint Louis, IL | 3.0 | 2.0 | 990 | $1,300 | $1.31 | 44d | 1 | 0.85mi |
| 1706 Andrews Dr East Saint Louis, IL | 4.0 | 1.0 | 925 | $1,320 | $1.43 | 24d | 1 | 0.85mi |
| 2008 Delores St East Saint Louis, IL | 3.0 | 1.0 | 925 | $1,250 | $1.35 | 4d | 1 | 0.86mi |
| 121 Saint Dorothy Dr Cahokia, IL | 3.0 | 1.0 | 988 | $1,500 | $1.52 | 44d | 1 | 0.90mi |
| 811 Saint Thomas Ln East Saint Louis, IL | 3.0 | 1.0 | 1040 | $1,295 | $1.25 | 24d | 1 | 0.94mi |
| 701 Saint Paul Dr East Saint Louis, IL | 3.0 | 1.0 | 864 | $1,500 | $1.74 | 44d | 1 | 1.03mi |
| 2116 Doris Ave Cahokia Heights, IL | 3.0 | 1.0 | 880 | $1,400 | $1.59 | 22d | 1 | 1.04mi |
| 1002 Upper Cahokia Rd East Saint Louis, IL | 3.0 | 1.0 | 720 | $860 | $1.19 | 15d | 1 | 1.05mi |
| 124 Saint James Ln Cahokia Heights, IL | 3.0 | 1.0 | 1064 | $1,350 | $1.27 | 44d | 1 | 1.09mi |
| 148 Saint James Ln East Saint Louis, IL | 3.0 | 1.0 | 864 | $1,200 | $1.39 | 44d | 1 | 1.11mi |
| 502 Saint Thomas Ln East Saint Louis, IL | 3.0 | 1.0 | 864 | $1,400 | $1.62 | 3d | 1 | 1.13mi |
| 500 Saint Thomas Ln East Saint Louis, IL | 3.0 | 1.0 | 864 | $950 | $1.10 | 24d | 1 | 1.14mi |
| 111 Saint Thomas Ln East Saint Louis, IL | 3.0 | 1.0 | 1040 | $1,350 | $1.30 | 44d | 1 | 1.19mi |
| 526 Saint Leo Dr East Saint Louis, IL | 3.0 | 1.0 | 925 | $1,400 | $1.51 | 3d | 1 | 1.19mi |
| 705 Saint Martin Dr East Saint Louis, IL | 4.0 | 1.0 | 1033 | $1,600 | $1.55 | 22d | 1 | 1.22mi |
| 101 E 5th St Cahokia, IL | 2.0 | 1.0 | 770 | $900 | $1.17 | 44d | 1 | 1.31mi |
| 211 Judith Ln East Saint Louis, IL | 2.0 | 1.0 | 672 | $995 | $1.48 | 4d | 1 | 1.39mi |
| 2231 Loren St Cahokia Heights, IL | 2.0 | 1.0 | 1000 | $1,195 | $1.20 | 44d | 1 | 1.44mi |
| 2 E Adams Dr East Saint Louis, IL | 3.0 | 1.0 | 925 | $885 | $0.96 | 44d | 1 | 1.46mi |
Listing history 19 events
-
2026-06-18days on market $69,900 Active 85 DOM
-
2026-06-17days on market $69,900 Active 84 DOM
-
2026-06-16days on market $69,900 Active 83 DOM
-
2026-06-15days on market $69,900 Active 82 DOM
-
2026-06-13days on market $69,900 Active 80 DOM
-
2026-06-13days on market $69,900 Active 79 DOM
-
2026-06-09days on market $69,900 Active 76 DOM
-
2026-06-08days on market $69,900 Active 75 DOM
-
2026-06-07days on market $69,900 Active 74 DOM
-
2026-06-05days on market $69,900 Active 71 DOM
-
2026-06-03days on market $69,900 Active 70 DOM
-
2026-06-02days on market $69,900 Active 69 DOM
-
2026-06-01days on market $69,900 Active 68 DOM
-
2026-05-31days on market $69,900 Active 67 DOM
-
2026-03-25$69,900 Active 1631-char remark
Show marketing remark (1631 chars)
Turnkey cash-flow opportunity with immediate income in place! This professionally managed 3-bedroom, 1-bath ranch has just been leased at $850/month with a tenant scheduled to move in on 6/22, making this an ideal low-hassle addition to any investment portfolio. Major capital improvements have already been completed, including a brand-new furnace, new A/C unit, and a new water heater being installed this week. The roof is only two years old, significantly reducing near-term maintenance concerns and helping protect long-term returns. The City of Cahokia has already granted the occupancy certificate, offering additional peace of mind for the next owner. The home features a functional layout with a spacious living area, eat-in kitchen, and a large detached garage that adds strong tenant appeal through additional storage, workshop potential, or secure parking. Situated on a generous lot, the property offers the kind of practical features renters consistently seek, supporting long-term occupancy and stable performance. Investors will appreciate the combination of immediate cash flow, professional management already in place through Christone Property Management, and recent mechanical updates that help minimize deferred maintenance expenses. Properties in this price range continue to see strong rental demand, making this an attractive option for both seasoned investors and those looking to enter the rental market with a stabilized asset. Conveniently located near major roadways, shopping, and everyday amenities, this property checks the boxes for affordability, functionality, and dependable income potential.
-
2025-12-06$850
-
2018-08-14soldstatus $52,000
-
2006-04-26soldstatus $48,000
-
1991-05-22soldstatus $23,500
ⓘ Source: listings_history table (triggers on properties + properties_extension) + one-shot
backfill from property_details.listing_events for pre-trigger history.
Climate risk First Street
- Flood 1/10 Low FEMA zone X (shaded) · 0% chance over 30 yrs
- Wildfire 1/10 Low
- Heat 5/10 Major 7 d/yr ≥107°F today · 21 d/yr by 30 yrs out
- Wind 2/10 Low 100% chance of damaging wind over 30 yrs
- Air quality 3/10 Moderate 3 unhealthy d/yr today · 4 by 30 yrs out
Nearby sold comps map
Loading sold comps map…
Walkable amenities ~0.75 mi
Loading nearby amenities…
Taxation est. · year 1
- Rental income
- $16,106
- − Mortgage interest
- −$3,915
- − Property taxes
- −$1,048
- − Insurance
- −$350
- − Repairs & maintenance
- −$1,288
- − Management
- −$1,288
- − Depreciation
- −$2,033
- Taxable income
- $6,182
- Est. tax owed @ 24.0%
- −$1,484
- After-tax cash flow
- $5,443/yr
For passive investors: Depreciation is non-cash, so a rental often shows a tax loss while cash-flowing — sheltering income. Rental losses are passive: they offset passive income freely, and up to $25,000/yr can offset ordinary (W-2) income if you actively participate and your MAGI is under $100k (phasing out to $0 by $150k); unused losses carry forward. On sale, claimed depreciation is recaptured at up to 25%, and gains may owe capital-gains tax (a 1031 exchange can defer both). Figures are a year-1 estimate at your 24.0% rate — not tax advice; consult a CPA.
Schools (NCES district)
- District
- Cahokia CUSD 187
- NCES district ID
- 1708040
- Math proficiency
- 3% ▼ -2.00%
- Reading proficiency
- 5% ▬ 0.00%
- Median HH income
- $28,028
- Composite
- 6.44/100
- National rank
- #14827
- State rank
- #864 of 919 in IL
Livability — Cahokia Heights
No livability data for this city. (Only ~50 U.S. cities are tracked.)
Census & demographics
- Census place
- Cahokia Heights, IL
- County
- Saint Clair County · 169,691 people
- City population
- 19,956
- Metro
- St. Louis, MO-IL
- Population (ZIP)
- 12,959
- Household income
- $33,838
- Rent vs Own
- Severe rent burden
- 729.0
Population outlook (St. Clair County) Hauer SSP2
- Today (2025)
- 250,366 people
- By 2030
- 240,511 · -3.9%
- By 2040
- 217,391 · -13.2%
- By 2050
- 192,699 · -23.0%
- By 2075
- 140,637 · -43.8%
- By 2100
- 100,499 · -59.9%
Race, ethnicity, and origin ACS 2023
- Neighborhood character
- Diverse neighborhood (Simpson 0.56)
- Race & ethnicity
- Black 59% White 29% Two or more races 6% Hispanic / Latino 3% Asian 2%
- Common ancestry
- Romanian 2% Lithuanian 1% Iranian 1%
- Foreign-born
- 2% · China
- Languages at home
- 95% English-only · Spanish 3% Other Indo-European 1% Chinese 1%
Political lean MEDSL · St. Clair
- 2024 margin
- Lean D (+7.9) · D 53.0% · R 45.1% · Other 1.8%
- 2008→2024 swing
- -14.6pp toward R · 2008: 22.4pp · 2024: 7.9pp
- All cycles
- 2024: D+7.9 2020: D+8.7 2016: D+5.6 2012: D+14.5 2008: D+22.4
Not yet ingested
- Civics
- —
Market trends
- HPI YoY
- ▼ -33.26%
- Current HPI
- 131.5144
- Rent YoY
- —
- Metro
- St. Louis, MO-IL
- State GDP YoY
- ▲ 1.59%
- F500 in state
- 60
Industry mix (Fortune 500 HQ in IL)
| Industry | F500 HQs | Revenue |
|---|---|---|
| Insurance | 4 | $201B |
|
||
| Consumer Goods | 4 | $87B |
|
||
| Industrial Machinery | 3 | $64B |
|
||
| Healthcare | 2 | $55B |
|
||
| Retail / Pharmacy | 1 | $148B |
|
||
| Agriculture / Food | 1 | $86B |
|
||
Price history
+197.4% since first listed5 events — show timeline
- 2026-03-25 Listed $69,900 MARIS as Distributed by MLS Grid
- 2025-12-06 Listed for Rent $850 MARIS
- 2018-08-14 Sold (Public Records) $52,000 Public Records
- 2006-04-26 Sold (Public Records) $48,000 Public Records
- 1991-05-22 Sold (Public Records) $23,500 Public Records
Property tax history
-25.9%/yrLatest (2024): $49 · -97.7% YoY. Source: county tax records.
Cash-flow waterfall
monthlySold comps — $/sqft
last 12 mo · ≤1 miLoading sold comps…