3853 68th Ave NE · Orangetree, FL
Flood risk 1/10 · Minimal
- FEMA flood zone
- AH
- Chance of flooding over 30 yrs
- 0.0%
- Est. flood insurance / yr
- $1,142 – $2,507
Fire risk 6/10 · Moderate
- Est. fire insurance / yr
- $947 – $1,759
Heat risk 10/10 · Severe
- Hot days now (above 110°F)
- 7 days/yr
- Hot days in 30 yrs
- 29 days/yr
Wind risk 10/10 · Severe
- Chance of severe wind over 30 yrs
- 99.0%
Air-quality risk 1/10 · Minimal
- Unhealthy air days now
- 0 days/yr
- Unhealthy air days in 30 yrs
- 0 days/yr
Risk factors via First Street. Map © Google.
Why this score? — see what drove the D grade
The composite is a weighted blend of 9 inputs, each scored 0–100. Each bar is that input's sub-score; the figure is the points it added to the 100-point composite (weight × sub-score).
- Cash flow +15.7/30.0
- ARV discount +7.5/15.0
- Schools +5.0/10.0
- DSCR +4.8/10.0
- Livability +3.2/5.0
- 1% rule +3.0/10.0
- Condition / age +2.5/5.0
- Rent growth +2.1/5.0
- Appreciation +0.0/10.0
$400,000
🖨 Deal sheet (PDF) 📄 Offer letter ✓ Due diligence
Listing remarks
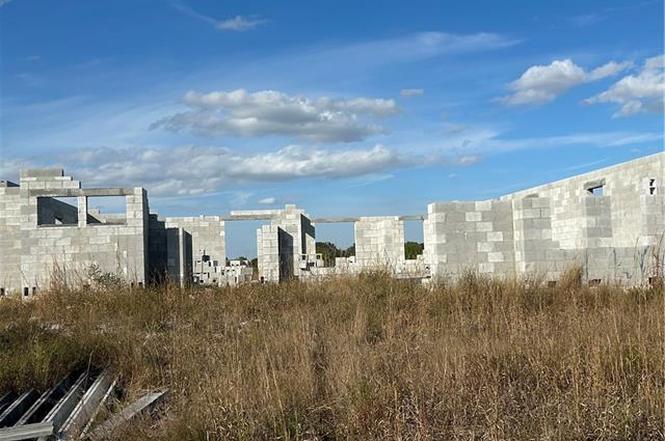
CASH ONLY SALE, HOME is UNDER CONSTRUCTION. Home is being sold in AS IS condition. 3 bedrooms plus den, lanai, 2 car garage. Lot is 100% upland, attached is TEC Report and Floor Plan. Buyer TO ASSUME PROJECT AND COMPLETE CONSTRUCTION AFTER CLOSING.
Key facts
- 2.73 acre lot
- 2 garage spots
- Built 2026
Property features AI
Finance
- Other: Property located in Golden Gate Estates development; Lot size approximately 2.73 acres
- HOA & community: No homeowner maintenance fees; Community is non-gated; Community amenities note: horses OK
Exterior
- Parking: Attached 2-car garage
- Utilities: Well water; Septic sewer
- Home design: Single-family residential property; Florida-style design; One story; Rear exposure faces north
- Construction: Concrete block construction; Shingle roof; Built in 2026; Surveyed lot dimensions
- Exterior features: Wooded area view; Horses allowed on the lot; Public road access
Interior
- Kitchen: Kitchen with island
- Bedrooms: 3 bedrooms plus a den; Master bedroom on ground level
- Flooring: Concrete floors
- Bathrooms: 2 full bathrooms; No master bath described
- Interior features: See remarks for additional interior details; Open porch/lanai; Den (study); Split bedroom floor plan; Dining area combined with living
- Laundry & utility: Laundry in residence (in-unit)
Neighborhood map
What this means for you Summary
Snapshot
- This is a 3-bed/2.0-bath land listed at $400k.
Deal economics
- At list price, monthly cash flow is $22 ($267/yr) — positive.
- The deal already cash-flows at list — no discount required.
- To meet the 1% rule (rent ≥ 1% of price), the offer needs to be $319k (20.2% below list).
- Recommended offer: $319k (20.2% below list) — sets the bar for 1% rule.
Location & tenants
- Location reads 65/100 on livability (#636 in FL) — a middle-class / working-renter tenant base. Strengths: crime A+, employment A+, housing A+; Watch: health & safety D, amenities F, commute F.
- Collier (suburban): math 60% / reading 56% proficiency, ranked #16 of 73 in FL (top 22%) — acceptable for families but not a draw, mixed tenant base, ~2y average lease.
- Zoned schools: Estates Elementary School (math 70% / reading 67%, grade B+, #409 of 2,144 statewide, top 20%, 862 students, 53% FRL); Corkscrew Middle School (math 68% / reading 59%, grade B+, #109 of 571 statewide, top 19%, 958 students, 43% FRL); Palmetto Ridge High School (math 43% / reading 51%, grade D-, #207 of 667 statewide, top 32%, 2,347 students, 38% FRL).
- Market conditions: Rents soft (-1.6%/yr); 1132 active listings in the ZIP; 1 comparable units currently listed for rent nearby; solid renter incomes; 3,520 units permitted in Collier County in 2024 (959 in 5+ unit buildings).
- This rent runs 41% of the median local income ($94k/yr) — at the standard rent-burdened threshold; future hikes will face affordability resistance.
Forward outlook
- Local home prices are declining (-3.0%/yr); year-one equity from $3k of loan paydown is wiped out by about $12k of value loss. Plan a longer hold.
- Collier County population projected at +30% by 2050 — long-run rental-demand tailwind backs the buy-and-hold thesis.
Negotiation context
- It's been on market 137 days — a 12% lower offer ($352k) is reasonable based on typical stale-listing flexibility.
- Current owner paid $24k; list at $400k implies a 1602% gain — meaningful room to come down on a strong offer.
Risks & watch-outs
- Watch-outs: flood insurance adds $152/mo.
- Climate carrying-cost: in FEMA flood zone AH (mandatory federal flood insurance); severe wind risk, 99% chance of damaging wind over 30y; major wildfire risk; extreme-heat days projected 7→29/yr by 2055 (HVAC capex compounding) — expect insurance premiums to compound above CPI over the hold.
Questions for the listing agent
- It's been on market 137 days. Have you received any prior offers? Is the seller open to a 20% concession, seller financing, or rate buy-down credit?
- What's the actual annual flood-insurance premium (NFIP or private), and is the property in a SFHA with mandatory coverage?
- Why hasn't it sold? Are there any deal-killer items the seller is aware of (foundation, flood, title, zoning, code violations)?
- Is there a deadline driving the sale (1031 exchange, divorce, estate, relocation)? That informs how much negotiation room exists.
- Schools are D-rated, which usually means shorter tenancies and higher turnover. Who's the typical renter profile here, and what's been the actual vacancy rate?
- The area grade is low — what's the realistic commute time and amenity access for the typical tenant pool here? Any planned neighborhood developments (good or bad) we should know about?
- What's the average days-on-market for RENTAL listings here right now (not sales)? A rising rental-DOM trend means longer vacancies and softer asking-rent achievability than the comps imply.
- What's the recent tenant-quality profile in this submarket — average credit score on applications, eviction rate, late-payment / NSF rate, and stable-employment percentage? A property-management company in the area should have these aggregated.
- How much new for-sale + rental construction is in the pipeline within 1–3 miles? Heavy new supply typically softens prices + rents 12–24 months out; constrained supply supports both.
Investment metrics
- 1% rule
- 0.80% ✗
- Cap rate
- 6.82%
- Cash-on-cash
- 1.87%
- DSCR
- 1.08
- GRM
- 10.4
CMA / ARV
No comps found within radius.
Projected returns pro-forma
-3.0% appreciation · 0.0% rent growth · sell at horizon
- IRR
- -19.1%
- Equity multiple
- 0.35×
- Total profit
- $-72,869
- Equity at exit
- $59,641
- IRR
- -18.5%
- Equity multiple
- 0.12×
- Total profit
- $-98,244
- Equity at exit
- $34,585
Cash invested: $112,000 (down + closing). Projections, not guarantees.
Landlord ↔ Tenant lean methodology
- Overall (STATE)
- 87 Strongly Landlord-Friendly
- State Florida
- 87 Strongly Landlord-Friendly · R+3
- County
- — inherits STATE
- City
- — inherits STATE
ZIP-level market 34120
- Rents YoY
- -1.6%
- Active inventory
- 1132
- Price-to-rent
- 10.4×
Monthly cashflow live
- Estimated rent
- $3,192 medium interval (Pro) →
- Mortgage (P&I)
- −$2,098
- Tax from tax record
- −$83 /mo · $994/yr
- Insurance
- −$167
- Flood insurance flood zone
- −$152 /mo · $1,824/yr
- HOA
- −$0
- Vacancy / Maint / Mgmt
- −$670
- Net cashflow
- $22
Break-even live
Sensitivity live
| Price | -10% $249 | -5% $135 | +0% $22 | +5% $-91 | +10% $-204 |
|---|---|---|---|---|---|
| Rent | -10% $-230 | -5% $-104 | +0% $22 | +5% $148 | +10% $274 |
| Rate | -1.0pp $224 | -0.5pp $124 | base $22 | +0.5pp $-81 | +1.0pp $-187 |
UW: 25.0% down · 7.5% · 30yr · 1.5% tax · 5.0% vac · 8.0% maint · 8.0% mgmt
Financing live
Cash to close
- Down payment
- $100,000
- Closing costs
- $12,000
- Reserves months
- —
- Total cash needed
- —
Loan-product check · same deal, 3 products live
Conventional
25% down · 7.5% · 30yr
- Down + closing
- —
- Monthly P&I
- —
- Monthly cashflow
- —
- DSCR
- —
- Eligible?
- —
Personal DTI + credit; lowest rate.
DSCR
20% down · 8.5% · 30yr
- Down + closing
- —
- Monthly P&I
- —
- Monthly cashflow
- —
- DSCR
- —
- Eligible?
- —
No personal income docs; deal must DSCR.
Hard money
10% down · 12.0% · 12mo
- Down + closing
- —
- Monthly P&I
- —
- Monthly cashflow
- —
- DSCR
- —
- Eligible?
- —
Short-term bridge; refi at stabilization.
Rent comps 1 comps
| Address | Beds | Baths | Sqft | Rent | $/sqft | DOM | Units | Dist |
|---|---|---|---|---|---|---|---|---|
| 22478 Immokalee Rd Naples, FL | 4.0 | 2.0 | 2000 | $3,900 | $1.95 | 25d | 1 | 0.67mi |
Listing history 17 events
-
2026-06-21days on market $400,000 Active 137 DOM
-
2026-06-18days on market $400,000 Active 134 DOM
-
2026-06-17days on market $400,000 Active 133 DOM
-
2026-06-16days on market $400,000 Active 132 DOM
-
2026-06-15days on market $400,000 Active 131 DOM
-
2026-06-14days on market $400,000 Active 129 DOM
-
2026-06-10days on market $400,000 Active 126 DOM
-
2026-06-09days on market $400,000 Active 125 DOM
-
2026-06-08days on market $400,000 Active 124 DOM
-
2026-06-07days on market $400,000 Active 123 DOM
-
2026-06-03days on market $400,000 Active 119 DOM
-
2026-06-02days on market $400,000 Active 118 DOM
-
2026-06-01days on market $400,000 Active 117 DOM
-
2026-05-31days on market $400,000 Active 116 DOM
-
2026-05-30days on market $400,000 Active 115 DOM
-
2026-02-05$400,000 Active
-
2002-07-12soldstatus $23,500
ⓘ Source: listings_history table (triggers on properties + properties_extension) + one-shot
backfill from property_details.listing_events for pre-trigger history.
Tax reassessment forecast FL · Resets to sale price
- Current annual tax
- $994 · $83/mo
- Projected year-2 tax
- $3,320 · $277/mo
- Expected delta
- +$2,326/yr (+$194/mo · 233.8%)
ⓘ Screening estimate from a state-policy table — verify with the county assessor before closing.
Climate risk First Street
- Flood 1/10 Low FEMA zone AH · 0% chance over 30 yrs
- Wildfire 6/10 Major
- Heat 10/10 Extreme 7 d/yr ≥110°F today · 29 d/yr by 30 yrs out
- Wind 10/10 Extreme 99% chance of damaging wind over 30 yrs
- Air quality 1/10 Low 0 unhealthy d/yr today · 0 by 30 yrs out
Nearby sold comps map
Loading sold comps map…
Walkable amenities ~0.75 mi
Loading nearby amenities…
Taxation est. · year 1
- Rental income
- $38,301
- − Mortgage interest
- −$22,406
- − Property taxes
- −$994
- − Insurance
- −$3,824
- − Repairs & maintenance
- −$3,064
- − Management
- −$3,064
- − Depreciation
- −$11,636
- Taxable loss
- −$6,689
- Est. tax savings @ 24.0%
- +$1,605
- After-tax cash flow
- $1,872/yr
For passive investors: Depreciation is non-cash, so a rental often shows a tax loss while cash-flowing — sheltering income. Rental losses are passive: they offset passive income freely, and up to $25,000/yr can offset ordinary (W-2) income if you actively participate and your MAGI is under $100k (phasing out to $0 by $150k); unused losses carry forward. On sale, claimed depreciation is recaptured at up to 25%, and gains may owe capital-gains tax (a 1031 exchange can defer both). Figures are a year-1 estimate at your 24.0% rate — not tax advice; consult a CPA.
Schools (NCES district)
- District
- Collier
- NCES district ID
- 1200330
- Math proficiency
- 60% ▼ -4.00%
- Reading proficiency
- 56% ▼ -2.00%
- Median HH income
- $58,275
- Composite
- 50.23/100
- National rank
- #1892
- State rank
- #16 of 73 in FL
Livability — Orangetree
- Score
- 65/100
- State rank
- #636
- US rank
- #12453
Category grades
Schools grade is shown separately in the Schools card above.
Census & demographics
- County
- Collier County · 396,295 people
- Metro
- Naples-Marco Island, FL
- Population (ZIP)
- 42,345
- Household income
- $93,861
- Rent vs Own
- Severe rent burden
- 409.0
Population outlook (Collier County) Hauer SSP2
- Today (2025)
- 420,858 people
- By 2030
- 450,054 · +6.9%
- By 2040
- 502,232 · +19.3%
- By 2050
- 544,932 · +29.5%
- By 2075
- 627,203 · +49.0%
- By 2100
- 659,015 · +56.6%
Race, ethnicity, and origin ACS 2023
- Neighborhood character
- Diverse neighborhood (Simpson 0.58)
- Race & ethnicity
- White 56% Hispanic / Latino 32% Two or more races 23% Black 8% Asian 2%
- Hispanic origin (detail)
- Mexican 8% Puerto Rican 2% Cuban 13%
- Common ancestry
- Hispanic 4% Romanian 3% Italian 2%
- Foreign-born
- 28% · Canada, Jamaica, China
- Languages at home
- 62% English-only · Spanish 28% French/Haitian/Cajun 5% Other Indo-European 3%
Political lean MEDSL · Collier
- 2024 margin
- Solid R (+33.1) · D 33.1% · R 66.2%
- 2008→2024 swing
- -10.6pp toward R · 2008: -22.5pp · 2024: -33.1pp
- All cycles
- 2024: R+33.1 2020: R+24.7 2016: R+26.0 2012: R+30.1 2008: R+22.5
Not yet ingested
- Civics
- —
Market trends
- HPI YoY
- ▼ -223.18%
- Current HPI
- 316.2474
- Rent YoY
- ▼ -1.65%
- Metro
- Naples-Marco Island, FL
- State GDP YoY
- ▲ 3.28%
- F500 in state
- 36
Industry mix (Fortune 500 HQ in FL)
| Industry | F500 HQs | Revenue |
|---|---|---|
| Industrial Technology | 2 | $29B |
|
||
| Insurance | 2 | $17B |
|
||
| Retail | 1 | $60B |
|
||
| Technology Distribution | 1 | $58B |
|
||
| Homebuilding | 1 | $35B |
|
||
| Technology Manufacturing | 1 | $35B |
|
||
Price history
+1602.1% since first listed2 events — show timeline
- 2026-02-05 Listed $400,000 NAPLESMLS
- 2002-07-12 Sold (Public Records) $23,500 Public Records
Property tax history
+19.3%/yrLatest (2025): $994 · +1.6% YoY. Source: county tax records.
Cash-flow waterfall
monthlySold comps — $/sqft
last 12 mo · ≤1 miLoading sold comps…