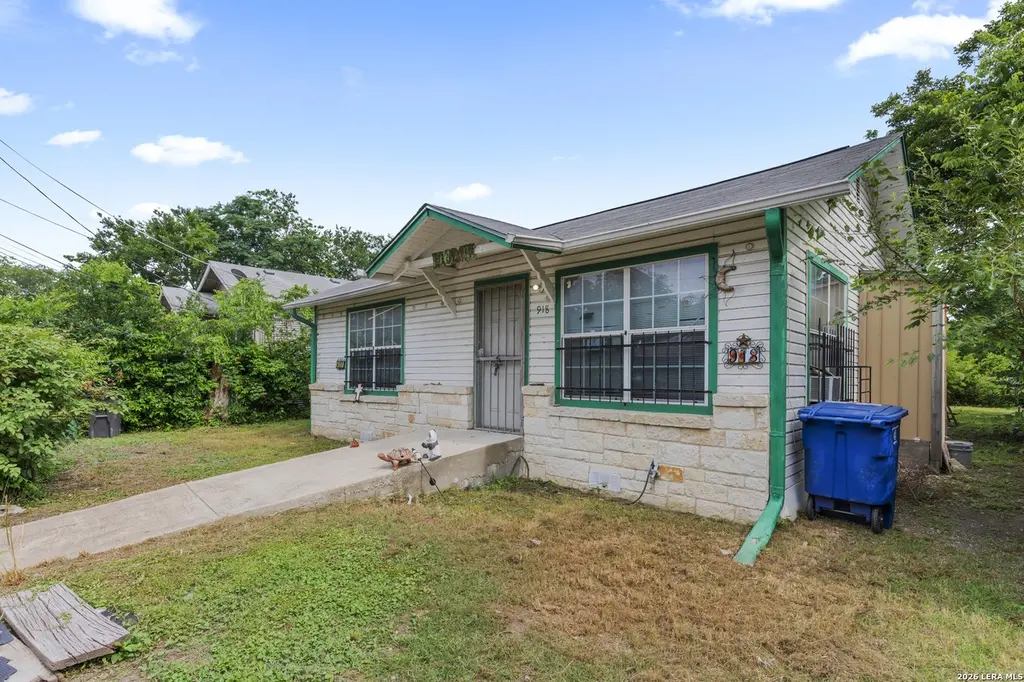
918 Cecilia St · San Antonio, TX
Flood risk 1/10 · Minimal
- FEMA flood zone
- X (unshaded)
- Chance of flooding over 30 yrs
- 0.0%
- Est. flood insurance / yr
- $507 – $1,088
Fire risk 1/10 · Minimal
- Est. fire insurance / yr
- $1,222 – $2,270
Heat risk 8/10 · Major
- Hot days now (above 109°F)
- 7 days/yr
- Hot days in 30 yrs
- 22 days/yr
Wind risk 6/10 · Moderate
- Chance of severe wind over 30 yrs
- 77.0%
Air-quality risk 2/10 · Minimal
- Unhealthy air days now
- 1 days/yr
- Unhealthy air days in 30 yrs
- 2 days/yr
Risk factors via First Street. Map © Google.
Why this score? — see what drove the C- grade
The composite is a weighted blend of 9 inputs, each scored 0–100. Each bar is that input's sub-score; the figure is the points it added to the 100-point composite (weight × sub-score).
- Cash flow +14.4/30.0
- Appreciation +10.0/10.0
- ARV discount +6.3/15.0
- DSCR +4.4/10.0
- Rent growth +4.4/5.0
- 1% rule +4.0/10.0
- Livability +4.0/5.0
- Condition / age +2.5/5.0
- Schools +1.4/10.0
$99,900
🖨 Deal sheet 📄 Offer letter ✓ Due diligence
Listing remarks
Opportunity, function, and location come together at 918 Cecilia St. This single story home offers a practical 3 bedroom, 1 bath layout with two living areas, an eat in kitchen, interior utility room, front parking, a fenced lot, and a backyard storage shed. The home has the kind of simple, usable floor plan that makes sense quickly when you walk it, with space that can serve everyday living, rental potential, or future personalization. The fenced front entry, mature shade, rear storage, and central San Antonio location add to the practical appeal. Located near Zarzamora, Guadalupe St, downtown San Antonio, local shopping, schools, and everyday conveniences, this property offers an approach
Key facts
- Mature shade
- Fenced front entry
- Fenced lot
Tags
Property features AI
Finance
- Other: Possession at closing/funding; Offered for sale
- HOA & community: Subdivision: 26TH/ZARZAMORA; Subdivision legal description: NCB 6372
Exterior
- Utilities: CPS Energy electric service; SAWS water service; SAWS sewer service; Water system and sewer system
- Home design: Pre-owned home; Approximate age: 74 years
- Construction: Composition roof
- Exterior features: Stone/rock and siding exterior
Interior
- Kitchen: Eat-in kitchen (11 x 12)
- Bedrooms: Master bedroom on lower level (12 x 12); Second bedroom (11 x 12); Third bedroom (12 x 12)
- Flooring: Ceramic tile floor; Laminate floor
- Bathrooms: One full bathroom
- Heating & cooling: Electric heat; Window unit heating; Three or more window air conditioning units
- Interior features: Two living areas; Eat-in kitchen; Utility room inside; All window coverings remain; Vent fan
- Laundry & utility: Washer connection; Dryer connection; Laundry on main level; Utility room (8 x 7)
Neighborhood map
What this means for you Summary
Snapshot
- This is a 2-bed/1.0-bath single-family listed at $100k.
Deal economics
- At list price, monthly cash flow is $21 ($251/yr) — positive.
- The deal already cash-flows at list — no discount required.
- To meet the 1% rule (rent ≥ 1% of price), the offer needs to be $90k (9.6% below list).
- Recommended offer: $90k (9.6% below list) — sets the bar for 1% rule.
- Cap rate 6.5% vs local median 3.8% in San Antonio — top-decile yield for the area; either an underpriced asset or a hidden risk that comps aren't pricing in. Stress-test before assuming the spread holds.
Location & tenants
- Location reads 80/100 on livability (#31 in TX, #1,616 nationally) — a professional / high-income tenant draw. Strengths: amenities A+, commute A+, cost of living A+; Watch: crime F.
- San Antonio ISD (urban): math 12% / reading 22% proficiency, ranked #805 of 826 in TX (top 98%) — low school quality limits family demand, transient renter base, plan for 1-2y turnover; 80% free/reduced lunch — lower-income household profile, screen leases tightly.
- Zoned schools: Ogden El (math 4% / reading 9%, grade F, #4,313 of 4,322 statewide, top 100%, 384 students, 97% FRL, charter); Lanier H S (math 9% / reading 15%, grade F, #1,554 of 1,632 statewide, top 95%, 1,547 students, 97% FRL) — zoned schools average 97% FRL vs 80% district-wide (17 pts higher); higher-poverty schools than district average — tighter screening recommended.
- Market conditions: Rents rising fast (+7.7%/yr); 154 active listings in the ZIP; 18 comparable units currently listed for rent nearby; rentals at typical pace (median 24d on market — plan ~3-4 weeks tenant-placement turnaround); lower-income renter base — watch delinquency; 8,308 units permitted in Bexar County in 2024 (2,506 in 5+ unit buildings).
- This rent runs 33% of the median local income ($32k/yr) — at the standard rent-burdened threshold; future hikes will face affordability resistance.
Forward outlook
- In year one you build about $11k of equity ($691 loan paydown + $10k appreciation (10.0% local appreciation)).
- Bexar County population projected at +50% by 2050 — long-run rental-demand tailwind backs the buy-and-hold thesis.
- At projected returns (10.0% appreciation + 7.7% rent growth), your $28k cash investment doubles in ~3 years — after that, you're playing with house money.
- By year 4, paydown + projected appreciation supports a ~$38k cash-out refi (75% LTV) — recoverable capital for the next deal without selling this one.
Negotiation context
- It's been on market 27 days — a 2% lower offer ($98k) is reasonable based on typical stale-listing flexibility.
Risks & watch-outs
- Watch-outs: built in 1952 — expect roof / HVAC / electrical / plumbing capex.
- Climate carrying-cost: major wind risk, 77% chance of damaging wind over 30y; extreme-heat days projected 7→22/yr by 2055 (HVAC capex compounding) — expect insurance premiums to compound above CPI over the hold.
Questions for the listing agent
- Built in 1952 — when were the roof, HVAC, electrical panel, plumbing, and water heater last replaced?
- Is there a deadline driving the sale (1031 exchange, divorce, estate, relocation)? That informs how much negotiation room exists.
- Crime grade is F in this area — have there been break-ins, vandalism, or insurance claims at this property in the last 3 years? What carrier currently insures it and at what premium?
- What's the average days-on-market for RENTAL listings here right now (not sales)? A rising rental-DOM trend means longer vacancies and softer asking-rent achievability than the comps imply.
- What's the recent tenant-quality profile in this submarket — average credit score on applications, eviction rate, late-payment / NSF rate, and stable-employment percentage? A property-management company in the area should have these aggregated.
- How much new for-sale + rental construction is in the pipeline within 1–3 miles? Heavy new supply typically softens prices + rents 12–24 months out; constrained supply supports both.
Investment metrics
- 1% rule
- 0.90% ✗
- Cap rate
- 6.54%
- Cash-on-cash
- 0.90%
- DSCR
- 1.04
- GRM
- 9.2
CMA / ARV
- ARV (on-the-fly)
- $97,200
- Comps found
- 12
Show comp detail 12 sales within ~0.75 mi
| Address | Dist | Beds/Ba | Sqft | Sold | Price | $/sf | Match |
|---|---|---|---|---|---|---|---|
| 3806 W Martin | 0.26mi | 2/1.0 | 672 (-7%) | 1mo | $93,000 | $138 | 76 |
| 1418 Rivas | 0.50mi | 2/1.0 | 696 (-3%) | 2mo | $139,900 | $201 | 70 |
| 511 N Spring St | 0.11mi | 1/1.0 (-1) | 658 (-9%) | 10mo | $90,000 | $137 | 68 |
| 1524 Delgado | 0.43mi | 2/1.0 | 720 (0%) | 16mo | $75,000 | $104 | 67 |
| 919 Monclova Aly | 0.21mi | 3/1.0 (+1) | 650 (-10%) | 8mo | $94,900 | $146 | 62 |
| 2039 Lyons | 0.46mi | 2/1.0 | 672 (-7%) | 10mo | $65,000 | $97 | 59 |
| 223 SW 19th St | 0.51mi | 2/1.0 | 680 (-6%) | 13mo | $72,000 | $106 | 56 |
| 1711 Leal St | 0.22mi | 2/1.0 | 816 (+13%) | 14mo | $110,000 | $135 | 56 |
| 3410 W Commerce St | 0.36mi | 2/1.0 | 804 (+12%) | 15mo | $65,000 | $81 | 51 |
| 1507 Leal St | 0.31mi | 3/1.0 (+1) | 818 (+14%) | 16mo | $65,000 | $79 | 45 |
| 4030 W Salinas | 0.62mi | 3/1.0 (+1) | 816 (+13%) | 5mo | $134,900 | $165 | 40 |
| 605 SW 19th St | 0.75mi | 2/1.0 | 816 (+13%) | 8mo | $74,900 | $92 | 36 |
Match score weights: distance 35% · size 25% · config 20% · recency 20%. Top-matched comps best support the ARV.
Projected returns pro-forma
10.0% appreciation · 7.73% rent growth · sell at horizon
- IRR
- 26.6%
- Equity multiple
- 3.15×
- Total profit
- $60,258
- Equity at exit
- $89,998
- IRR
- 24.7%
- Equity multiple
- 7.70×
- Total profit
- $187,472
- Equity at exit
- $194,084
Cash invested: $27,972 (down + closing). Projections, not guarantees.
Landlord ↔ Tenant lean methodology
- Overall (STATE)
- 87 Strongly Landlord-Friendly
- State Texas
- 87 Strongly Landlord-Friendly · R+5
- County
- — inherits STATE
- City
- — inherits STATE
ZIP-level market 78207
- Home prices YoY
- 15.2%
- Rents YoY
- 7.7%
- Active inventory
- 154
- Price-to-rent
- 9.2×
Monthly cashflow live
- Estimated rent
- $903 high interval (Pro) →
- Mortgage (P&I)
- −$524
- Tax from tax record
- −$127 /mo · $1,525/yr
- Insurance
- −$42
- HOA
- −$0
- Vacancy / Maint / Mgmt
- −$190
- Net cashflow
- $21
Break-even live
UW: 25.0% down · 7.5% · 30yr · 1.5% tax · 5.0% vac · 8.0% maint · 8.0% mgmt
Financing live
Cash to close
- Down payment
- $24,975
- Closing costs
- $2,997
- Reserves months
- —
- Total cash needed
- —
Loan-product check · same deal, 3 products live
Conventional
25% down · 7.5% · 30yr
- Down + closing
- —
- Monthly P&I
- —
- Monthly cashflow
- —
- DSCR
- —
- Eligible?
- —
Personal DTI + credit; lowest rate.
DSCR
20% down · 8.5% · 30yr
- Down + closing
- —
- Monthly P&I
- —
- Monthly cashflow
- —
- DSCR
- —
- Eligible?
- —
No personal income docs; deal must DSCR.
Hard money
10% down · 12.0% · 12mo
- Down + closing
- —
- Monthly P&I
- —
- Monthly cashflow
- —
- DSCR
- —
- Eligible?
- —
Short-term bridge; refi at stabilization.
Rent comps 18 comps
| Address | Beds | Baths | Sqft | Rent | $/sqft | DOM | Units | Dist |
|---|---|---|---|---|---|---|---|---|
| 1820 Ruiz St San Antonio, TX | 1.0 | 1.0 | 504 | $750 | $1.49 | 2d | 1 | 0.26mi |
| 321 N Chupaderas St Unit 101 San Antonio, TX | 1.0 | 1.0 | 410 | $790 | $1.93 | 43d | 1 | 0.55mi |
| 1033 Rivas St #301 San Antonio, TX | 2.0 | 1.0 | 640 | $925 | $1.45 | 43d | 1 | 0.66mi |
| 1033 Rivas St #301 San Antonio, TX | 2.0 | 1.0 | 640 | $895 | $1.40 | 10d | 1 | 0.66mi |
| 1218 NW 23rd St Unit 2 San Antonio, TX | 1.0 | 10.5 | 548 | $950 | $1.73 | 23d | 1 | 0.74mi |
| 2503 Arbor Pl San Antonio, TX | 2.0 | 1.0 | 750 | $800 | $1.07 | 43d | 1 | 0.79mi |
| 816 Rivas St Unit C San Antonio, TX | 2.0 | 1.0 | 500 | $750 | $1.50 | 43d | 1 | 0.85mi |
| 816 Rivas St San Antonio, TX | 1.0 | 1.0 | 500 | $750 | $1.50 | 16d | 1 | 0.85mi |
| 816 Rivas St San Antonio, TX | 1.0 | 1.0 | 500 | $750 | $1.50 | 4d | 1 | 0.85mi |
| 816 Rivas St Unit A San Antonio, TX | 2.0 | 1.0 | 650 | $799 | $1.23 | 23d | 1 | 0.85mi |
| 107 Beso Ln Unit 107-BL San Antonio, TX | 1.0 | 1.0 | 528 | $850 | $1.61 | 23d | 1 | 0.87mi |
| 2721 Colima St San Antonio, TX | 2.0 | 1.0 | 700 | $1,250 | $1.79 | 14d | 1 | 0.95mi |
| 3017 Colima St San Antonio, TX | 1.0 | 1.0 | 480 | $800 | $1.67 | 43d | 1 | 0.97mi |
| 107 Jesus Aly Unit 4 San Antonio, TX | 2.0 | 1.0 | 400 | $800 | $2.00 | 4d | 1 | 1.00mi |
| 107 Jesus Aly Unit 1 San Antonio, TX | 1.0 | 1.0 | 450 | $700 | $1.56 | 17d | 1 | 1.00mi |
| 1750 W Craig Pl San Antonio, TX | 1.0 | 1.0 | 420 | $990 | $2.36 | 43d | 1 | 1.39mi |
| 703 N San Marcos San Antonio, TX | 1.0 | 1.0 | 700 | $716 | $1.02 | 43d | 1 | 1.40mi |
| 2403 N Elmendorf St San Antonio, TX | 1.0 | 1.0 | 650 | $1,175 | $1.81 | 23d | 1 | 1.44mi |
Listing history 15 events
-
2026-06-18days on market $99,900 Active 27 DOM
-
2026-06-17days on market $99,900 Active 26 DOM
-
2026-06-16days on market $99,900 Active 25 DOM
-
2026-06-15statusdays on market $99,900 Active 24 DOM
-
2026-06-13days on market $99,900 Price Change 22 DOM
-
2026-06-09days on market $99,900 Price Change 18 DOM
-
2026-06-08days on market $99,900 Price Change 17 DOM
-
2026-06-07days on market $99,900 Price Change 16 DOM
-
2026-06-04pricestatusdays on market $99,900 Price Change 13 DOM
-
2026-06-03days on market $115,000 Active 12 DOM
-
2026-06-02statusdays on market $115,000 Active 11 DOM
-
2026-06-01days on market $115,000 New 10 DOM
-
2026-05-31days on market $115,000 New 9 DOM
-
2026-05-22$115,000 New
-
2003-10-09soldstatus
ⓘ Source: listings_history table (triggers on properties + properties_extension) + one-shot
backfill from property_details.listing_events for pre-trigger history.
Tax reassessment forecast TX · Resets to sale price
- Current annual tax
- $1,525 · $127/mo
- Projected year-2 tax
- $1,828 · $152/mo
- Expected delta
- +$303/yr (+$25/mo · 19.9%)
ⓘ Screening estimate from a state-policy table — verify with the county assessor before closing.
Climate risk First Street
- Flood 1/10 Low FEMA zone X (unshaded) · 0% chance over 30 yrs
- Wildfire 1/10 Low
- Heat 8/10 Severe 7 d/yr ≥109°F today · 22 d/yr by 30 yrs out
- Wind 6/10 Major 77% chance of damaging wind over 30 yrs
- Air quality 2/10 Low 1 unhealthy d/yr today · 2 by 30 yrs out
Nearby sold comps map
Loading sold comps map…
Walkable amenities ~0.75 mi
Loading nearby amenities…
Taxation est. · year 1
- Rental income
- $10,838
- − Mortgage interest
- −$5,596
- − Property taxes
- −$1,525
- − Insurance
- −$500
- − Repairs & maintenance
- −$867
- − Management
- −$867
- − Depreciation
- −$2,906
- Taxable loss
- −$1,423
- Est. tax savings @ 24.0%
- +$341
- After-tax cash flow
- $592/yr
For passive investors: Depreciation is non-cash, so a rental often shows a tax loss while cash-flowing — sheltering income. Rental losses are passive: they offset passive income freely, and up to $25,000/yr can offset ordinary (W-2) income if you actively participate and your MAGI is under $100k (phasing out to $0 by $150k); unused losses carry forward. On sale, claimed depreciation is recaptured at up to 25%, and gains may owe capital-gains tax (a 1031 exchange can defer both). Figures are a year-1 estimate at your 24.0% rate — not tax advice; consult a CPA.
Schools (NCES district)
- District
- San Antonio ISD
- NCES district ID
- 4838730
- Math proficiency
- 12% ▼ -21.00%
- Reading proficiency
- 22% ▼ -7.00%
- Median HH income
- $30,952
- Composite
- 13.57/100
- National rank
- #9512
- State rank
- #805 of 826 in TX
Livability — San Antonio
- Score
- 80/100
- State rank
- #31
- US rank
- #1616
Category grades
Schools grade is shown separately in the Schools card above.
Census & demographics
- Census place
- San Antonio, TX
- County
- Bexar County · 1,990,555 people
- City population
- 1,806,925
- Metro
- San Antonio-New Braunfels, TX
- Population (ZIP)
- 55,474
- Household income
- $32,472
- Rent vs Own
- Severe rent burden
- 2789.0
Population outlook (Bexar County) Hauer SSP2
- Today (2025)
- 2,336,851 people
- By 2030
- 2,560,728 · +9.6%
- By 2040
- 3,020,569 · +29.3%
- By 2050
- 3,493,522 · +49.5%
- By 2075
- 4,668,459 · +99.8%
- By 2100
- 5,533,242 · +136.8%
Race, ethnicity, and origin ACS 2023
- Neighborhood character
- Predominantly Hispanic (88%)
- Race & ethnicity
- Hispanic / Latino 88% Two or more races 41% White 6% Black 5% Native American 2%
- Hispanic origin (detail)
- Mexican 79%
- Foreign-born
- 19% · Canada
- Languages at home
- 39% English-only · Spanish 60%
Political lean MEDSL · Bexar
- 2024 margin
- Lean D (+9.8) · D 54.3% · R 44.6% · Other 1.1%
- 2008→2024 swing
- +4.2pp toward D · 2008: 5.6pp · 2024: 9.8pp
- All cycles
- 2024: D+9.8 2020: D+18.2 2016: D+13.5 2012: D+4.6 2008: D+5.6
Not yet ingested
- Civics
- —
Market trends
- HPI YoY
- ▲ 34.92%
- Current HPI
- 264.7559
- Rent YoY
- ▲ 7.73%
- Metro
- San Antonio-New Braunfels, TX
- State GDP YoY
- ▲ 3.95%
- F500 in state
- 110
Industry mix (Fortune 500 HQ in TX)
| Industry | F500 HQs | Revenue |
|---|---|---|
| Energy | 16 | $1,198B |
|
||
| Technology | 5 | $198B |
|
||
| Engineering / Construction | 4 | $72B |
|
||
| Energy Services | 3 | $60B |
|
||
| Utilities | 3 | $41B |
|
||
| Healthcare | 2 | $330B |
|
||
Price history
2 events — show timeline
- 2026-05-22 Listed $115,000 LERA
- 2003-10-09 Sold (Public Records) — Public Records
Property tax history
+4.9%/yrLatest (2025): $1,525 · +10.0% YoY. Source: county tax records.
Cash-flow waterfall
monthlySold comps — $/sqft
last 12 mo · ≤1 miLoading sold comps…