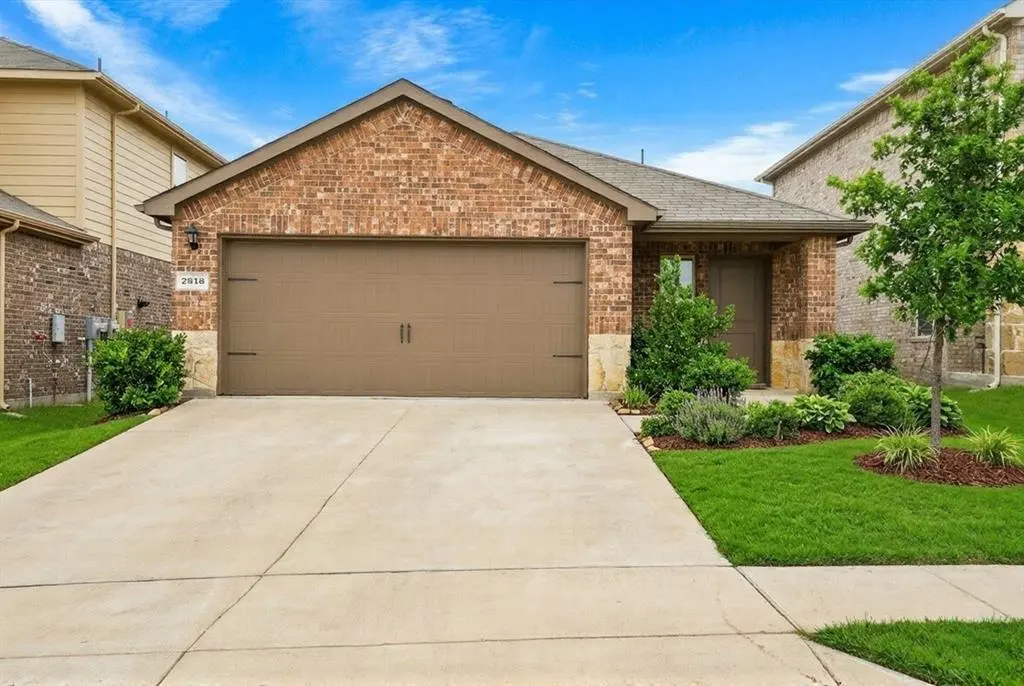
2818 Highgarden Trl · Heartland, TX
Flood risk 1/10 · Minimal
- FEMA flood zone
- X (unshaded)
- Chance of flooding over 30 yrs
- 0.0%
- Est. flood insurance / yr
- $507 – $1,088
Fire risk 6/10 · Moderate
- Est. fire insurance / yr
- $1,222 – $2,270
Heat risk 7/10 · Major
- Hot days now (above 110°F)
- 7 days/yr
- Hot days in 30 yrs
- 25 days/yr
Wind risk 6/10 · Moderate
- Chance of severe wind over 30 yrs
- 27.0%
Air-quality risk 2/10 · Minimal
- Unhealthy air days now
- 1 days/yr
- Unhealthy air days in 30 yrs
- 1 days/yr
Risk factors via First Street. Map © Google.
Why this score? — see what drove the D grade
The composite is a weighted blend of 9 inputs, each scored 0–100. Each bar is that input's sub-score; the figure is the points it added to the 100-point composite (weight × sub-score).
- ARV discount +15.0/15.0
- Cash flow +7.8/30.0
- 1% rule +4.6/10.0
- Condition / age +4.0/5.0
- Schools +3.6/10.0
- Rent growth +2.5/5.0
- Livability +2.5/5.0
- DSCR +1.9/10.0
- Appreciation +0.0/10.0
$209,900
🖨 Deal sheet (PDF) 📄 Offer letter ✓ Due diligence
Listing remarks
Welcome to 2818 Highgarden Trail, a beautifully crafted newer construction home located in the highly sought-after Wildcat Ranch community in Crandall, TX—one of the fastest-growing areas for buyers looking to relocate near Dallas with more space and affordability. This move-in ready 3-bedroom, 2-bath home offers a modern open-concept floor plan designed for today’s lifestyle, seamlessly connecting the spacious living room, dining area, and gourmet kitchen—perfect for entertaining and everyday living. The kitchen features ample counter space, modern cabinetry, and a functional layout ideal for home chefs. Large windows throughout the home provide abundant natural light, cr
Key facts
- Gourmet kitchen
- Ensuite bath
- 4,400 sq ft lot
Tags
Property features AI
Finance
- Other: No restrictions; Not in a municipal utility district; Green features: 12-inch+ attic insulation, HVAC efficiency, low-flow commode, rain/freeze sensors, low-flow fixtures
- HOA & community: Mandatory HOA; HOA semi-annual fee (covers full use of facilities); HOA managed by FirstService Residential, Texas
Exterior
- Parking: 2 covered parking spaces; 2-car attached garage; Driveway; Garage faces front
- Utilities: City water; City sewer; Cable available; Underground utilities
- Home design: Single-family residence; Attached property; Built in 2020; One story
- Construction: Brick construction; Composition/shingle roof; Slab foundation
- Exterior features: Covered porch(es); Gutters; Exterior lighting; Wood fencing; Interior lot
Interior
- Kitchen: Dishwasher; Disposal; Electric cooktop; Electric oven; Microwave; Vented exhaust fan; Breakfast bar; Built-in cabinets; Granite countertops; Pantry and walk-in pantry; Water line to refrigerator
- Bedrooms: Primary bedroom (main level); Two additional bedrooms (main level)
- Bathrooms: 2 full bathrooms
- Heating & cooling: Central heating (electric); Central air conditioning; Ceiling fans
- Interior features: Cable TV available; High-speed internet available; One living area; One dining area; Total room count: 8; One level (single-story)
- Laundry & utility: Separate utility room with built-in cabinets
Neighborhood map
What this means for you Summary
Snapshot
- This is a 3-bed/2.0-bath single-family listed at $210k. Condition is rated good.
Deal economics
- At list price, monthly cash flow is $-230 ($-3k/yr) — negative.
- To cash-flow at today's rent, offer at most $169k (19.4% below list).
- To meet the 1% rule (rent ≥ 1% of price), the offer needs to be $201k (4.2% below list).
- Recommended offer: $169k (19.4% below list) — sets the bar for cash-flow.
Location & tenants
- Location reads: area grade D — affects rentability + tenant quality, not the cash-flow math above.
- Crandall ISD (rural): math 36% / reading 42% proficiency, ranked #351 of 826 in TX (top 42%) — families likely to look elsewhere, expect single-tenant / working-renter base with shorter leases.
- Zoned schools: Nola Kathryn Wilson El (math 40% / reading 45%, grade F, #1,313 of 4,322 statewide, top 31%, 596 students, 59% FRL); Crandall Middle (math 38% / reading 42%, grade F, #646 of 1,662 statewide, top 40%, 983 students, 60% FRL); Crandall H S (math 33% / reading 53%, grade F, #713 of 1,632 statewide, top 44%, 1,707 students, 56% FRL) — zoned schools average 58% FRL vs 41% district-wide (17 pts higher); higher-poverty schools than district average — tighter screening recommended.
- Market conditions: 802 active listings in the ZIP; 40 comparable units currently listed for rent nearby; rentals at typical pace (median 27d on market — plan ~3-4 weeks tenant-placement turnaround); solid renter incomes; 1,747 units permitted in Kaufman County in 2024 (180 in 5+ unit buildings).
Forward outlook
- Local home prices are declining (-3.0%/yr); year-one equity from $1k of loan paydown is wiped out by about $6k of value loss. Plan a longer hold.
- Kaufman County population projected at +43% by 2050 — long-run rental-demand tailwind backs the buy-and-hold thesis.
Negotiation context
- It's been on market 15 days — a 2% lower offer ($207k) is reasonable based on typical stale-listing flexibility.
- 5 sale attempts since 2y ago with the ask held roughly flat each time — persistent listings suggest the price (not the market) is what's stuck; bring a comps-based counter.
Risks & watch-outs
- Watch-outs: property tax is 3.3% of price.
- Climate carrying-cost: major wind risk, 27% chance of damaging wind over 30y; major wildfire risk; extreme-heat days projected 7→25/yr by 2055 (HVAC capex compounding) — expect insurance premiums to compound above CPI over the hold.
Questions for the listing agent
- What do current leases actually rent for vs. the listed asking? Can we see a recent rent roll and the last 12 months of T-12 income?
- Property tax is high relative to price — has the assessment been appealed recently, and will the sale trigger a re-assessment?
- What does the HOA fee cover, when was the last increase, and are there any pending special assessments or reserve-fund shortfalls?
- Is there a deadline driving the sale (1031 exchange, divorce, estate, relocation)? That informs how much negotiation room exists.
- The area grade is low — what's the realistic commute time and amenity access for the typical tenant pool here? Any planned neighborhood developments (good or bad) we should know about?
- What's the average days-on-market for RENTAL listings here right now (not sales)? A rising rental-DOM trend means longer vacancies and softer asking-rent achievability than the comps imply.
- What's the recent tenant-quality profile in this submarket — average credit score on applications, eviction rate, late-payment / NSF rate, and stable-employment percentage? A property-management company in the area should have these aggregated.
- How much new for-sale + rental construction is in the pipeline within 1–3 miles? Heavy new supply typically softens prices + rents 12–24 months out; constrained supply supports both.
Investment metrics
- 1% rule
- 0.96% ✗
- Cap rate
- 4.98%
- Cash-on-cash
- -4.70%
- DSCR
- 0.79
- GRM
- 8.7
CMA / ARV
- ARV (median comp)
- $253,253
- List price
- $209,900
- Delta
- -17.12%
- Verdict
- UNDERPRICED
- Comps
- 20 within 1.0 mi
Show comp detail 12 sales within ~0.75 mi
| Address | Dist | Beds/Ba | Sqft | Sold | Price | $/sf | Match |
|---|---|---|---|---|---|---|---|
| 3713 Pronghorn Ln | 0.34mi | 3/2.0 | 1,390 (-2%) | 1mo | $219,000 | $158 | 80 |
| 2213 Nightgrove Cir | 0.27mi | 3/2.0 | 1,500 (+6%) | 1mo | $223,000 | $149 | 77 |
| 2376 Great Belt Blvd | 0.48mi | 3/2.0 | 1,450 (+2%) | 1mo | $220,000 | $152 | 74 |
| 2529 Talus Run | 0.50mi | 3/2.0 | 1,396 (-2%) | 1mo | $267,240 | $191 | 73 |
| 3331 Watterson Way | 0.64mi | 3/2.0 | 1,416 (-0%) | 1mo | $230,000 | $162 | 69 |
| 2810 Bakers Bnd | 0.45mi | 3/2.0 | 1,335 (-6%) | 0mo | $275,740 | $207 | 68 |
| 2071 Wildcat Trl | 0.51mi | 3/2.0 | 1,480 (+4%) | 1mo | $244,900 | $165 | 68 |
| 3664 Mildren Bnd | 0.61mi | 3/2.0 | 1,451 (+2%) | 1mo | $239,999 | $165 | 67 |
| 2525 Talus Run | 0.51mi | 3/2.0 | 1,521 (+7%) | 1mo | $275,240 | $181 | 64 |
| 2826 Gose Ln | 0.58mi | 3/2.0 | 1,521 (+7%) | 2mo | $259,990 | $171 | 60 |
| 2228 Starling St | 0.70mi | 4/2.0 (+1) | 1,456 (+2%) | 1mo | $264,000 | $181 | 57 |
| 6022 Midsummer Dr | 0.73mi | 3/2.0 | 1,335 (-6%) | 1mo | $259,740 | $195 | 55 |
Match score weights: distance 35% · size 25% · config 20% · recency 20%. Top-matched comps best support the ARV.
Projected returns pro-forma
-3.0% appreciation · 3.0% rent growth · sell at horizon
- IRR
- -24.1%
- Equity multiple
- 0.18×
- Total profit
- $-48,402
- Equity at exit
- $31,297
- IRR
- -18.9%
- Equity multiple
- -0.02×
- Total profit
- $-59,964
- Equity at exit
- $18,148
Cash invested: $58,772 (down + closing). Projections, not guarantees.
Landlord ↔ Tenant lean methodology
- Overall (STATE)
- 87 Strongly Landlord-Friendly
- State Texas
- 87 Strongly Landlord-Friendly · R+5
- County
- — inherits STATE
- City
- — inherits STATE
ZIP-level market 75114
- Home prices YoY
- -26.7%
- Active inventory
- 802
- Price-to-rent
- 8.7×
Monthly cashflow live
- Estimated rent
- $2,012 high interval (Pro) →
- Mortgage (P&I)
- −$1,101
- Tax from tax record
- −$581 /mo · $6,972/yr
- Insurance
- −$87
- HOA
- −$50
- Vacancy / Maint / Mgmt
- −$422
- Net cashflow
- $-230
Break-even live
Sensitivity live
| Price | -10% $-111 | -5% $-171 | +0% $-230 | +5% $-289 | +10% $-349 |
|---|---|---|---|---|---|
| Rent | -10% $-389 | -5% $-309 | +0% $-230 | +5% $-151 | +10% $-71 |
| Rate | -1.0pp $-124 | -0.5pp $-177 | base $-230 | +0.5pp $-284 | +1.0pp $-340 |
UW: 25.0% down · 7.5% · 30yr · 1.5% tax · 5.0% vac · 8.0% maint · 8.0% mgmt
Financing live
Cash to close
- Down payment
- $52,475
- Closing costs
- $6,297
- Reserves months
- —
- Total cash needed
- —
Loan-product check · same deal, 3 products live
Conventional
25% down · 7.5% · 30yr
- Down + closing
- —
- Monthly P&I
- —
- Monthly cashflow
- —
- DSCR
- —
- Eligible?
- —
Personal DTI + credit; lowest rate.
DSCR
20% down · 8.5% · 30yr
- Down + closing
- —
- Monthly P&I
- —
- Monthly cashflow
- —
- DSCR
- —
- Eligible?
- —
No personal income docs; deal must DSCR.
Hard money
10% down · 12.0% · 12mo
- Down + closing
- —
- Monthly P&I
- —
- Monthly cashflow
- —
- DSCR
- —
- Eligible?
- —
Short-term bridge; refi at stabilization.
Rent comps 40 comps
| Address | Beds | Baths | Sqft | Rent | $/sqft | DOM | Units | Dist |
|---|---|---|---|---|---|---|---|---|
| 2117 Ocelot St Crandall, TX | 3.0 | 2.0 | 1481 | $1,875 | $1.27 | 45d | 1 | 0.15mi |
| 2127 Ocelot St Crandall, TX | 3.0 | 2.0 | 1383 | $2,200 | $1.59 | 45d | 1 | 0.17mi |
| 3324 Price Trl Crandall, TX | 3.0 | 2.0 | 1296 | $1,995 | $1.54 | 19d | 1 | 0.24mi |
| 2043 Serval Ln Crandall, TX | 3.0 | 2.0 | 1544 | $2,100 | $1.36 | 45d | 1 | 0.25mi |
| 2960 Wallace Wells Ct Crandall, TX | 3.0 | 2.0 | 1440 | $2,000 | $1.39 | 45d | 1 | 0.25mi |
| 2973 Wallace Wells Ct Crandall, TX | 3.0 | 2.0 | 1440 | $1,665 | $1.16 | 45d | 1 | 0.27mi |
| 2961 Wallace Wells Ct Crandall, TX | 3.0 | 2.0 | 1266 | $1,855 | $1.47 | 4d | 1 | 0.27mi |
| 2991 Wallace Wells Ct Crandall, TX | 3.0 | 2.0 | 1266 | $1,895 | $1.50 | 45d | 1 | 0.29mi |
| 2505 Milne Ct Crandall, TX | 3.0 | 2.0 | 1450 | $2,500 | $1.72 | 21d | 1 | 0.29mi |
| 3121 Helix Bay Dr Crandall, TX | 3.0 | 2.0 | 1440 | $1,675 | $1.16 | 45d | 1 | 0.32mi |
| 3104 Helix Bay Dr Crandall, TX | 3.0 | 2.0 | 1266 | $1,675 | $1.32 | 26d | 1 | 0.33mi |
| 3007 Wallace Wells Ct Crandall, TX | 3.0 | 2.0 | 1440 | $1,950 | $1.35 | 45d | 1 | 0.34mi |
| 3103 Helix Bay Dr Crandall, TX | 3.0 | 2.0 | 1440 | $1,729 | $1.20 | 5d | 1 | 0.35mi |
| 3101 Helix Bay Dr Crandall, TX | 3.0 | 2.0 | 1266 | $1,745 | $1.38 | 26d | 1 | 0.35mi |
| 3352 Beckwith Way Crandall, TX | 3.0 | 2.0 | 1266 | $1,750 | $1.38 | 1d | 1 | 0.38mi |
| 4152 Silverstein St Crandall, TX | 3.0 | 2.0 | 1266 | $1,925 | $1.52 | 26d | 1 | 0.39mi |
| 3315 Beckwith Way Crandall, TX | 3.0 | 2.0 | 1440 | $1,685 | $1.17 | 45d | 1 | 0.41mi |
| 4171 Silverstein St Crandall, TX | 3.0 | 2.0 | 1311 | $1,900 | $1.45 | 14d | 1 | 0.44mi |
| 3072 Wallace Wells Ct Crandall, TX | 3.0 | 2.0 | 1017 | $1,500 | $1.47 | 26d | 1 | 0.53mi |
| 2306 Great Belt Blvd Crandall, TX | 3.0 | 2.0 | 1266 | $1,695 | $1.34 | 45d | 1 | 0.63mi |
| 2302 Great Belt Blvd Crandall, TX | 3.0 | 2.0 | 1266 | $1,650 | $1.30 | 5d | 1 | 0.63mi |
| 2294 Great Belt Blvd Crandall, TX | 3.0 | 2.0 | 1266 | $1,815 | $1.43 | 26d | 1 | 0.63mi |
| 2603 Khaju Grv Crandall, TX | 3.0 | 2.0 | 1266 | $1,699 | $1.34 | 5d | 1 | 0.64mi |
| 2504 Cornado Way Crandall, TX | 3.0 | 2.0 | 1440 | $1,799 | $1.25 | 45d | 1 | 0.65mi |
| 2511 Cornado Way Crandall, TX | 3.0 | 2.0 | 1239 | $1,799 | $1.45 | 26d | 1 | 0.67mi |
| 2311 Alcantara Ave Crandall, TX | 3.0 | 2.0 | 1220 | $1,740 | $1.43 | 1d | 1 | 0.69mi |
| 4624 Verdin St Crandall, TX | 3.0 | 2.0 | 1390 | $1,950 | $1.40 | 0d | 1 | 0.84mi |
| 2908 Hearts Trl Crandall, TX | 3.0 | 3.0 | 1266 | $1,750 | $1.38 | 45d | 1 | 0.88mi |
| 1930 Wild Orchard Ln Crandall, TX | 3.0 | 2.0 | 1411 | $1,865 | $1.32 | 45d | 1 | 0.95mi |
| 1507 Trick Riding Way Crandall, TX | 4.0 | 2.0 | 1850 | $1,900 | $1.03 | 1d | 1 | 0.99mi |
| 1507 Trick Riding Way Crandall, TX | 4.0 | 2.0 | 1850 | $1,900 | $1.03 | 26d | 1 | 0.99mi |
| 1209 Kings Pl Crandall, TX | 3.0 | 2.0 | 1356 | $1,975 | $1.46 | 3d | 1 | 1.00mi |
| 1609 Duke Dr Crandall, TX | 2.0–4.0 | 2.0–2.5 | 1614 | $2,242 | $1.39 | 0d | 1 | 1.04mi |
| 1799 Courage Crk Crandall, TX | 3.0 | 2.0 | 1260 | $1,800 | $1.43 | 45d | 1 | 1.08mi |
| 1793 Courage Crk Crandall, TX | 4.0 | 2.0 | 1667 | $1,769 | $1.06 | 1d | 1 | 1.09mi |
| 1789 Courage Crk Crandall, TX | 4.0 | 2.0 | 1667 | $1,739 | $1.04 | 5d | 1 | 1.10mi |
| 2624 Bartlett St Crandall, TX | 4.0 | 2.0 | 1707 | $1,825 | $1.07 | 26d | 1 | 1.12mi |
| 2510 Flight Trl Crandall, TX | 4.0 | 2.0 | 1667 | $1,845 | $1.11 | 26d | 1 | 1.16mi |
| 2513 Flight Trl Crandall, TX | 4.0 | 2.0 | 1707 | $1,825 | $1.07 | 26d | 1 | 1.17mi |
| 2739 Bronte Blvd Crandall, TX | 4.0 | 2.0 | 1707 | $1,825 | $1.07 | 26d | 1 | 1.19mi |
HOA detail
- Monthly dues
- $50 · $600/yr
Listing history 13 events
-
2026-05-18status Pending 1755-char remark
-
2026-05-13historical Active Option Contract 1755-char remark
-
2026-05-03$209,900 Active 1755-char remark
-
2024-11-18historical $1,995
-
2024-09-21price $1,995
-
2024-09-07$2,100
-
2024-09-06$2,095 Active
-
2024-07-31historical $1,995
-
2024-07-10price $1,995
-
2024-07-03$2,200
-
2024-06-25price $254,900
-
2024-06-22price $259,000
-
2024-06-07$259,900 Active
ⓘ Source: listings_history table (triggers on properties + properties_extension) + one-shot
backfill from property_details.listing_events for pre-trigger history.
Tax reassessment forecast TX · Resets to sale price
- Current annual tax
- $6,972 · $581/mo
- Projected year-2 tax
- $6,972 · $581/mo
- Expected delta
- $0/yr ($0/mo · 0.0%)
ⓘ Screening estimate from a state-policy table — verify with the county assessor before closing.
Climate risk First Street
- Flood 1/10 Low FEMA zone X (unshaded) · 0% chance over 30 yrs
- Wildfire 6/10 Major
- Heat 7/10 Severe 7 d/yr ≥110°F today · 25 d/yr by 30 yrs out
- Wind 6/10 Major 27% chance of damaging wind over 30 yrs
- Air quality 2/10 Low 1 unhealthy d/yr today · 1 by 30 yrs out
Nearby sold comps map
Loading sold comps map…
Walkable amenities ~0.75 mi
Loading nearby amenities…
Taxation est. · year 1
- Rental income
- $24,140
- − Mortgage interest
- −$11,758
- − Property taxes
- −$6,972
- − Insurance
- −$1,050
- − Repairs & maintenance
- −$1,931
- − Management
- −$1,931
- − HOA
- −$600
- − Depreciation
- −$6,106
- Taxable loss
- −$6,208
- Est. tax savings @ 24.0%
- +$1,490
- After-tax cash flow
- $-1,270/yr
For passive investors: Depreciation is non-cash, so a rental often shows a tax loss while cash-flowing — sheltering income. Rental losses are passive: they offset passive income freely, and up to $25,000/yr can offset ordinary (W-2) income if you actively participate and your MAGI is under $100k (phasing out to $0 by $150k); unused losses carry forward. On sale, claimed depreciation is recaptured at up to 25%, and gains may owe capital-gains tax (a 1031 exchange can defer both). Figures are a year-1 estimate at your 24.0% rate — not tax advice; consult a CPA.
Condition & rehab AI · 12 photos
This move-in ready home in Wildcat Ranch offers a modern open-concept floor plan with good condition and minimal repairs needed. It's an excellent opportunity for investors looking to increase its value through cosmetic updates and landscaping improvements.
Value-add opportunities
- Both Painting the exterior brick — Enhances curb appeal and can increase property value
- Both Landscaping improvements — Enhances curb appeal and can increase property value
- Resale New flooring in bathrooms — Modernizes the space and can increase property value
Renovation cost estimate screening
Value-add ROI direction
- Both Painting the exterior brick — Enhances curb appeal and can increase property value ↑
- Both Landscaping improvements — Enhances curb appeal and can increase property value ↑
- Resale New flooring in bathrooms — Modernizes the space and can increase property value ↑
ⓘ Cost ranges are severity-bucket heuristics (US national rule-of-thumb). Get contractor quotes + a written scope before underwriting a rehab budget.
Schools (NCES district)
- District
- Crandall ISD
- NCES district ID
- 4815510
- Math proficiency
- 36% ▼ -13.00%
- Reading proficiency
- 42% ▼ -8.00%
- Median HH income
- $70,076
- Composite
- 35.57/100
- National rank
- #4901
- State rank
- #351 of 826 in TX
Livability — Heartland
No livability data for this city. (Only ~50 U.S. cities are tracked.)
Census & demographics
- County
- Kaufman County · 122,338 people
- Metro
- Dallas-Fort Worth-Arlington, TX
- Population (ZIP)
- 9,333
- Household income
- $88,013
- Rent vs Own
- Severe rent burden
- 33.0
Population outlook (Kaufman County) Hauer SSP2
- Today (2025)
- 138,716 people
- By 2030
- 150,815 · +8.7%
- By 2040
- 174,877 · +26.1%
- By 2050
- 198,020 · +42.8%
- By 2075
- 251,908 · +81.6%
- By 2100
- 285,325 · +105.7%
Race, ethnicity, and origin ACS 2023
- Neighborhood character
- Diverse neighborhood (Simpson 0.62)
- Race & ethnicity
- White 48% Hispanic / Latino 36% Two or more races 14% Black 14%
- Hispanic origin (detail)
- Mexican 34%
- Common ancestry
- Slovak 1%
- Foreign-born
- 18% · Canada, China
- Languages at home
- 71% English-only · Spanish 27% Other Indo-European 1%
Political lean MEDSL · Kaufman
- 2024 margin
- Strong R (+27.9) · D 35.6% · R 63.5%
- 2008→2024 swing
- +7.9pp toward D · 2008: -35.8pp · 2024: -27.9pp
- All cycles
- 2024: R+27.9 2020: R+33.9 2016: R+47.0 2012: R+44.4 2008: R+35.8
Not yet ingested
- Civics
- —
Market trends
- HPI YoY
- ▼ -71.61%
- Current HPI
- 196.4773
- Rent YoY
- —
- Metro
- Dallas-Fort Worth-Arlington, TX
- State GDP YoY
- ▲ 3.95%
- F500 in state
- 110
Industry mix (Fortune 500 HQ in TX)
| Industry | F500 HQs | Revenue |
|---|---|---|
| Energy | 16 | $1,198B |
|
||
| Technology | 5 | $198B |
|
||
| Engineering / Construction | 4 | $72B |
|
||
| Energy Services | 3 | $60B |
|
||
| Utilities | 3 | $41B |
|
||
| Healthcare | 2 | $330B |
|
||
Price history
-19.2% since first listed14 events — show timeline
- 2026-06-08 Sold (Public Records) — Public Records
- 2026-05-18 Pending — NTREIS
- 2026-05-13 Contingent — NTREIS
- 2026-05-03 Listed $209,900 NTREIS
- 2024-11-18 Rental Removed $1,995 NTREIS
- 2024-09-21 Price Changed $1,995 NTREIS
- 2024-09-07 Listed for Rent $2,100 NTREIS
- 2024-09-06 Listed $2,095 NTREIS
- 2024-07-31 Rental Removed $1,995 NTREIS
- 2024-07-10 Price Changed $1,995 NTREIS
- 2024-07-03 Listed for Rent $2,200 NTREIS
- 2024-06-25 Price Changed $254,900 NTREIS
- 2024-06-22 Price Changed $259,000 NTREIS
- 2024-06-07 Listed $259,900 NTREIS
Property tax history
+73.4%/yrLatest (2025): $6,972 · -8.9% YoY. Source: county tax records.
Cash-flow waterfall
monthlySold comps — $/sqft
last 12 mo · ≤1 miLoading sold comps…