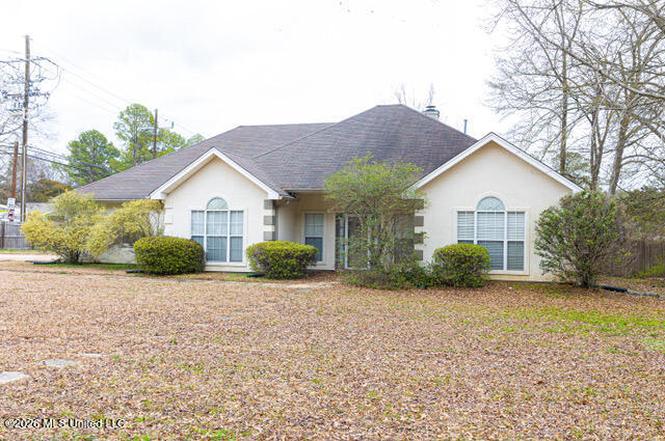
5890 Hanging Moss Rd · Jackson, MS
Flood risk 3/10 · Minor
- FEMA flood zone
- X (unshaded)
- Chance of flooding over 30 yrs
- 0.2%
- Est. flood insurance / yr
- $507 – $1,088
Fire risk 1/10 · Minimal
- Est. fire insurance / yr
- $1,241 – $2,305
Heat risk 7/10 · Major
- Hot days now (above 108°F)
- 7 days/yr
- Hot days in 30 yrs
- 20 days/yr
Wind risk 8/10 · Major
- Chance of severe wind over 30 yrs
- 80.0%
Air-quality risk 2/10 · Minimal
- Unhealthy air days now
- 0 days/yr
- Unhealthy air days in 30 yrs
- 1 days/yr
Risk factors via First Street. Map © Google.
Why this score? — see what drove the C+ grade
The composite is a weighted blend of 9 inputs, each scored 0–100. Each bar is that input's sub-score; the figure is the points it added to the 100-point composite (weight × sub-score).
- Cash flow +23.8/30.0
- ARV discount +15.0/15.0
- DSCR +7.7/10.0
- 1% rule +5.8/10.0
- Livability +3.4/5.0
- Rent growth +3.2/5.0
- Condition / age +2.5/5.0
- Schools +1.1/10.0
- Appreciation +0.0/10.0
$215,000
🖨 Deal sheet 📄 Offer letter ✓ Due diligence
Listing remarks
Welcome to 5890 Hanging Moss Road in the desirable Barrington Woods subdivision of Jackson! This stunning 4 bedroom, 2.5 bathroom home boasts over 2300 square feet of living space, offering ample room for comfortable living and entertaining. Situated on a spacious corner lot, this property provides both privacy and convenience. Step inside to discover a well-appointed interior featuring a modern kitchen, cozy living areas, and a primary suite with a luxurious en-suite bathroom. The open floor plan creates a seamless flow throughout the home, perfect for everyday living and hosting guests. Outside, you'll find a beautiful, spacious yard with plenty of room for outdoor activities and relaxati
Key facts
- Open floor plan
- Primary suite
- En-suite bathroom
Tags
Property features AI
Finance
- HOA & community: Has association; association fee covers management
Exterior
- Parking: Attached 2-car garage
- Utilities: Public water; Public sewer; Electricity connected; Natural gas connected; Cable available; Water connected
- Home design: Single-family house; One level; Owner-provided living area
- Construction: Brick, stucco, and wood siding exterior; Asphalt shingle roof; Slab foundation; Built information provided by owner
- Exterior features: Patio (slab); Privacy wood fencing in back yard
Interior
- Kitchen: Dishwasher; Disposal; Microwave; Oven; Gas water heater
- Flooring: Carpet; Ceramic tile; Laminate
- Bathrooms: 2 full bathrooms and 1 half bathroom (3 total)
- Heating & cooling: Central heating (natural gas); Fireplace heating; Central air; Ceiling fan(s)
- Interior features: Double vanity; Eat-in kitchen; Entrance foyer; Storage; Walk-in closet(s); Living room fireplace
Neighborhood map
What this means for you Summary
Snapshot
- This is a 4-bed/3.0-bath single-family listed at $215k.
Deal economics
- At list price, monthly cash flow is $413 ($5k/yr) — positive.
- The deal already cash-flows at list — no discount required.
- Meets the 1% rule at list price ($2k rent vs $215k).
Location & tenants
- Location reads 68/100 on livability (#66 in MS) — a middle-class / working-renter tenant base. Strengths: commute A+, cost of living A+, housing A+; Watch: amenities F, employment F, health & safety F.
- Jackson Public School District (urban): math 9% / reading 18% proficiency, ranked #112 of 130 in MS (top 86%) — low school quality limits family demand, transient renter base, plan for 1-2y turnover; 88% free/reduced lunch — lower-income household profile, screen leases tightly.
- Zoned schools: North Jackson Elementary School (math 7% / reading 25%, grade F, #270 of 375 statewide, top 72%, 383 students, 100% FRL); Callaway High School (math 3% / reading 10%, grade F, #191 of 197 statewide, top 97%, 923 students, 100% FRL).
- Market conditions: Rents rising (+2.8%/yr); 119 active listings in the ZIP; 2 comparable units currently listed for rent nearby; lower-income renter base — watch delinquency; 167 units permitted in Hinds County in 2024 (0 in 5+ unit buildings).
- At $2,313/mo this rent would consume 65% of the median local household income ($43k/yr) (locally 1554% of renters already pay >50% of income on rent) — very limited rent-growth headroom before tenants either downsize or default.
Forward outlook
- Local home prices are declining (-3.0%/yr); year-one equity from $1k of loan paydown is wiped out by about $6k of value loss. Plan a longer hold.
- Hinds County population projected to shrink 6% by 2050 — rents likely to lag national; underwrite the cash flow, not the appreciation.
Negotiation context
- Only 7 days on market — expect competitive offers; lowballing is unlikely to land.
- 7 sale attempts since 27y ago with the ask held roughly flat each time — persistent listings suggest the price (not the market) is what's stuck; bring a comps-based counter.
Risks & watch-outs
- Climate carrying-cost: severe wind risk, 80% chance of damaging wind over 30y; extreme-heat days projected 7→20/yr by 2055 (HVAC capex compounding) — expect insurance premiums to compound above CPI over the hold.
Questions for the listing agent
- Is there a deadline driving the sale (1031 exchange, divorce, estate, relocation)? That informs how much negotiation room exists.
- Schools are F-rated, which usually means shorter tenancies and higher turnover. Who's the typical renter profile here, and what's been the actual vacancy rate?
- What's the average days-on-market for RENTAL listings here right now (not sales)? A rising rental-DOM trend means longer vacancies and softer asking-rent achievability than the comps imply.
- What's the recent tenant-quality profile in this submarket — average credit score on applications, eviction rate, late-payment / NSF rate, and stable-employment percentage? A property-management company in the area should have these aggregated.
- How much new for-sale + rental construction is in the pipeline within 1–3 miles? Heavy new supply typically softens prices + rents 12–24 months out; constrained supply supports both.
Investment metrics
- 1% rule
- 1.08% ✓
- Cap rate
- 8.60%
- Cash-on-cash
- 8.23%
- DSCR
- 1.37
- GRM
- 7.7
CMA / ARV
- ARV (on-the-fly)
- $258,875
- Comps found
- 6
Show comp detail 6 sales within ~0.75 mi
| Address | Dist | Beds/Ba | Sqft | Sold | Price | $/sf | Match |
|---|---|---|---|---|---|---|---|
| 547 Woodson Dr | 0.57mi | 4/2.5 | 2,717 (-0%) | 8mo | $190,000 | $70 | 64 |
| 576 Woodson Dr | 0.65mi | 3/2.0 (-1) | 2,700 (-1%) | 0mo | $239,900 | $89 | 59 |
| 5961 Huntview Dr | 0.52mi | 4/2.5 | 2,625 (-4%) | 18mo | $299,999 | $114 | 53 |
| 864 Woodlake Dr | 0.55mi | 4/3.5 | 2,900 (+6%) | 13mo | $249,000 | $86 | 51 |
| 710 Woodhill Rd | 0.63mi | 5/2.5 (+1) | 2,671 (-2%) | 20mo | $255,000 | $95 | 44 |
| 5967 Huntview Dr | 0.52mi | 3/2.5 (-1) | 2,382 (-13%) | 7mo | $228,000 | $96 | 42 |
Match score weights: distance 35% · size 25% · config 20% · recency 20%. Top-matched comps best support the ARV.
Projected returns pro-forma
-3.0% appreciation · 2.83% rent growth · sell at horizon
- IRR
- -4.0%
- Equity multiple
- 0.85×
- Total profit
- $-8,938
- Equity at exit
- $32,057
- IRR
- 5.5%
- Equity multiple
- 1.41×
- Total profit
- $24,438
- Equity at exit
- $18,589
Cash invested: $60,200 (down + closing). Projections, not guarantees.
Landlord ↔ Tenant lean methodology
- Overall (STATE)
- 90 Strongly Landlord-Friendly
- State Mississippi
- 90 Strongly Landlord-Friendly · R+11
- County
- — inherits STATE
- City
- — inherits STATE
ZIP-level market 39206
- Home prices YoY
- -10.3%
- Rents YoY
- 2.8%
- Active inventory
- 119
- Price-to-rent
- 7.7×
Monthly cashflow live
- Estimated rent
- $2,313 medium interval (Pro) →
- Mortgage (P&I)
- −$1,127
- Tax from tax record
- −$197 /mo · $2,369/yr
- Insurance
- −$90
- HOA
- −$0
- Vacancy / Maint / Mgmt
- −$486
- Net cashflow
- $413
Break-even live
UW: 25.0% down · 7.5% · 30yr · 1.5% tax · 5.0% vac · 8.0% maint · 8.0% mgmt
Financing live
Cash to close
- Down payment
- $53,750
- Closing costs
- $6,450
- Reserves months
- —
- Total cash needed
- —
Loan-product check · same deal, 3 products live
Conventional
25% down · 7.5% · 30yr
- Down + closing
- —
- Monthly P&I
- —
- Monthly cashflow
- —
- DSCR
- —
- Eligible?
- —
Personal DTI + credit; lowest rate.
DSCR
20% down · 8.5% · 30yr
- Down + closing
- —
- Monthly P&I
- —
- Monthly cashflow
- —
- DSCR
- —
- Eligible?
- —
No personal income docs; deal must DSCR.
Hard money
10% down · 12.0% · 12mo
- Down + closing
- —
- Monthly P&I
- —
- Monthly cashflow
- —
- DSCR
- —
- Eligible?
- —
Short-term bridge; refi at stabilization.
Rent comps 2 comps
| Address | Beds | Baths | Sqft | Rent | $/sqft | DOM | Units | Dist |
|---|---|---|---|---|---|---|---|---|
| 816 Winthrop Cir Jackson, MS | 5.0 | 3.0 | 2800 | $2,500 | $0.89 | 13d | 1 | 0.95mi |
| 816 Winthrop Cir Jackson, MS | 5.0 | 3.0 | 2800 | $2,500 | $0.89 | 23d | 1 | 0.95mi |
Listing history 7 events
-
2026-06-18days on market $215,000 Active 7 DOM
-
2026-06-17days on market $215,000 Active 6 DOM
-
2026-06-16days on market $215,000 Active 5 DOM
-
2026-06-15days on market $215,000 Active 4 DOM
-
2026-06-14days on market $215,000 Active 2 DOM
-
2026-06-13remarks 699-char remark
-
2026-06-13$215,000 Active 1 DOM
ⓘ Source: listings_history table (triggers on properties + properties_extension) + one-shot
backfill from property_details.listing_events for pre-trigger history.
Tax reassessment forecast MS · Resets to sale price
- Current annual tax
- $2,369 · $197/mo
- Projected year-2 tax
- $2,369 · $197/mo
- Expected delta
- $0/yr ($0/mo · 0.0%)
ⓘ Screening estimate from a state-policy table — verify with the county assessor before closing.
Climate risk First Street
- Flood 3/10 Moderate FEMA zone X (unshaded) · 20% chance over 30 yrs
- Wildfire 1/10 Low
- Heat 7/10 Severe 7 d/yr ≥108°F today · 20 d/yr by 30 yrs out
- Wind 8/10 Severe 80% chance of damaging wind over 30 yrs
- Air quality 2/10 Low 0 unhealthy d/yr today · 1 by 30 yrs out
Nearby sold comps map
Loading sold comps map…
Walkable amenities ~0.75 mi
Loading nearby amenities…
Taxation est. · year 1
- Rental income
- $27,760
- − Mortgage interest
- −$12,043
- − Property taxes
- −$2,369
- − Insurance
- −$1,075
- − Repairs & maintenance
- −$2,221
- − Management
- −$2,221
- − Depreciation
- −$6,255
- Taxable income
- $1,576
- Est. tax owed @ 24.0%
- −$378
- After-tax cash flow
- $4,578/yr
For passive investors: Depreciation is non-cash, so a rental often shows a tax loss while cash-flowing — sheltering income. Rental losses are passive: they offset passive income freely, and up to $25,000/yr can offset ordinary (W-2) income if you actively participate and your MAGI is under $100k (phasing out to $0 by $150k); unused losses carry forward. On sale, claimed depreciation is recaptured at up to 25%, and gains may owe capital-gains tax (a 1031 exchange can defer both). Figures are a year-1 estimate at your 24.0% rate — not tax advice; consult a CPA.
Schools (NCES district)
- District
- Jackson Public School District
- NCES district ID
- 2802190
- Math proficiency
- 9% ▼ -14.00%
- Reading proficiency
- 18% ▼ -7.00%
- Median HH income
- $33,234
- Composite
- 10.89/100
- National rank
- #9755
- State rank
- #112 of 130 in MS
Livability — Jackson
- Score
- 68/100
- State rank
- #66
- US rank
- #9695
Category grades
Schools grade is shown separately in the Schools card above.
Census & demographics
- Census place
- Jackson, MS
- County
- Hinds County · 167,040 people
- City population
- 140,204
- Metro
- Jackson, MS
- Population (ZIP)
- 23,257
- Household income
- $42,686
- Rent vs Own
- Severe rent burden
- 1554.0
Population outlook (Hinds County) Hauer SSP2
- Today (2025)
- 242,528 people
- By 2030
- 241,113 · -0.6%
- By 2040
- 235,557 · -2.9%
- By 2050
- 226,946 · -6.4%
- By 2075
- 199,995 · -17.5%
- By 2100
- 164,165 · -32.3%
Race, ethnicity, and origin ACS 2023
- Neighborhood character
- Predominantly Black (85%)
- Race & ethnicity
- Black 85% White 9% Hispanic / Latino 3% Two or more races 3%
- Common ancestry
- Italian 1%
- Foreign-born
- 2% · Canada
- Languages at home
- 96% English-only · Spanish 3%
Political lean MEDSL · Hinds
- 2024 margin
- Solid D (+46.1) · D 72.4% · R 26.3% · Other 1.4%
- 2008→2024 swing
- +7.1pp toward D · 2008: 39.0pp · 2024: 46.1pp
- All cycles
- 2024: D+46.1 2020: D+48.3 2016: D+43.7 2012: D+45.1 2008: D+39.0
Not yet ingested
- Civics
- —
Market trends
- HPI YoY
- ▼ -22.38%
- Current HPI
- 194.5873
- Rent YoY
- ▲ 2.83%
- Metro
- Jackson, MS
- State GDP YoY
- —
- F500 in state
- 0
Price history
+30.3% since first listed19 events — show timeline
- 2026-06-11 Listed $215,000 MLSU
- 2021-10-08 Listing Removed — MLSU
- 2021-10-08 Listing Removed — MLSU
- 2021-10-04 Listing Removed — MLSU
- 2019-01-30 Listed $194,900 MLSU
- 2015-09-30 Sold (Public Records) — Public Records
- 2015-09-30 Sold (MLS) — MLSU
- 2015-06-09 Listed $150,000 MLSU
- 2010-06-15 Sold (MLS) — MLSU
- 2010-05-28 Sold (Public Records) — Public Records
- 2009-07-13 Listed $96,000 MLSU
- 2008-02-04 Sold (Public Records) — Public Records
- 2006-06-08 Sold (MLS) — MLSU
- 2006-06-05 Sold (Public Records) — Public Records
- 2006-02-22 Listed $174,900 MLSU
- 2005-05-20 Listed $220,000 MLSU
- 2000-05-31 Sold (Public Records) — Public Records
- 1999-04-07 Listed $165,000 MLSU
- 1998-11-05 Sold (Public Records) — Public Records
Property tax history
+1.5%/yrLatest (2025): $2,369 · +3.3% YoY. Source: county tax records.
Cash-flow waterfall
monthlySold comps — $/sqft
last 12 mo · ≤1 miLoading sold comps…