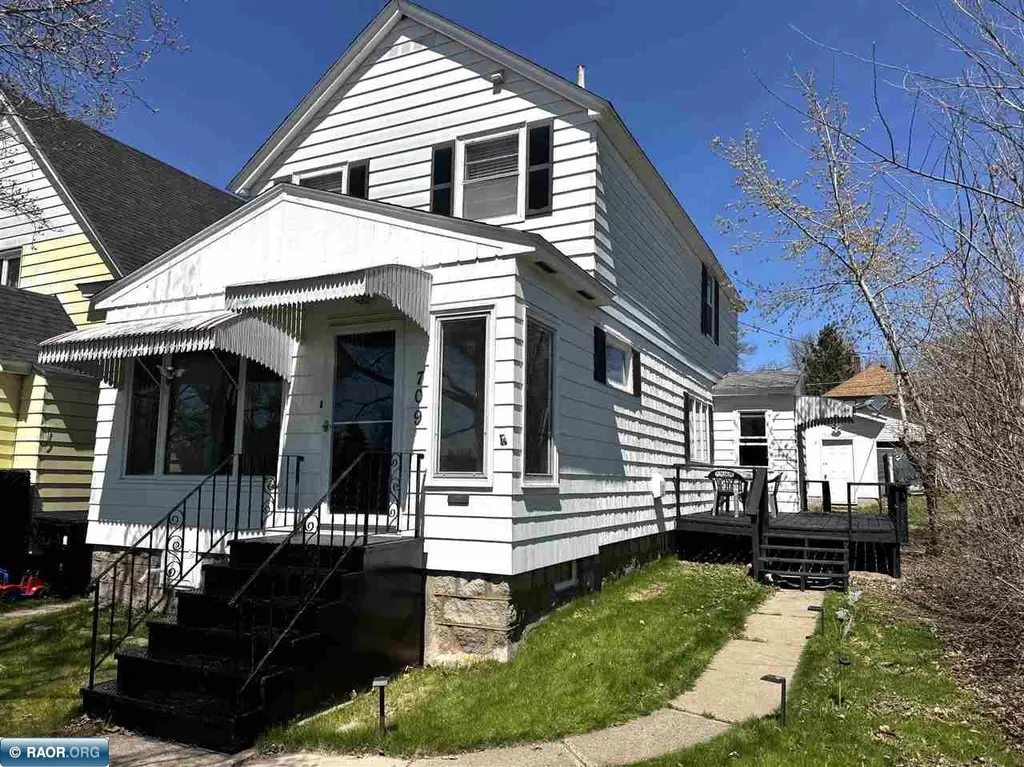
709 Jackson St · Eveleth, MN
Flood risk 1/10 · Minimal
- FEMA flood zone
- X
- Chance of flooding over 30 yrs
- 0.0%
- Est. flood insurance / yr
- $473 – $860
Fire risk 5/10 · Moderate
- Est. fire insurance / yr
- $888 – $1,650
Heat risk 1/10 · Minimal
- Hot days now (above 90°F)
- 7 days/yr
- Hot days in 30 yrs
- 12 days/yr
Wind risk 1/10 · Minimal
- Chance of severe wind over 30 yrs
- —
Air-quality risk 2/10 · Minimal
- Unhealthy air days now
- 2 days/yr
- Unhealthy air days in 30 yrs
- 2 days/yr
Risk factors via First Street. Map © Google.
Why this score? — see what drove the C grade
The composite is a weighted blend of 9 inputs, each scored 0–100. Each bar is that input's sub-score; the figure is the points it added to the 100-point composite (weight × sub-score).
- Cash flow +20.0/30.0
- ARV discount +11.2/15.0
- DSCR +6.3/10.0
- 1% rule +5.3/10.0
- Schools +5.0/10.0
- Livability +3.3/5.0
- Rent growth +2.5/5.0
- Condition / age +2.5/5.0
- Appreciation +0.0/10.0
$139,000
🖨 Deal sheet 📄 Offer letter ✓ Due diligence
Listing remarks MLS
Move in condition home. Home features newer roof, furnace, central air, water heater, front & back doors, remodeled bath, new laminate wood floor in the kitchen and new 2 stall garage. Bedrooms are in tandem.
Key facts
- Insulated garage
- Bright living area
- Spacious deck
Tags
Property features AI
Exterior
- Parking: Detached garage with 2 spaces; Garage door opener
- Utilities: Public water; Public sewer
- Home design: Single-family residence; 2 stories
- Construction: Frame construction with wood siding; Asphalt shingle roof
- Exterior features: Deck
Interior
- Kitchen: Dishwasher; Electric range; Microwave; Refrigerator
- Heating & cooling: Forced air heating (natural gas); Central air conditioning
- Interior features: Dishwasher; Electric range; Microwave; Refrigerator; Electric water heater; Full basement
- Laundry & utility: Washer; Dryer; Electric dryer hookup
Neighborhood map
What this means for you Summary
Snapshot
- This is a 3-bed/1.0-bath single-family listed at $139k.
Deal economics
- At list price, monthly cash flow is $170 ($2k/yr) — positive.
- The deal already cash-flows at list — no discount required.
- Meets the 1% rule at list price ($1k rent vs $139k).
- Recommended offer: $135k (3.0% below list) — sets the bar for market timing.
Location & tenants
- Location reads 66/100 on livability (#506 in MN) — a middle-class / working-renter tenant base. Strengths: cost of living A+, housing A+; Watch: employment C-, schools D+, health & safety D.
- Market conditions: 42 active listings in the ZIP; 639 units permitted in St. Louis County in 2024 (338 in 5+ unit buildings).
Forward outlook
- Local home prices are declining (-3.0%/yr); year-one equity from $961 of loan paydown is wiped out by about $4k of value loss. Plan a longer hold.
Negotiation context
- It's been on market 39 days — a 3% lower offer ($135k) is reasonable based on typical stale-listing flexibility.
- 2 sale attempts since 15y ago with the ask held roughly flat each time — persistent listings suggest the price (not the market) is what's stuck; bring a comps-based counter.
- Current owner paid $84k; list at $139k implies a 65% gain — meaningful room to come down on a strong offer.
Risks & watch-outs
- Watch-outs: built in 1900 — expect roof / HVAC / electrical / plumbing capex.
- Climate carrying-cost: moderate wildfire risk — expect insurance premiums to compound above CPI over the hold.
Questions for the listing agent
- It's been on market 39 days. Have you received any prior offers? Is the seller open to a 3% concession, seller financing, or rate buy-down credit?
- Built in 1900 — when were the roof, HVAC, electrical panel, plumbing, and water heater last replaced?
- Is there a deadline driving the sale (1031 exchange, divorce, estate, relocation)? That informs how much negotiation room exists.
- Schools are D-rated, which usually means shorter tenancies and higher turnover. Who's the typical renter profile here, and what's been the actual vacancy rate?
- What's the average days-on-market for RENTAL listings here right now (not sales)? A rising rental-DOM trend means longer vacancies and softer asking-rent achievability than the comps imply.
- What's the recent tenant-quality profile in this submarket — average credit score on applications, eviction rate, late-payment / NSF rate, and stable-employment percentage? A property-management company in the area should have these aggregated.
- How much new for-sale + rental construction is in the pipeline within 1–3 miles? Heavy new supply typically softens prices + rents 12–24 months out; constrained supply supports both.
Investment metrics
- 1% rule
- 1.03% ✓
- Cap rate
- 7.76%
- Cash-on-cash
- 5.26%
- DSCR
- 1.23
- GRM
- 8.1
CMA / ARV
- ARV (on-the-fly)
- $151,404
- Comps found
- 12
Show comp detail 12 sales within ~0.75 mi
| Address | Dist | Beds/Ba | Sqft | Sold | Price | $/sf | Match |
|---|---|---|---|---|---|---|---|
| 521 Jackson St | 0.12mi | 3/2.0 | 1,260 (-8%) | 7mo | $80,000 | $63 | 72 |
| 914 Douglas Ave | 0.41mi | 3/1.2 | 1,396 (+2%) | 10mo | $160,000 | $115 | 68 |
| 810 Adams Ave | 0.27mi | 4/1.2 (+1) | 1,440 (+6%) | 10mo | $120,000 | $83 | 64 |
| 107 Roosevelt Ave | 0.23mi | 3/1.5 | 1,196 (-12%) | 6mo | $133,000 | $111 | 62 |
| 621 Summit St | 0.31mi | 3/2.0 | 1,447 (+6%) | 14mo | $130,000 | $90 | 60 |
| 905 Washington St | 0.26mi | 3/3.0 | 1,536 (+13%) | 4mo | $135,000 | $88 | 56 |
| 711 Grant Ave | 0.32mi | 2/2.0 (-1) | 1,414 (+4%) | 19mo | $171,900 | $122 | 54 |
| 606 Cleveland St | 0.19mi | 3/1.0 | 1,197 (-12%) | 22mo | $77,000 | $64 | 53 |
| 520 Mckinley Ave | 0.04mi | 4/1.2 (+1) | 1,567 (+15%) | 18mo | $182,410 | $116 | 52 |
| 919 Adams Ave | 0.35mi | 3/1.0 | 1,198 (-12%) | 14mo | $14,250 | $12 | 52 |
| 1008 Douglas Ave | 0.44mi | 2/2.0 (-1) | 1,518 (+11%) | 0mo | $169,900 | $112 | 52 |
| 107 N Auburn Ave | 0.31mi | 3/2.0 | 1,550 (+14%) | 19mo | $229,000 | $148 | 43 |
Match score weights: distance 35% · size 25% · config 20% · recency 20%. Top-matched comps best support the ARV.
Projected returns pro-forma
-3.0% appreciation · 3.0% rent growth · sell at horizon
- IRR
- -8.1%
- Equity multiple
- 0.70×
- Total profit
- $-11,646
- Equity at exit
- $20,725
- IRR
- 1.4%
- Equity multiple
- 1.10×
- Total profit
- $3,925
- Equity at exit
- $12,018
Cash invested: $38,920 (down + closing). Projections, not guarantees.
Landlord ↔ Tenant lean methodology
- Overall (STATE)
- 46 Balanced
- State Minnesota
- 46 Balanced · D+2
- County
- — inherits STATE
- City
- — inherits STATE
ZIP-level market 55734
- Home prices YoY
- -29.1%
- Active inventory
- 42
- Price-to-rent
- 8.1×
Monthly cashflow live
- Estimated rent
- $1,431 medium interval (Pro) →
- Mortgage (P&I)
- −$729
- Tax from tax record
- −$173 /mo · $2,074/yr
- Insurance
- −$58
- HOA
- −$0
- Vacancy / Maint / Mgmt
- −$300
- Net cashflow
- $170
Break-even live
UW: 25.0% down · 7.5% · 30yr · 1.5% tax · 5.0% vac · 8.0% maint · 8.0% mgmt
Financing live
Cash to close
- Down payment
- $34,750
- Closing costs
- $4,170
- Reserves months
- —
- Total cash needed
- —
Loan-product check · same deal, 3 products live
Conventional
25% down · 7.5% · 30yr
- Down + closing
- —
- Monthly P&I
- —
- Monthly cashflow
- —
- DSCR
- —
- Eligible?
- —
Personal DTI + credit; lowest rate.
DSCR
20% down · 8.5% · 30yr
- Down + closing
- —
- Monthly P&I
- —
- Monthly cashflow
- —
- DSCR
- —
- Eligible?
- —
No personal income docs; deal must DSCR.
Hard money
10% down · 12.0% · 12mo
- Down + closing
- —
- Monthly P&I
- —
- Monthly cashflow
- —
- DSCR
- —
- Eligible?
- —
Short-term bridge; refi at stabilization.
Listing history 21 events
-
2026-06-19days on market $139,000 Active 39 DOM
-
2026-06-18days on market $139,000 Active 38 DOM
-
2026-06-17days on market $139,000 Active 37 DOM
-
2026-06-16days on market $139,000 Active 36 DOM
-
2026-06-15days on market $139,000 Active 35 DOM
-
2026-06-14days on market $139,000 Active 33 DOM
-
2026-06-13days on market $139,000 Active 32 DOM
-
2026-06-10days on market $139,000 Active 30 DOM
-
2026-06-09days on market $139,000 Active 29 DOM
-
2026-06-08days on market $139,000 Active 28 DOM
-
2026-06-07days on market $139,000 Active 27 DOM
-
2026-06-05days on market $139,000 Active 24 DOM
-
2026-06-03days on market $139,000 Active 23 DOM
-
2026-06-02pricedays on market $139,000 Active 22 DOM
-
2026-06-01days on market $145,000 Active 21 DOM
-
2026-05-31days on market $145,000 Active 20 DOM
-
2026-05-30days on market $145,000 Active 19 DOM
-
2026-05-11$145,000 Active
-
2011-06-10soldstatus $84,000
-
2011-06-01soldstatus $84,000 214-char remark
Show marketing remark (214 chars)
Move in condition home. Home features newer roof, furnace, central air, water heater, front & back doors, remodeled bath, new laminate wood floor in the kitchen and new 2 stall garage. Bedrooms are in tandem.
-
2011-04-04$86,900 214-char remark
Show marketing remark (214 chars)
Move in condition home. Home features newer roof, furnace, central air, water heater, front & back doors, remodeled bath, new laminate wood floor in the kitchen and new 2 stall garage. Bedrooms are in tandem.
ⓘ Source: listings_history table (triggers on properties + properties_extension) + one-shot
backfill from property_details.listing_events for pre-trigger history.
Tax reassessment forecast MN · Partial reset (capped growth)
- Current annual tax
- $2,074 · $173/mo
- Projected year-2 tax
- $2,074 · $173/mo
- Expected delta
- $0/yr ($0/mo · 0.0%)
ⓘ Screening estimate from a state-policy table — verify with the county assessor before closing.
Climate risk First Street
- Flood 1/10 Low FEMA zone X · 0% chance over 30 yrs
- Wildfire 5/10 Major
- Heat 1/10 Low 7 d/yr ≥90°F today · 12 d/yr by 30 yrs out
- Wind 1/10 Low
- Air quality 2/10 Low 2 unhealthy d/yr today · 2 by 30 yrs out
Nearby sold comps map
Loading sold comps map…
Walkable amenities ~0.75 mi
Loading nearby amenities…
Taxation est. · year 1
- Rental income
- $17,167
- − Mortgage interest
- −$7,786
- − Property taxes
- −$2,074
- − Insurance
- −$695
- − Repairs & maintenance
- −$1,373
- − Management
- −$1,373
- − Depreciation
- −$4,044
- Taxable loss
- −$179
- Est. tax savings @ 24.0%
- +$43
- After-tax cash flow
- $2,089/yr
For passive investors: Depreciation is non-cash, so a rental often shows a tax loss while cash-flowing — sheltering income. Rental losses are passive: they offset passive income freely, and up to $25,000/yr can offset ordinary (W-2) income if you actively participate and your MAGI is under $100k (phasing out to $0 by $150k); unused losses carry forward. On sale, claimed depreciation is recaptured at up to 25%, and gains may owe capital-gains tax (a 1031 exchange can defer both). Figures are a year-1 estimate at your 24.0% rate — not tax advice; consult a CPA.
Schools (NCES district)
No district data.
Livability — Eveleth
- Score
- 66/100
- State rank
- #506
- US rank
- #12213
Category grades
Schools grade is shown separately in the Schools card above.
Census & demographics
- Census place
- Eveleth, MN
- Population (ZIP)
- 6,332
Population outlook (St. Louis County) Hauer SSP2
- Today (2025)
- 202,411 people
- By 2030
- 203,234 · +0.4%
- By 2040
- 202,520 · +0.1%
- By 2050
- 200,853 · -0.8%
- By 2075
- 200,943 · -0.7%
- By 2100
- 192,058 · -5.1%
Race, ethnicity, and origin ACS 2023
- Neighborhood character
- Predominantly White (93%)
- Race & ethnicity
- White 93% Two or more races 4% Black 1% Native American 1%
- Common ancestry
- Portuguese 13% Romanian 3% Lithuanian 3%
- Foreign-born
- 2%
- Languages at home
- 97% English-only · Russian/Polish/Slavic 2%
Political lean MEDSL · St. Louis
- 2024 margin
- D (+13.7) · D 55.9% · R 42.2% · Other 1.8%
- 2008→2024 swing
- -18.8pp toward R · 2008: 32.5pp · 2024: 13.7pp
- All cycles
- 2024: D+13.7 2020: D+15.6 2016: D+11.8 2012: D+29.6 2008: D+32.5
Not yet ingested
- Civics
- —
Market trends
- HPI YoY
- ▼ -85.98%
- Current HPI
- 209.7614
- Rent YoY
- —
- Metro
- —
- State GDP YoY
- ▲ 2.41%
- F500 in state
- 34
Industry mix (Fortune 500 HQ in MN)
| Industry | F500 HQs | Revenue |
|---|---|---|
| Healthcare | 2 | $407B |
|
||
| Retail | 2 | $150B |
|
||
| Consumer Goods | 2 | $32B |
|
||
| Industrial Machinery | 2 | $6B |
|
||
| Agriculture | 1 | $40B |
|
||
| Healthcare / Medical Devices | 1 | $32B |
|
||
Price history
+66.9% since first listed4 events — show timeline
- 2026-05-11 Listed $145,000 RAOR
- 2011-06-10 Sold (Public Records) $84,000 Public Records
- 2011-06-01 Sold (MLS) $84,000 RAOR
- 2011-04-04 Listed $86,900 RAOR
Property tax history
+15.3%/yrLatest (2025): $2,074 · +12.5% YoY. Source: county tax records.
Cash-flow waterfall
monthlySold comps — $/sqft
last 12 mo · ≤1 miLoading sold comps…