 🏷️ Likely Rental
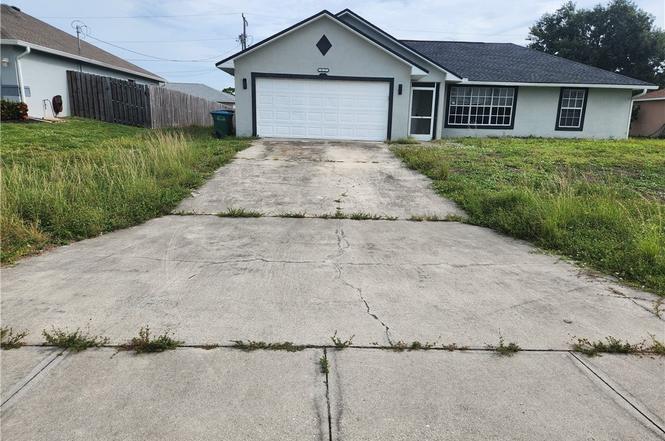
621 SW 21st Ln · Cape Coral, FL
Flood risk 5/10 · Moderate
- FEMA flood zone
- X (unshaded)
- Chance of flooding over 30 yrs
- 0.46%
- Est. flood insurance / yr
- $507 – $1,088
Fire risk 1/10 · Minimal
- Est. fire insurance / yr
- $947 – $1,759
Heat risk 10/10 · Severe
- Hot days now (above 107°F)
- 7 days/yr
- Hot days in 30 yrs
- 29 days/yr
Wind risk 10/10 · Severe
- Chance of severe wind over 30 yrs
- 99.0%
Air-quality risk 2/10 · Minimal
- Unhealthy air days now
- 1 days/yr
- Unhealthy air days in 30 yrs
- 1 days/yr
Risk factors via First Street. Map © Google.
Why this score? — see what drove the C+ grade
The composite is a weighted blend of 9 inputs, each scored 0–100. Each bar is that input's sub-score; the figure is the points it added to the 100-point composite (weight × sub-score).
- Cash flow +22.1/30.0
- ARV discount +15.0/15.0
- 1% rule +7.6/10.0
- DSCR +7.1/10.0
- Schools +4.1/10.0
- Livability +3.9/5.0
- Condition / age +2.5/5.0
- Rent growth +0.4/5.0
- Appreciation +0.0/10.0
$150,000
🖨 Deal sheet 📄 Offer letter ✓ Due diligence
Listing remarks MLS
OVER 10,000 SQ FT. LOT HOME in Cape Coral, Brand New LVT Flooring, Newly Installed Hot Water Heater, Freshly Painted Interior & Exterior! This home has been cared for and marvelously maintained by a squeaky clean tenant. In his own words a "clean freak!". Let''s not forget we are all set with Sewer and City Water! In an appreciable part of the Cape Coral area, this well established community is an exemplary Florida Home and one to be desired! Walking in, you will LOVE the open concept Living to Dining room floor plan. Flowing out from the dining room it will open up to a spacious covered patio overlooking your backyard! With plenty of room for a pet, children, or your favorite hobby, we know this home with many NEW features, will be a HIT! Schedule your TOUR today!
Key facts
- Central to schools
- Central to shopping
- Extended lanai
Tags
Property features AI
Finance
- Financial info: Pets allowed
- HOA & community: Non-gated community; No association fee listed
Exterior
- Parking: Attached 2-car garage; Covered parking for 2 vehicles
- Utilities: Cable available; Sewer assessment unpaid; Water assessment unpaid
- Home design: Single-story; Resale property; Stucco and wood frame construction; Shingle roof; Zoned R1-D
- Construction: Built with stucco and wood frame; Shingle roof
- Exterior features: Lanai; Porch; Screened patio/porch; Rectangular lot; Public maintained road; Property faces south; Exposure to the north
Interior
- Kitchen: Cooktop; Dishwasher; Refrigerator
- Bedrooms: Screened porch listed as a room type
- Flooring: Laminate; Tile; Vinyl
- Bathrooms: 2 full bathrooms
- Heating & cooling: Central electric heating; Central electric cooling
- Interior features: Cathedral ceilings; Separate/formal dining room; Split bedrooms; Separate shower; Shower only; Double-hung windows
- Laundry & utility: Inside laundry
Neighborhood map
What this means for you Summary
Snapshot
- This is a 3-bed/2.0-bath single-family listed at $150k.
Deal economics
- At list price, monthly cash flow is $242 ($3k/yr) — positive.
- The deal already cash-flows at list — no discount required.
- Meets the 1% rule at list price ($2k rent vs $150k).
- Recommended offer: $132k (12.0% below list) — sets the bar for market timing.
- Cap rate 8.2% vs local median 3.1% in Cape Coral — top-decile yield for the area; either an underpriced asset or a hidden risk that comps aren't pricing in. Stress-test before assuming the spread holds.
Location & tenants
- Location reads 77/100 on livability (#208 in FL, #3,098 nationally) — a middle-class / working-renter tenant base. Strengths: housing A+, health & safety A+, amenities B+; Watch: commute F.
- Lee (suburban): math 47% / reading 50% proficiency, ranked #42 of 73 in FL (top 58%) — families likely to look elsewhere, expect single-tenant / working-renter base with shorter leases.
- Market conditions: Rents falling (-8.6%/yr); 686 active listings in the ZIP; 40 comparable units currently listed for rent nearby; rentals at typical pace (median 19d on market — plan ~3-4 weeks tenant-placement turnaround); solid renter incomes; 15,411 units permitted in Lee County in 2024 (4,686 in 5+ unit buildings).
Forward outlook
- Local home prices are declining (-3.0%/yr); year-one equity from $1k of loan paydown is wiped out by about $4k of value loss. Plan a longer hold.
- Lee County population projected at +44% by 2050 — long-run rental-demand tailwind backs the buy-and-hold thesis.
Negotiation context
- It's been on market 155 days — a 12% lower offer ($132k) is reasonable based on typical stale-listing flexibility.
- 4 sale attempts since 9y ago; this cycle's ask has dropped $106k (41%) from the opening price — seller is motivated, your offer sets the floor, not the list.
Risks & watch-outs
- Watch-outs: property tax is 3.2% of price.
- Climate carrying-cost: moderate flood risk; severe wind risk, 99% chance of damaging wind over 30y; extreme-heat days projected 7→29/yr by 2055 (HVAC capex compounding) — expect insurance premiums to compound above CPI over the hold.
Questions for the listing agent
- It's been on market 155 days. Have you received any prior offers? Is the seller open to a 12% concession, seller financing, or rate buy-down credit?
- Property tax is high relative to price — has the assessment been appealed recently, and will the sale trigger a re-assessment?
- Why hasn't it sold? Are there any deal-killer items the seller is aware of (foundation, flood, title, zoning, code violations)?
- Is there a deadline driving the sale (1031 exchange, divorce, estate, relocation)? That informs how much negotiation room exists.
- Schools are B-rated — typically a magnet for longer-tenancy family renters. What's the average tenant stay here, and is there a school-zone premium baked into asking?
- What's the average days-on-market for RENTAL listings here right now (not sales)? A rising rental-DOM trend means longer vacancies and softer asking-rent achievability than the comps imply.
- What's the recent tenant-quality profile in this submarket — average credit score on applications, eviction rate, late-payment / NSF rate, and stable-employment percentage? A property-management company in the area should have these aggregated.
- How much new for-sale + rental construction is in the pipeline within 1–3 miles? Heavy new supply typically softens prices + rents 12–24 months out; constrained supply supports both.
Investment metrics
- 1% rule
- 1.26% ✓
- Cap rate
- 8.23%
- Cash-on-cash
- 6.91%
- DSCR
- 1.31
- GRM
- 6.6
CMA / ARV
- ARV (on-the-fly)
- $255,516
- Comps found
- 6
Show comp detail 6 sales within ~0.75 mi
| Address | Dist | Beds/Ba | Sqft | Sold | Price | $/sf | Match |
|---|---|---|---|---|---|---|---|
| 221 SW 22nd St | 0.55mi | 3/2.0 | 1,176 (-2%) | 2mo | $215,000 | $183 | 70 |
| 415 SW 20th St | 0.40mi | 3/2.0 | 1,142 (-4%) | 8mo | $240,000 | $210 | 68 |
| 514 SW 21st St | 0.14mi | 3/2.0 | 1,362 (+14%) | 11mo | $291,000 | $214 | 61 |
| 1117 SW 22nd Ter | 0.63mi | 3/2.0 | 1,270 (+6%) | 1mo | $279,900 | $220 | 60 |
| 410 SW 19th Ter | 0.46mi | 3/2.0 | 1,278 (+7%) | 13mo | $300,000 | $235 | 56 |
| 1808 SW 2nd Pl | 0.72mi | 3/2.0 | 1,272 (+6%) | 2mo | $255,000 | $200 | 54 |
Match score weights: distance 35% · size 25% · config 20% · recency 20%. Top-matched comps best support the ARV.
Projected returns pro-forma
-3.0% appreciation · 0.0% rent growth · sell at horizon
- IRR
- -9.6%
- Equity multiple
- 0.66×
- Total profit
- $-14,282
- Equity at exit
- $22,365
- IRR
- -5.9%
- Equity multiple
- 0.68×
- Total profit
- $-13,384
- Equity at exit
- $12,969
Cash invested: $42,000 (down + closing). Projections, not guarantees.
Landlord ↔ Tenant lean methodology
- Overall (STATE)
- 87 Strongly Landlord-Friendly
- State Florida
- 87 Strongly Landlord-Friendly · R+3
- County
- — inherits STATE
- City
- — inherits STATE
ZIP-level market 33991
- Home prices YoY
- -27.8%
- Rents YoY
- -8.6%
- Active inventory
- 686
- Price-to-rent
- 6.6×
Monthly cashflow live
- Estimated rent
- $1,895 high interval (Pro) →
- Mortgage (P&I)
- −$787
- Tax from tax record
- −$406 /mo · $4,867/yr
- Insurance
- −$62
- HOA
- −$0
- Vacancy / Maint / Mgmt
- −$398
- Net cashflow
- $242
Break-even live
UW: 25.0% down · 7.5% · 30yr · 1.5% tax · 5.0% vac · 8.0% maint · 8.0% mgmt
Financing live
Cash to close
- Down payment
- $37,500
- Closing costs
- $4,500
- Reserves months
- —
- Total cash needed
- —
Loan-product check · same deal, 3 products live
Conventional
25% down · 7.5% · 30yr
- Down + closing
- —
- Monthly P&I
- —
- Monthly cashflow
- —
- DSCR
- —
- Eligible?
- —
Personal DTI + credit; lowest rate.
DSCR
20% down · 8.5% · 30yr
- Down + closing
- —
- Monthly P&I
- —
- Monthly cashflow
- —
- DSCR
- —
- Eligible?
- —
No personal income docs; deal must DSCR.
Hard money
10% down · 12.0% · 12mo
- Down + closing
- —
- Monthly P&I
- —
- Monthly cashflow
- —
- DSCR
- —
- Eligible?
- —
Short-term bridge; refi at stabilization.
Rent comps 40 comps
| Address | Beds | Baths | Sqft | Rent | $/sqft | DOM | Units | Dist |
|---|---|---|---|---|---|---|---|---|
| 2227 SW 5th Ave Cape Coral, FL | 3.0 | 2.0 | 1485 | $2,000 | $1.35 | 3d | 1 | 0.26mi |
| 517 SW 25th Ln Cape Coral, FL | 3.0 | 2.0 | 1104 | $1,790 | $1.62 | 23d | 1 | 0.49mi |
| 130 SW 22nd St Cape Coral, FL | 3.0 | 2.0 | 1464 | $2,495 | $1.70 | 2d | 1 | 0.62mi |
| 843 SW 16th Ter Cape Coral, FL | 2.0 | 2.0 | 900 | $1,395 | $1.55 | 3d | 1 | 0.79mi |
| 2820 SW 7th Pl Cape Coral, FL | 3.0 | 2.0 | 1209 | $1,550 | $1.28 | 19d | 1 | 0.89mi |
| 1910 Santa Barbara Blvd S Unit 2 Cape Coral, FL | 2.0 | 2.0 | 1044 | $1,500 | $1.44 | 23d | 1 | 0.90mi |
| 1910 Santa Barbara Blvd Unit 6 Cape Coral, FL | 2.0 | 2.0 | 1185 | $1,600 | $1.35 | 23d | 1 | 0.90mi |
| 1904 Santa Barbara Blvd #4 Cape Coral, FL | 2.0 | 1.0 | 1000 | $1,325 | $1.32 | 23d | 1 | 0.91mi |
| 1809 SW Santa Barbara Pl Cape Coral, FL | 2.0 | 2.0 | 984 | $1,600 | $1.63 | 23d | 1 | 0.93mi |
| 1715 SW 1st Ave Cape Coral, FL | 3.0 | 2.0 | 1330 | $1,850 | $1.39 | 21d | 1 | 0.93mi |
| 2136 SE 1st Ave Cape Coral, FL | 3.0 | 2.0 | 1216 | $1,800 | $1.48 | 15d | 1 | 0.96mi |
| 1628 SW Santa Barbara Pl Cape Coral, FL | 3.0 | 2.0 | 1224 | $1,600 | $1.31 | 3d | 1 | 0.99mi |
| 104 Trafalgar Pkwy Cape Coral, FL | 3.0 | 2.0 | 1255 | $1,595 | $1.27 | 3d | 1 | 1.02mi |
| 1623 SW Santa Barbara Pl Cape Coral, FL | 2.0 | 2.0 | 870 | $1,500 | $1.72 | 23d | 1 | 1.02mi |
| 100 SW Trafalgar Pkwy #104 Cape Coral, FL | 3.0 | 2.0 | 1255 | $1,795 | $1.43 | 14d | 1 | 1.02mi |
| 2941 Skyline Blvd Cape Coral, FL | 3.0 | 2.0 | 1209 | $1,695 | $1.40 | 23d | 1 | 1.06mi |
| 2943 Skyline Blvd Unit 2941 Cape Coral, FL | 3.0 | 2.0 | 1209 | $1,695 | $1.40 | 23d | 1 | 1.06mi |
| 3005 SW 8th Pl Cape Coral, FL | 3.0 | 2.0 | 1210 | $2,800 | $2.31 | 3d | 1 | 1.12mi |
| 3005 SW 8th Pl Cape Coral, FL | 3.0 | 2.0 | 1210 | $2,800 | $2.31 | 2d | 1 | 1.12mi |
| 1303 SW 16th Ter Cape Coral, FL | 2.0 | 2.0 | 1159 | $1,450 | $1.25 | 3d | 1 | 1.12mi |
| 1303 SW 16th Ter #101 Cape Coral, FL | 2.0 | 2.0 | 1159 | $1,449 | $1.25 | 23d | 1 | 1.12mi |
| 1409 SW 11th Pl Cape Coral, FL | 4.0 | 2.0 | 1499 | $1,790 | $1.19 | 21d | 1 | 1.14mi |
| 1314 Trafalgar Pkwy Cape Coral, FL | 3.0 | 2.0 | 1209 | $1,525 | $1.26 | 3d | 1 | 1.16mi |
| 1314 Trafalgar Pkwy Cape Coral, FL | 3.0 | 2.0 | 1209 | $1,550 | $1.28 | 15d | 1 | 1.16mi |
| 1916 SW 15th Pl Cape Coral, FL | 3.0 | 2.0 | 1200 | $1,549 | $1.29 | 19d | 1 | 1.18mi |
| 2005 Chiquita Blvd S Cape Coral, FL | 3.0 | 2.0 | 1200 | $1,600 | $1.33 | 3d | 1 | 1.18mi |
| 1407 SW 16th Ter #201 Cape Coral, FL | 3.0 | 2.0 | 1186 | $1,000 | $0.84 | 23d | 1 | 1.20mi |
| 2907 SW Santa Barbara Pl Cape Coral, FL | 3.0 | 2.0 | 1268 | $1,800 | $1.42 | 23d | 1 | 1.24mi |
| 2821 Santa Barbara Blvd Cape Coral, FL | 3.0 | 2.0 | 1299 | $1,550 | $1.19 | 23d | 1 | 1.25mi |
| 204 SE 18th St Cape Coral, FL | 3.0 | 2.0 | 1201 | $2,700 | $2.25 | 1d | 1 | 1.25mi |
| 2829 Santa Barbara Blvd S Unit D Cape Coral, FL | 2.0 | 2.0 | 988 | $1,350 | $1.37 | 23d | 1 | 1.27mi |
| 929 SW 31st St Cape Coral, FL | 3.0 | 2.0 | 1275 | $2,030 | $1.59 | 21d | 1 | 1.27mi |
| 929 SW 31st St Cape Coral, FL | 3.0 | 2.0 | 1275 | $1,950 | $1.53 | 14d | 1 | 1.27mi |
| 205 SE 18th St Cape Coral, FL | 3.0 | 2.0 | 1404 | $2,100 | $1.50 | 3d | 1 | 1.27mi |
| 2912 Santa Barbara Blvd Unit 2912 Cape Coral, FL | 2.0 | 2.0 | 1100 | $1,550 | $1.41 | 11d | 1 | 1.28mi |
| 1218 SW 9th Ct Cape Coral, FL | 3.0 | 2.0 | 1476 | $2,850 | $1.93 | 1d | 1 | 1.29mi |
| 1218 SW 9th Ct Cape Coral, FL | 3.0 | 2.0 | 1476 | $2,850 | $1.93 | 3d | 1 | 1.29mi |
| 823 Gleason Pkwy #2 Cape Coral, FL | 2.0 | 1.0 | 882 | $1,350 | $1.53 | 23d | 1 | 1.34mi |
| 841 Gleason Pkwy Unit 2 Cape Coral, FL | 2.0 | 1.0 | 920 | $1,390 | $1.51 | 23d | 1 | 1.36mi |
| 3004 Santa Barbara Blvd Unit B Cape Coral, FL | 2.0 | 2.0 | 1097 | $1,275 | $1.16 | 23d | 1 | 1.37mi |
Listing history 26 events
-
2026-06-17days on market $150,000 Active 155 DOM
-
2026-06-16days on market $150,000 Active 154 DOM
-
2026-06-16remarks 684-char remark
-
2026-06-15pricestatusdays on market $150,000 Active 153 DOM
-
2026-06-13status $225,000 Pending 152 DOM
-
2026-06-10days on market $225,000 Active 152 DOM
-
2026-06-09days on market $225,000 Active 151 DOM
-
2026-06-07days on market $225,000 Active 149 DOM
-
2026-06-02days on market $225,000 Active 144 DOM
-
2026-06-01days on market $225,000 Active 143 DOM
-
2026-06-01days on market $225,000 Active 142 DOM
-
2026-03-18status Active
-
2026-03-18price $225,000
-
2025-11-12status Pending
-
2025-10-17price $220,000
-
2025-09-05$255,900 Active
-
2021-05-28soldstatus $230,000
-
2021-05-27soldstatus $230,000 Closed 796-char remark
Show marketing remark (796 chars)
OVER 10,000 SQ FT. LOT HOME in Cape Coral, Brand New LVT Flooring, Newly Installed Hot Water Heater, Freshly Painted Interior & Exterior! This home has been cared for and marvelously maintained by a squeaky clean tenant. In his own words a "clean freak!". Let''s not forget we are all set with Sewer and City Water! In an appreciable part of the Cape Coral area, this well established community is an exemplary Florida Home and one to be desired! Walking in, you will LOVE the open concept Living to Dining room floor plan. Flowing out from the dining room it will open up to a spacious covered patio overlooking your backyard! With plenty of room for a pet, children, or your favorite hobby, we know this home with many NEW features, will be a HIT! Schedule your TOUR today!
-
2021-04-27status Pending 796-char remark
Show marketing remark (796 chars)
OVER 10,000 SQ FT. LOT HOME in Cape Coral, Brand New LVT Flooring, Newly Installed Hot Water Heater, Freshly Painted Interior & Exterior! This home has been cared for and marvelously maintained by a squeaky clean tenant. In his own words a "clean freak!". Let''s not forget we are all set with Sewer and City Water! In an appreciable part of the Cape Coral area, this well established community is an exemplary Florida Home and one to be desired! Walking in, you will LOVE the open concept Living to Dining room floor plan. Flowing out from the dining room it will open up to a spacious covered patio overlooking your backyard! With plenty of room for a pet, children, or your favorite hobby, we know this home with many NEW features, will be a HIT! Schedule your TOUR today!
-
2021-04-20$225,000 Active 796-char remark
Show marketing remark (796 chars)
OVER 10,000 SQ FT. LOT HOME in Cape Coral, Brand New LVT Flooring, Newly Installed Hot Water Heater, Freshly Painted Interior & Exterior! This home has been cared for and marvelously maintained by a squeaky clean tenant. In his own words a "clean freak!". Let''s not forget we are all set with Sewer and City Water! In an appreciable part of the Cape Coral area, this well established community is an exemplary Florida Home and one to be desired! Walking in, you will LOVE the open concept Living to Dining room floor plan. Flowing out from the dining room it will open up to a spacious covered patio overlooking your backyard! With plenty of room for a pet, children, or your favorite hobby, we know this home with many NEW features, will be a HIT! Schedule your TOUR today!
-
2018-05-04historical
-
2018-02-16price $179,991
-
2017-12-06price $184,991
-
2017-11-07$195,991 Active
-
2013-09-17price $32,900
-
2011-08-01soldstatus $41,000
ⓘ Source: listings_history table (triggers on properties + properties_extension) + one-shot
backfill from property_details.listing_events for pre-trigger history.
Tax reassessment forecast FL · Resets to sale price
- Current annual tax
- $4,867 · $406/mo
- Projected year-2 tax
- $4,867 · $406/mo
- Expected delta
- $0/yr ($0/mo · 0.0%)
ⓘ Screening estimate from a state-policy table — verify with the county assessor before closing.
Climate risk First Street
- Flood 5/10 Major FEMA zone X (unshaded) · 46% chance over 30 yrs
- Wildfire 1/10 Low
- Heat 10/10 Extreme 7 d/yr ≥107°F today · 29 d/yr by 30 yrs out
- Wind 10/10 Extreme 99% chance of damaging wind over 30 yrs
- Air quality 2/10 Low 1 unhealthy d/yr today · 1 by 30 yrs out
Nearby sold comps map
Loading sold comps map…
Walkable amenities ~0.75 mi
Loading nearby amenities…
Taxation est. · year 1
- Rental income
- $22,734
- − Mortgage interest
- −$8,402
- − Property taxes
- −$4,867
- − Insurance
- −$750
- − Repairs & maintenance
- −$1,819
- − Management
- −$1,819
- − Depreciation
- −$4,364
- Taxable income
- $714
- Est. tax owed @ 24.0%
- −$171
- After-tax cash flow
- $2,733/yr
For passive investors: Depreciation is non-cash, so a rental often shows a tax loss while cash-flowing — sheltering income. Rental losses are passive: they offset passive income freely, and up to $25,000/yr can offset ordinary (W-2) income if you actively participate and your MAGI is under $100k (phasing out to $0 by $150k); unused losses carry forward. On sale, claimed depreciation is recaptured at up to 25%, and gains may owe capital-gains tax (a 1031 exchange can defer both). Figures are a year-1 estimate at your 24.0% rate — not tax advice; consult a CPA.
Schools (NCES district)
- District
- Lee
- NCES district ID
- 1201080
- Math proficiency
- 47% ▼ -11.00%
- Reading proficiency
- 50% ▼ -4.00%
- Median HH income
- $49,518
- Composite
- 41.49/100
- National rank
- #3458
- State rank
- #42 of 73 in FL
Livability — Cape Coral
- Score
- 77/100
- State rank
- #208
- US rank
- #3098
Category grades
Schools grade is shown separately in the Schools card above.
Census & demographics
- Census place
- Cape Coral, FL
- County
- Lee County · 788,662 people
- City population
- 217,388
- Metro
- Cape Coral-Fort Myers, FL
- Population (ZIP)
- 27,725
- Household income
- $84,470
- Rent vs Own
- Severe rent burden
- 760.0
Population outlook (Lee County) Hauer SSP2
- Today (2025)
- 871,946 people
- By 2030
- 955,468 · +9.6%
- By 2040
- 1,113,587 · +27.7%
- By 2050
- 1,256,891 · +44.1%
- By 2075
- 1,560,270 · +78.9%
- By 2100
- 1,726,848 · +98.0%
Race, ethnicity, and origin ACS 2023
- Neighborhood character
- Predominantly White (71%)
- Race & ethnicity
- White 71% Hispanic / Latino 20% Two or more races 14% Black 3% Asian 1%
- Hispanic origin (detail)
- Mexican 1% Puerto Rican 6% Cuban 6%
- Common ancestry
- Romanian 5% Lithuanian 3% Italian 3%
- Foreign-born
- 13% · Canada, Jamaica
- Languages at home
- 81% English-only · Spanish 15% Russian/Polish/Slavic 1% Tagalog/Filipino 1%
Political lean MEDSL · Lee
- 2024 margin
- Strong R (+28.4) · D 35.5% · R 63.9%
- 2008→2024 swing
- -18.0pp toward R · 2008: -10.4pp · 2024: -28.4pp
- All cycles
- 2024: R+28.4 2020: R+19.2 2016: R+20.4 2012: R+16.6 2008: R+10.4
Not yet ingested
- Civics
- —
Market trends
- HPI YoY
- ▼ -108.25%
- Current HPI
- 281.0735
- Rent YoY
- ▼ -8.55%
- Metro
- Cape Coral-Fort Myers, FL
- State GDP YoY
- ▲ 3.28%
- F500 in state
- 36
Industry mix (Fortune 500 HQ in FL)
| Industry | F500 HQs | Revenue |
|---|---|---|
| Industrial Technology | 2 | $29B |
|
||
| Insurance | 2 | $17B |
|
||
| Retail | 1 | $60B |
|
||
| Technology Distribution | 1 | $58B |
|
||
| Homebuilding | 1 | $35B |
|
||
| Technology Manufacturing | 1 | $35B |
|
||
Price history
+448.8% since first listed15 events — show timeline
- 2026-03-18 Relisted — FORTMLS
- 2026-03-18 Price Changed $225,000 FORTMLS
- 2025-11-12 Pending — FORTMLS
- 2025-10-17 Price Changed $220,000 FORTMLS
- 2025-09-05 Listed $255,900 FORTMLS
- 2021-05-28 Sold (Public Records) $230,000 Public Records
- 2021-05-27 Sold (MLS) $230,000 FORTMLS
- 2021-04-27 Pending — FORTMLS
- 2021-04-20 Listed $225,000 FORTMLS
- 2018-05-04 Listing Removed — FORTMLS
- 2018-02-16 Price Changed $179,991 FORTMLS
- 2017-12-06 Price Changed $184,991 FORTMLS
- 2017-11-07 Listed $195,991 FORTMLS
- 2013-09-17 Price Changed $32,900 FORTMLS
- 2011-08-01 Sold (MLS) $41,000 FORTMLS
Property tax history
+4.8%/yrLatest (2025): $4,867 · -3.0% YoY. Source: county tax records.
Cash-flow waterfall
monthlySold comps — $/sqft
last 12 mo · ≤1 miLoading sold comps…