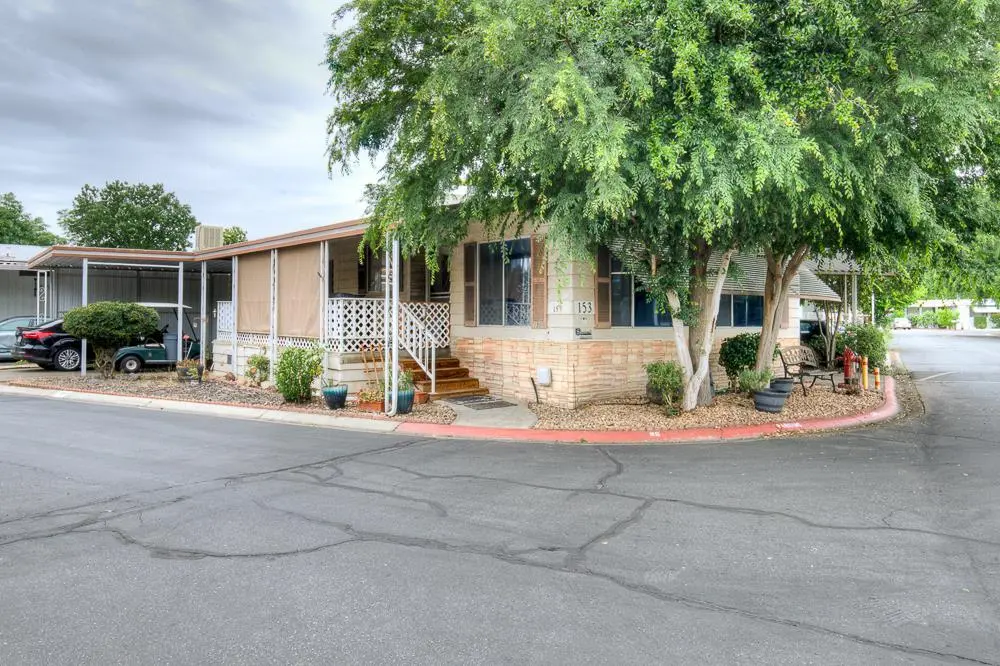
9360 N Blackstone Ave #153 · Fresno, CA
Flood risk 4/10 · Minor
- FEMA flood zone
- AE
- Chance of flooding over 30 yrs
- 0.17%
- Est. flood insurance / yr
- $1,737 – $8,500
Fire risk 8/10 · Major
- Est. fire insurance / yr
- $659 – $1,223
Heat risk 8/10 · Major
- Hot days now (above 106°F)
- 7 days/yr
- Hot days in 30 yrs
- 17 days/yr
Wind risk 1/10 · Minimal
- Chance of severe wind over 30 yrs
- —
Air-quality risk 10/10 · Severe
- Unhealthy air days now
- 44 days/yr
- Unhealthy air days in 30 yrs
- 51 days/yr
Risk factors via First Street. Map © Google.
Why this score? — see what drove the B+ grade
The composite is a weighted blend of 9 inputs, each scored 0–100. Each bar is that input's sub-score; the figure is the points it added to the 100-point composite (weight × sub-score).
- Cash flow +30.0/30.0
- ARV discount +15.0/15.0
- 1% rule +10.0/10.0
- DSCR +10.0/10.0
- Schools +5.9/10.0
- Livability +3.1/5.0
- Rent growth +3.0/5.0
- Condition / age +2.5/5.0
- Appreciation +0.0/10.0
$110,000
🖨 Deal sheet 📄 Offer letter ✓ Due diligence
Listing remarks
Located in Fresno within the desirable Woodward Bluffs Mobile Home Park, this spacious 2-bedroom, 2-bath home offers 1,440 sq ft of comfortable living. Built in 1979, the home features mulled windows and a full water plumbing retrofit, providing added value and peace of mind. Interior highlights include newer flooring and fresh paint throughout most rooms, creating a clean, move-in ready feel. The functional layout offers generous living spaces. Outside, enjoy the convenience of covered parking on both sides of the home along with a low-maintenance setup. The community offers a variety of amenities including a clubhouse, pool, spa, and green areas, with direct access to Woodward Park for ou
Key facts
- Newer flooring
- Fresh paint
- Covered parking
Tags
Property features AI
Finance
- HOA & community: Monthly association fee; Community amenities include pool, clubhouse, and green area
Exterior
- Parking: Carport; Has carport
- Utilities: Electric on; Public sewer; Public utilities
- Home design: Mobile home; Silvercrest manufacturer
- Construction: Metal siding; Wood subfloor foundation; Rolled/hot mop roof; Built as a mobile home
- Exterior features: One-story; Covered patio/porch; Shed(s); Corner lot in an urban setting; Park space rented
Interior
- Flooring: Laminate; Vinyl
- Bathrooms: 2 bathrooms
- Heating & cooling: Central heat and air conditioning; Has heating; Has cooling
- Interior features: Laminate and vinyl flooring; No basement
- Laundry & utility: Laundry inside
Neighborhood map
What this means for you Summary
Snapshot
- This is a 3-bed/2.0-bath manufactured listed at $110k.
Deal economics
- At list price, monthly cash flow is $850 ($10k/yr) — positive.
- The deal already cash-flows at list — no discount required.
- Meets the 1% rule at list price ($2k rent vs $110k).
- Recommended offer: $107k (3.0% below list) — sets the bar for market timing.
- Cap rate 20.2% vs local median 3.7% in Fresno — top-decile yield for the area; either an underpriced asset or a hidden risk that comps aren't pricing in. Stress-test before assuming the spread holds.
Location & tenants
- Location reads 62/100 on livability (#469 in CA) — a middle-class / working-renter tenant base. Strengths: commute A+, housing A+; Watch: amenities D+, employment D+, crime F.
- Clovis Unified (suburban): math 58% / reading 72% proficiency, ranked #152 of 1,400 in CA (top 11%) — acceptable for families but not a draw, mixed tenant base, ~2y average lease.
- Zoned schools: Valley Oak Elementary (496 students, 34% FRL); Kastner Intermediate (1,133 students, 56% FRL); Clovis West High (2,089 students, 44% FRL).
- Market conditions: Rents rising (+1.9%/yr); 176 active listings in the ZIP; 6 comparable units currently listed for rent nearby; rentals at typical pace (median 24d on market — plan ~3-4 weeks tenant-placement turnaround); solid renter incomes; 2,426 units permitted in Fresno County in 2024 (296 in 5+ unit buildings).
Forward outlook
- Local home prices are declining (-3.0%/yr); year-one equity from $761 of loan paydown is wiped out by about $3k of value loss. Plan a longer hold.
- Fresno County population projected at +11% by 2050 — modest demand growth; plan on rents tracking national, not racing it.
- At projected returns (-3.0% appreciation + 1.9% rent growth), your $31k cash investment doubles in ~4 years — after that, you're playing with house money.
Negotiation context
- It's been on market 44 days — a 3% lower offer ($107k) is reasonable based on typical stale-listing flexibility.
Risks & watch-outs
- Watch-outs: flood insurance adds $427/mo.
- Climate carrying-cost: in FEMA flood zone AE (mandatory federal flood insurance); severe wildfire risk; extreme-heat days projected 7→17/yr by 2055 (HVAC capex compounding) — expect insurance premiums to compound above CPI over the hold.
Questions for the listing agent
- It's been on market 44 days. Have you received any prior offers? Is the seller open to a 3% concession, seller financing, or rate buy-down credit?
- Built in 1979 — when were the roof, HVAC, electrical panel, plumbing, and water heater last replaced?
- What's the actual annual flood-insurance premium (NFIP or private), and is the property in a SFHA with mandatory coverage?
- Is there a deadline driving the sale (1031 exchange, divorce, estate, relocation)? That informs how much negotiation room exists.
- Schools are D-rated, which usually means shorter tenancies and higher turnover. Who's the typical renter profile here, and what's been the actual vacancy rate?
- Crime grade is F in this area — have there been break-ins, vandalism, or insurance claims at this property in the last 3 years? What carrier currently insures it and at what premium?
- What's the average days-on-market for RENTAL listings here right now (not sales)? A rising rental-DOM trend means longer vacancies and softer asking-rent achievability than the comps imply.
- What's the recent tenant-quality profile in this submarket — average credit score on applications, eviction rate, late-payment / NSF rate, and stable-employment percentage? A property-management company in the area should have these aggregated.
- How much new for-sale + rental construction is in the pipeline within 1–3 miles? Heavy new supply typically softens prices + rents 12–24 months out; constrained supply supports both.
Investment metrics
- 1% rule
- 2.21% ✓
- Cap rate
- 20.22%
- Cash-on-cash
- 49.73%
- DSCR
- 3.21
- GRM
- 3.8
CMA / ARV
- ARV (median comp)
- $180,293
- List price
- $110,000
- Delta
- -38.99%
- Verdict
- UNDERPRICED
- Comps
- 9 within 1.0 mi
Show comp detail 12 sales within ~0.75 mi
| Address | Dist | Beds/Ba | Sqft | Sold | Price | $/sf | Match |
|---|---|---|---|---|---|---|---|
| 9360 N Blackstone Ave #215 | 0.05mi | 3/2.0 | 1,440 (0%) | 0mo | $180,000 | $125 | 97 |
| 9360 N Blackstone Ave #112 | 0.06mi | 3/2.0 | 1,440 (0%) | 4mo | $185,000 | $128 | 94 |
| 9360 Blackstone Ave #107 | 0.00mi | 2/2.0 (-1) | 1,440 (0%) | 6mo | $130,000 | $90 | 90 |
| 9360 N Blackstone Ave #237 | 0.00mi | 2/2.0 (-1) | 1,440 (0%) | 6mo | $85,000 | $59 | 90 |
| 9360 N Blackstone Ave #164 | 0.06mi | 3/2.0 | 1,440 (0%) | 20mo | $80,000 | $56 | 80 |
| 8701 Highway 41 #9 | 0.35mi | 3/2.0 | 1,500 (+4%) | 2mo | $238,250 | $159 | 75 |
| 9360 N Blackstone Ave #213 | 0.00mi | 2/2.0 (-1) | 1,248 (-13%) | 2mo | $110,000 | $88 | 71 |
| 8701 Highway 41 #53 | 0.35mi | 2/2.0 (-1) | 1,428 (-1%) | 9mo | $260,000 | $182 | 70 |
| 8701 Highway 41 #28 | 0.34mi | 2/2.0 (-1) | 1,440 (0%) | 12mo | $183,000 | $127 | 69 |
| 8701 Highway 41 #11 | 0.35mi | 2/2.0 (-1) | 1,440 (0%) | 15mo | $247,000 | $172 | 66 |
| 9360 N Blackstone Ave #136 | 0.06mi | 2/2.0 (-1) | 1,344 (-7%) | 20mo | $95,000 | $71 | 65 |
| 8701 Highway 41 #54 | 0.35mi | 2/2.0 (-1) | 1,248 (-13%) | 5mo | $249,000 | $200 | 52 |
Match score weights: distance 35% · size 25% · config 20% · recency 20%. Top-matched comps best support the ARV.
Projected returns pro-forma
-3.0% appreciation · 1.91% rent growth · sell at horizon
- IRR
- 26.9%
- Equity multiple
- 2.10×
- Total profit
- $33,886
- Equity at exit
- $16,401
- IRR
- 33.8%
- Equity multiple
- 3.91×
- Total profit
- $89,526
- Equity at exit
- $9,511
Cash invested: $30,800 (down + closing). Projections, not guarantees.
Landlord ↔ Tenant lean methodology
- Overall (STATE)
- 18 Strongly Tenant-Friendly
- State California
- 18 Strongly Tenant-Friendly · D+13
- County
- — inherits STATE
- City
- — inherits STATE
ZIP-level market 93720
- Rents YoY
- 1.9%
- Active inventory
- 176
- Price-to-rent
- 3.8×
Monthly cashflow live
- Estimated rent
- $2,435 high interval (Pro) →
- Mortgage (P&I)
- −$577
- Tax from tax record
- −$25 /mo · $297/yr
- Insurance
- −$46
- Flood insurance flood zone
- −$427 /mo · $5,118/yr
- HOA
- −$0
- Vacancy / Maint / Mgmt
- −$511
- Net cashflow
- $850
Break-even live
UW: 25.0% down · 7.5% · 30yr · 1.5% tax · 5.0% vac · 8.0% maint · 8.0% mgmt
Financing live
Cash to close
- Down payment
- $27,500
- Closing costs
- $3,300
- Reserves months
- —
- Total cash needed
- —
Loan-product check · same deal, 3 products live
Conventional
25% down · 7.5% · 30yr
- Down + closing
- —
- Monthly P&I
- —
- Monthly cashflow
- —
- DSCR
- —
- Eligible?
- —
Personal DTI + credit; lowest rate.
DSCR
20% down · 8.5% · 30yr
- Down + closing
- —
- Monthly P&I
- —
- Monthly cashflow
- —
- DSCR
- —
- Eligible?
- —
No personal income docs; deal must DSCR.
Hard money
10% down · 12.0% · 12mo
- Down + closing
- —
- Monthly P&I
- —
- Monthly cashflow
- —
- DSCR
- —
- Eligible?
- —
Short-term bridge; refi at stabilization.
Rent comps 6 comps
| Address | Beds | Baths | Sqft | Rent | $/sqft | DOM | Units | Dist |
|---|---|---|---|---|---|---|---|---|
| 8884 N Del Mar Ave Unit 1 Fresno, CA | 2.0 | 2.0 | 1166 | $2,095 | $1.80 | 44d | 1 | 0.57mi |
| 326 E Deer Creek Ln Fresno, CA | 3.0 | 2.0 | 1464 | $2,650 | $1.81 | 23d | 1 | 0.82mi |
| 645 E Champlain Dr #106 Fresno, CA | 2.0 | 2.0 | 1307 | $2,200 | $1.68 | 44d | 1 | 1.03mi |
| 8476 N Del Mar Ave Fresno, CA | 4.0 | 2.0 | 1797 | $10,000 | $5.56 | 23d | 1 | 1.03mi |
| 9375 N Saybrook Dr Fresno, CA | 1.0–2.0 | 1.0–2.0 | 1088 | $2,462 | $2.26 | 2d | 25 | 1.20mi |
| 1044 E Manhattan Ave Fresno, CA | 4.0 | 2.0 | 1529 | $2,300 | $1.50 | 3d | 1 | 1.46mi |
Listing history 16 events
-
2026-06-18days on market $110,000 Active 44 DOM
-
2026-06-17days on market $110,000 Active 43 DOM
-
2026-06-16days on market $110,000 Active 42 DOM
-
2026-06-15days on market $110,000 Active 41 DOM
-
2026-06-13days on market $110,000 Active 39 DOM
-
2026-06-13days on market $110,000 Active 38 DOM
-
2026-06-10days on market $110,000 Active 36 DOM
-
2026-06-09days on market $110,000 Active 35 DOM
-
2026-06-08pricedays on market $110,000 Active 34 DOM
-
2026-06-07days on market $120,000 Active 33 DOM
-
2026-06-05days on market $120,000 Active 30 DOM
-
2026-06-03days on market $120,000 Active 29 DOM
-
2026-06-02days on market $120,000 Active 28 DOM
-
2026-06-01days on market $120,000 Active 27 DOM
-
2026-05-31days on market $120,000 Active 26 DOM
-
2026-04-17$120,000 Active 1014-char remark
ⓘ Source: listings_history table (triggers on properties + properties_extension) + one-shot
backfill from property_details.listing_events for pre-trigger history.
Tax reassessment forecast CA · Resets to sale price
- Current annual tax
- $297 · $25/mo
- Projected year-2 tax
- $836 · $70/mo
- Expected delta
- +$539/yr (+$45/mo · 181.5%)
ⓘ Screening estimate from a state-policy table — verify with the county assessor before closing.
Climate risk First Street
- Flood 4/10 Moderate FEMA zone AE · 17% chance over 30 yrs
- Wildfire 8/10 Severe
- Heat 8/10 Severe 7 d/yr ≥106°F today · 17 d/yr by 30 yrs out
- Wind 1/10 Low
- Air quality 10/10 Extreme 44 unhealthy d/yr today · 51 by 30 yrs out
Nearby sold comps map
Loading sold comps map…
Walkable amenities ~0.75 mi
Loading nearby amenities…
Taxation est. · year 1
- Rental income
- $29,222
- − Mortgage interest
- −$6,162
- − Property taxes
- −$297
- − Insurance
- −$5,668
- − Repairs & maintenance
- −$2,338
- − Management
- −$2,338
- − Depreciation
- −$3,200
- Taxable income
- $9,219
- Est. tax owed @ 24.0%
- −$2,213
- After-tax cash flow
- $7,985/yr
For passive investors: Depreciation is non-cash, so a rental often shows a tax loss while cash-flowing — sheltering income. Rental losses are passive: they offset passive income freely, and up to $25,000/yr can offset ordinary (W-2) income if you actively participate and your MAGI is under $100k (phasing out to $0 by $150k); unused losses carry forward. On sale, claimed depreciation is recaptured at up to 25%, and gains may owe capital-gains tax (a 1031 exchange can defer both). Figures are a year-1 estimate at your 24.0% rate — not tax advice; consult a CPA.
Schools (NCES district)
- District
- Clovis Unified
- NCES district ID
- 0609030
- Math proficiency
- 58% ▲ 1.00%
- Reading proficiency
- 72% ▲ 2.00%
- Median HH income
- $71,950
- Composite
- 58.7/100
- National rank
- #2003
- State rank
- #152 of 1400 in CA
Livability — Fresno
- Score
- 62/100
- State rank
- #469
- US rank
- #15907
Category grades
Schools grade is shown separately in the Schools card above.
Census & demographics
- Census place
- Fresno, CA
- County
- Fresno County · 834,801 people
- City population
- 593,114
- Metro
- Fresno, CA
- Population (ZIP)
- 50,089
- Household income
- $105,050
- Rent vs Own
- Severe rent burden
- 1796.0
Population outlook (Fresno County) Hauer SSP2
- Today (2025)
- 1,042,971 people
- By 2030
- 1,072,198 · +2.8%
- By 2040
- 1,122,408 · +7.6%
- By 2050
- 1,157,251 · +11.0%
- By 2075
- 1,182,575 · +13.4%
- By 2100
- 1,105,899 · +6.0%
Race, ethnicity, and origin ACS 2023
- Neighborhood character
- Diverse neighborhood (Simpson 0.67)
- Race & ethnicity
- White 48% Hispanic / Latino 28% Two or more races 16% Asian 16% Black 3%
- Hispanic origin (detail)
- Mexican 24%
- Common ancestry
- Russian 2% Slovak 1% Italian 1%
- Foreign-born
- 17% · Canada, China, Vietnam
- Languages at home
- 73% English-only · Spanish 10% Other Indo-European 6% Tagalog/Filipino 2%
Political lean MEDSL · Fresno
- 2024 margin
- Toss-up / Even · D 46.5% · R 50.9% · Other 2.6%
- 2008→2024 swing
- -6.5pp toward R · 2008: 2.1pp · 2024: -4.4pp
- All cycles
- 2024: R+4.4 2020: D+7.8 2016: D+3.9 2012: R+2.9 2008: D+2.1
Not yet ingested
- Civics
- —
Market trends
- HPI YoY
- ▼ -278.23%
- Current HPI
- 332.618
- Rent YoY
- ▲ 1.91%
- Metro
- Fresno, CA
- State GDP YoY
- ▲ 3.21%
- F500 in state
- 116
Industry mix (Fortune 500 HQ in CA)
| Industry | F500 HQs | Revenue |
|---|---|---|
| Technology | 27 | $1,492B |
|
||
| Financial Services | 3 | $174B |
|
||
| Retail | 3 | $44B |
|
||
| Insurance | 3 | $26B |
|
||
| Media / Entertainment | 2 | $115B |
|
||
| Pharmaceuticals / Biotech | 2 | $62B |
|
||
Price history
-8.3% since first listed2 events — show timeline
- 2026-06-08 Price Changed $110,000 FRESNOMLS
- 2026-04-17 Listed $120,000 FRESNOMLS
Cash-flow waterfall
monthlySold comps — $/sqft
last 12 mo · ≤1 miLoading sold comps…